Important News on February 7:
- CZ initiated a vote on "Should BNB Chain attempt to eliminate or actively reduce the MEV problem?"
- Ethereum gas fees continue to decline, currently reported at 0.87 Gwei.
- Bloomberg: Trump's new policies have plunged the crypto sector into a quagmire, and the U.S. system lacks effective oversight of the president.
- The U.S. non-farm payroll report for January will be released tonight at 21:30.
- Options worth $3.1 billion will expire today.
Conveying the way of trading, enjoying a wise life.
Ethereum is still referred to as "useless" by us. In our last discussion, after learning about the whale dynamics on the Ethereum chain, it dropped to $2,100, and with corresponding whales stepping in, it quickly rebounded.
Today, let's discuss Ethereum from a different perspective—the technical aspect of its future price trends, what risks it brings us, and where our opportunities lie. We will analyze it from three angles:

The horizontal trend line at the monthly chart level is $2,130, which is the level we mentioned where Ethereum last fell. This trend line is a dividing line between bulls and bears, and it is also a key level.
From the key resistance or support levels over the past few years, once broken, they become a form of resistance, and once broken upwards, they become support. Therefore, whether $2,100 can hold is crucial.
If it can stabilize, there is room for it to rise to $4,000 or even higher; if it cannot hold, then it will likely test the $1,400 level, which is also the lower band of the Bollinger Bands.
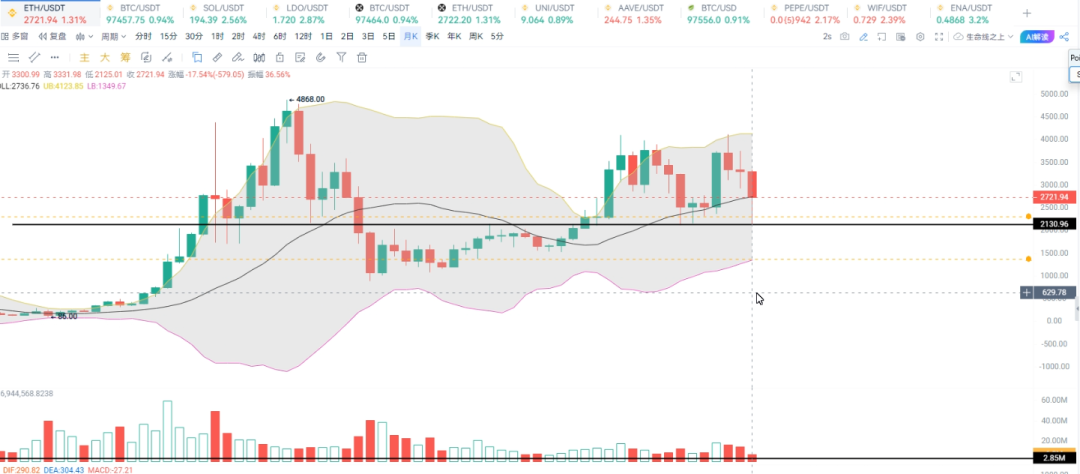
Of course, is it possible to drop to this level? We need to focus on one indicator, which is the monthly MACD. At this point, its closing is quite poor. This means that after the close in February, Ethereum has shown a bearish divergence at the monthly level.
This bearish divergence is actually related to Ethereum's downward movement. Its price level is $4,000, but this indicator's bullish momentum has not yet reached a new high, which means there is a risk of Ethereum dropping to around $1,400. Once it breaks $2,100, the next target will be $1,400. This is the risk we face, of course, from a monthly perspective.
At the monthly level, we also need to pay attention to another indicator, which is the middle band of the Bollinger Bands. The middle band of the Bollinger Bands is $2,730. We will see if the close in February can be above it; if it can close above, it can still support a rebound;
If it cannot close above, then Ethereum will likely see another downward test. The focus is on its top divergence and whether $2,100 can hold.

Returning to the weekly chart level, we find that Ethereum's price has actually touched the lower band of the Bollinger Bands, which we just mentioned is $2,100. It has also broken below the middle band of the Bollinger Bands, which is priced at $3,100.
So from the weekly level, the last time Ethereum broke below the middle band of the Bollinger Bands and touched the lower band was on August 5. During this period, it actually oscillated for nearly three months before welcoming a decent breakout.
Therefore, for Ethereum to break upwards, it must stand above $3,100. Before standing above $3,100, it will have a consolidation action, and this area is actually a consolidation action.
Only after consolidating can it break upwards, creating new upward space. Alternatively, it may continue to test previous lows, which we refer to as a second bottom.
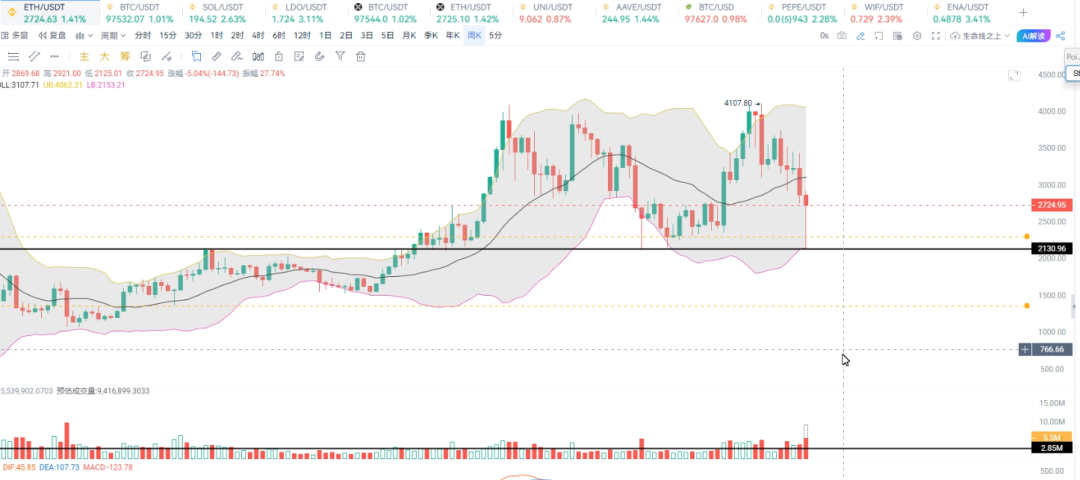
During the second bottom test, we need to focus on $2,130 or around $2,200. If the second bottom does not break the previous low, which is $2,100, then it is also an opportunity for us to buy low, and it may also be an entry opportunity for a strong rebound in Ethereum. This is the entry opportunity created by our weekly second test.
Even if you enter during the second test, the strong pressure at $3,100 is also very strong, so do not take it lightly. There will be short-term fluctuations, and there will also be short-term profit opportunities.
I do not recommend everyone to hold for a longer period; for a long time, we need to quietly lock in profits, or if it rebounds to $3,100, we can also take corresponding profits.
Because this matter is related to Bitcoin, my view is that Bitcoin has still not reached its bottom. If Bitcoin breaks $90,000, where do you think Ethereum will go?

From the daily chart level, after Ethereum's price touched $2,100, we know that the corresponding volume is at a massive level. How many times has this massive volume occurred?
February 3 was definitely one instance, August 5 was another, including in June 2024, and also on May 19, as well as during the last bull market's consolidation, all released massive levels of volume.
When massive volume is released, the market often sees a second upward attack, resulting in a retaliatory rise, or touching the bottom of the bull and bear markets.
So looking at previous instances, either during the bull market's consolidation, or after a massive drop in the bull market's washout, or at the bottom of the bear market. This time, including August 5, it was also during the bull market's consolidation phase.
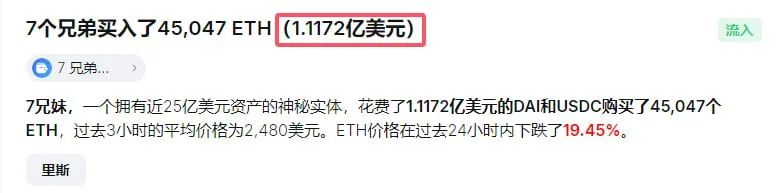
The key is whether the massive volume on February 3 is a continuation of the bull market or the start of a bear market. At this position, we say that at the massive volume level, there are seven whales who bought a lot of Ethereum, totaling $111 million.
So what is my view? We need to combine the trend of Bitcoin; if Bitcoin can maintain above $90,000 in the next two months, then Ethereum will fluctuate around $2,700, which is the upper boundary of this range. If it fluctuates up and down, it may surge towards $3,100 or even higher.
The fundamental logic for breaking through $3,100 or even higher is the Ethereum upgrade in Prague at the beginning of March. Today, we analyzed the risks, opportunities, and aspects worth looking forward to in Ethereum at the monthly, weekly, and daily levels from a technical perspective.
We just mentioned the Prague upgrade; in the next lesson, we will discuss what opportunities the Ethereum upgrade may bring us.
To learn more, you can follow our Binance media account [Crypto Academy No. 7] or contact our assistant to join VIP.
免责声明:本文章仅代表作者个人观点,不代表本平台的立场和观点。本文章仅供信息分享,不构成对任何人的任何投资建议。用户与作者之间的任何争议,与本平台无关。如网页中刊载的文章或图片涉及侵权,请提供相关的权利证明和身份证明发送邮件到support@aicoin.com,本平台相关工作人员将会进行核查。


