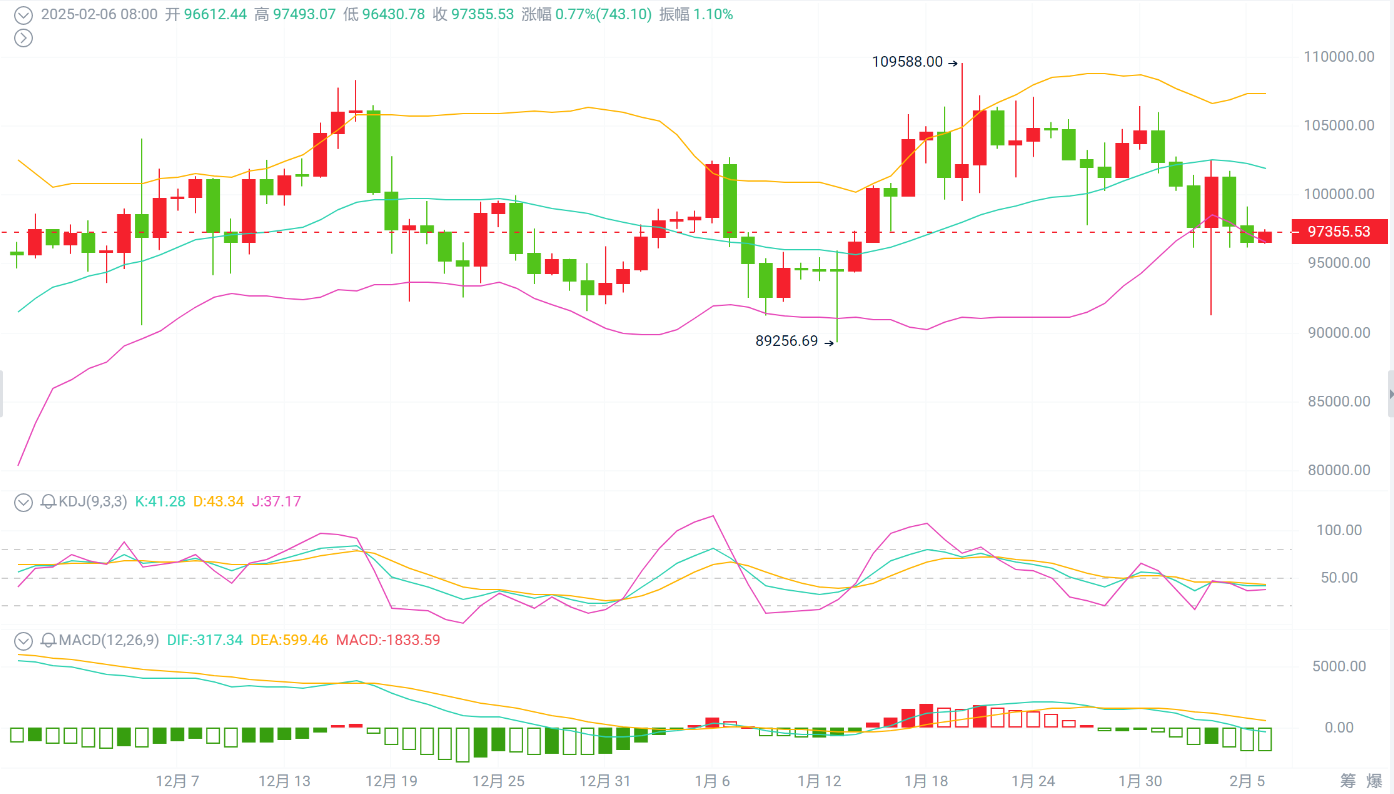
Bitcoin is overall showing a high-level oscillation and consolidation trend. On the daily K chart, the MACD indicator's green energy bars are gradually converging above the zero axis, and other indicators do not show significant upward or downward trends. The confrontation between bulls and bears remains tense. After a slight pullback in the early morning, Ethereum continues its strong trend. From the daily K chart perspective, the MACD indicator's green energy bars are diminishing above the zero axis, and other indicators also do not show a clear bullish or bearish trend.
On the 12-hour level, the MACD has shown a golden cross rebound sentiment, but the overall trend of BOLL is still sloping downwards (indicating that there is still strong pressure in the current trend). Therefore, in the short term, we continue to expect a downward oscillation. Specific points of reference are as follows:
BTC: Short at 98000-98500, target 96200
ETH: Short near 2830-2850, target 2730
The above is my personal intraday market analysis. For more real-time strategies and free guidance, click on the avatar to follow the homepage introduction. Welcome to exchange and learn together!

免责声明:本文章仅代表作者个人观点,不代表本平台的立场和观点。本文章仅供信息分享,不构成对任何人的任何投资建议。用户与作者之间的任何争议,与本平台无关。如网页中刊载的文章或图片涉及侵权,请提供相关的权利证明和身份证明发送邮件到support@aicoin.com,本平台相关工作人员将会进行核查。


