These 9 key indicators can help you assess market positions more scientifically.
Written by: BTC_Chopsticks
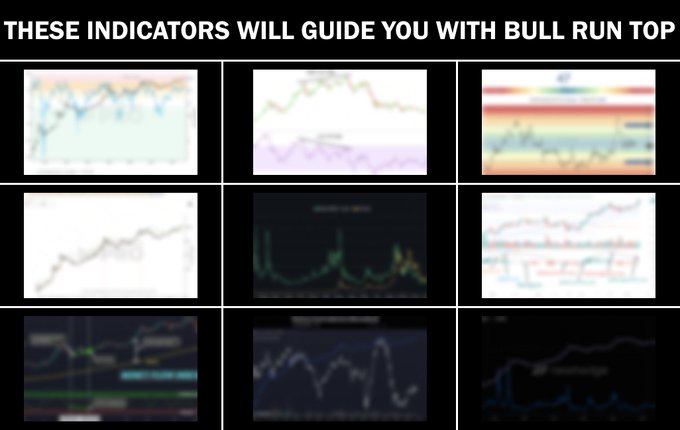
How to accurately predict the peak of a bull market? These 9 key indicators are essential for you to master!
Accurately predicting the peak of the crypto market bull run is nearly impossible, but you can use these data indicators to determine if the market is approaching its peak.
If 5 signals appear simultaneously, you have either accumulated enough wealth or you might have to go back to working at McDonald's…
Now, let's uncover the secrets of the bull market's end together.
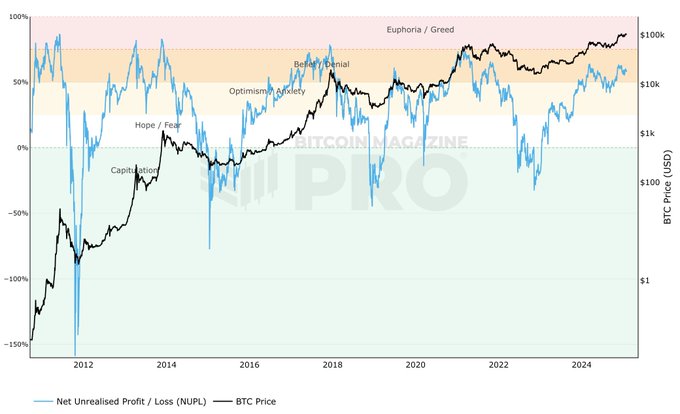
1. NUPL (Net Unrealized Profit/Loss)
Market sentiment indicator
When NUPL enters the euphoria/greed zone (over 75%), it usually indicates that the market is nearing its peak, and investors are becoming overly optimistic.
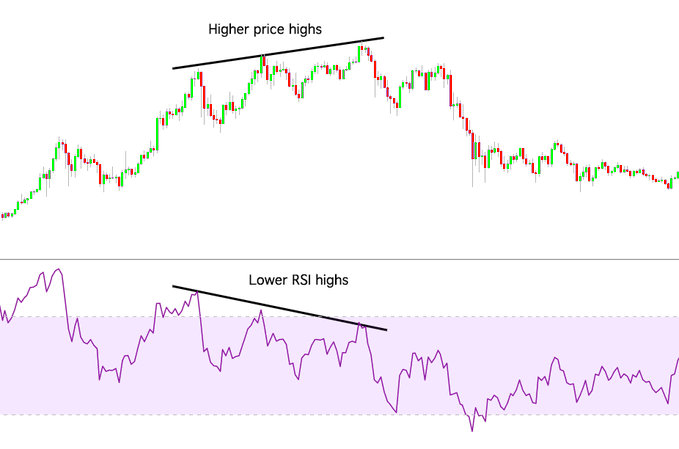
2. RSI (Relative Strength Index)
Short-term overbought signal
When RSI exceeds 90, the market is typically in an extreme overbought state. Historical data shows that peaks usually form within 4-7 weeks, followed by a correction.
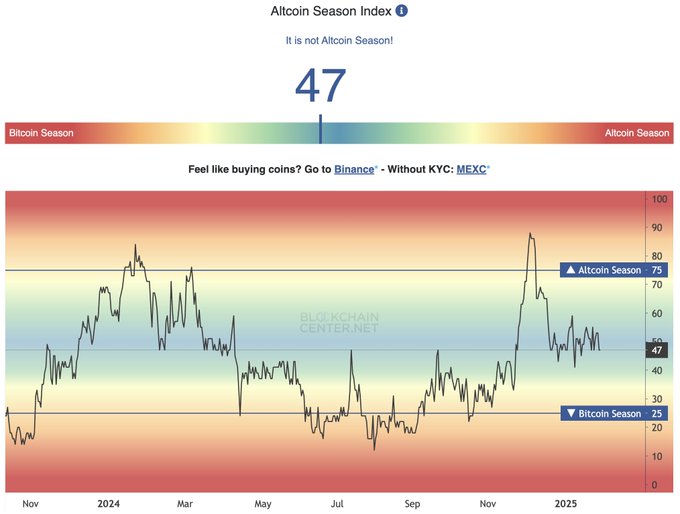
3. Altcoin Season Index
Altcoins vs Bitcoin
When the index exceeds 85, it indicates that altcoins are outperforming Bitcoin overall, which is often a sign that the market is entering a euphoric phase.
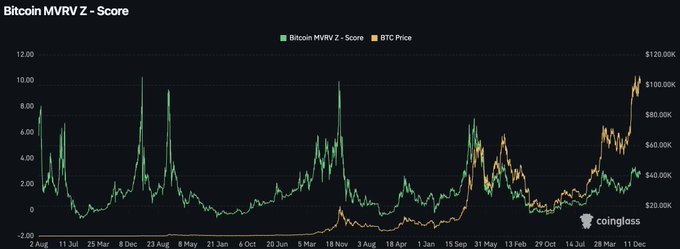
4. MVRV Z-Score (Market Value vs Realized Value)
Determining if the market is extremely overvalued
When the MVRV Z-Score exceeds 6, it suggests that the market may be nearing its peak, and caution is warranted regarding potential correction risks.
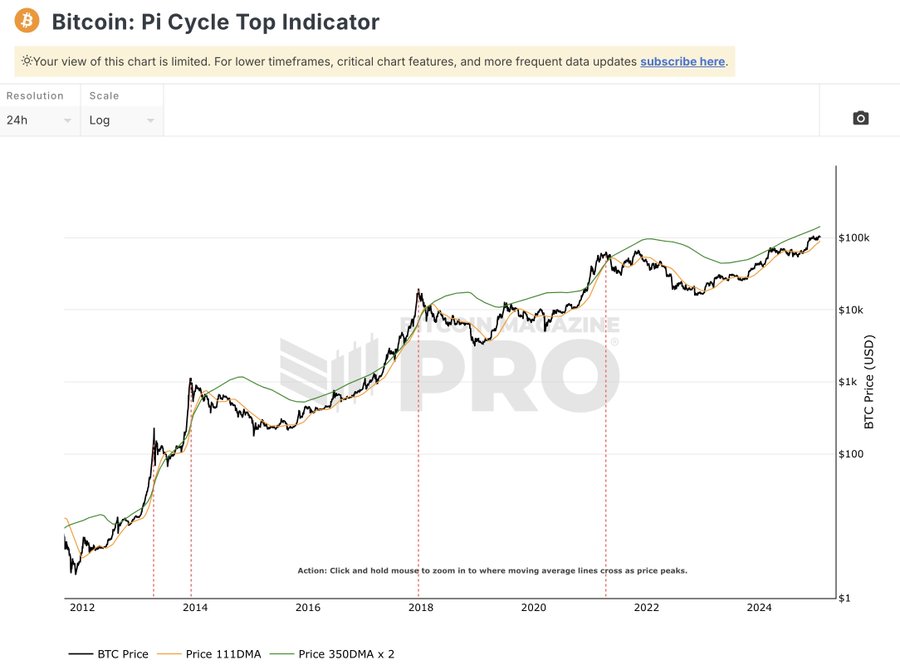
5. Pi Cycle Top Indicator
Accurately identifying Bitcoin bull market peaks
This indicator has successfully predicted major price highs for Bitcoin across multiple cycles.
When it issues a warning signal, it means the bull market is about to peak.
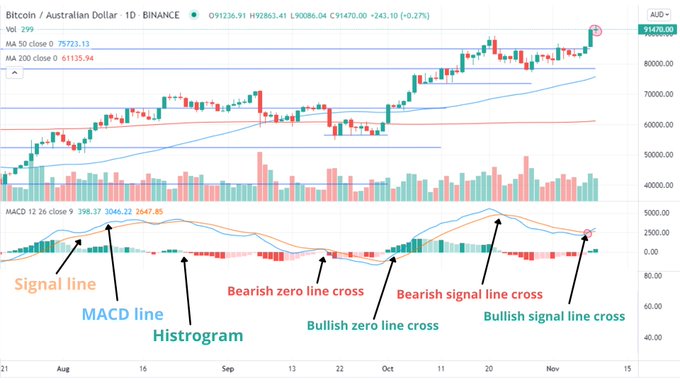
6. MACD (Moving Average Convergence Divergence)
Trend change and momentum signal
When the MACD shows a death cross, it indicates that market momentum is weakening, and a trend reversal may occur.
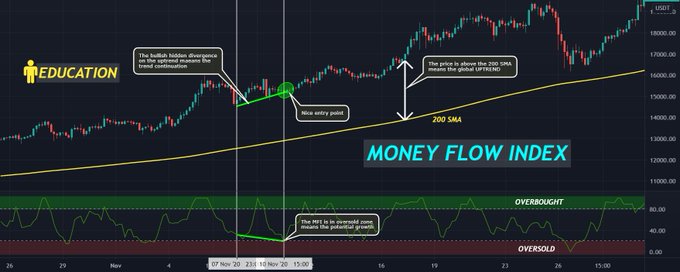
7. MFI (Money Flow Index)
Buy/sell pressure monitoring
Similar to RSI, but MFI incorporates volume data. When it shows extreme overbought conditions, it usually signals a market peak.
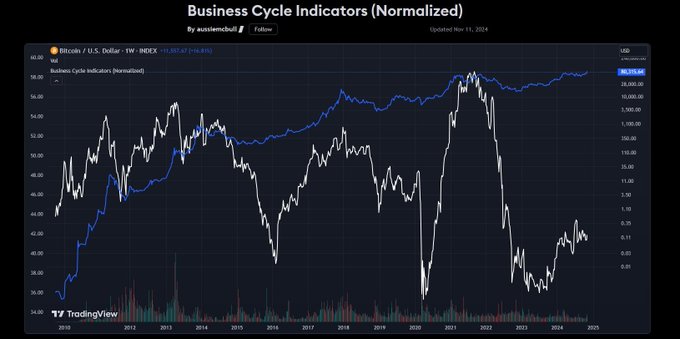
8. Composite Business Cycle Index
Macroeconomic impact
When this index exceeds 50, it indicates that the market may soon enter a peak phase.
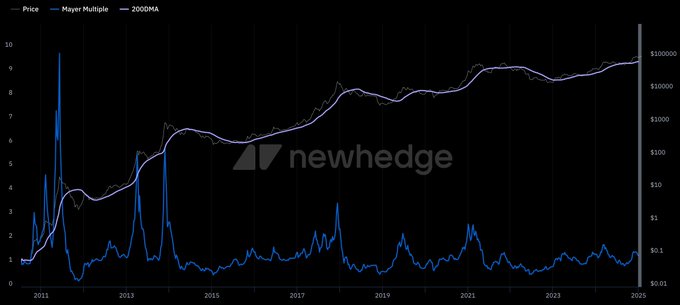
9. Mayer Multiple
Price vs 200-day moving average
Historical data shows that when the Mayer Multiple reaches 2.4, Bitcoin is typically at the peak of a bull market.
Conclusion
Although accurately predicting market peaks is challenging, these 9 indicators can help you assess market positions more scientifically. The bull market frenzy can lead to substantial profits, but without a clear exit strategy, it could also leave you back at square one overnight.
免责声明:本文章仅代表作者个人观点,不代表本平台的立场和观点。本文章仅供信息分享,不构成对任何人的任何投资建议。用户与作者之间的任何争议,与本平台无关。如网页中刊载的文章或图片涉及侵权,请提供相关的权利证明和身份证明发送邮件到support@aicoin.com,本平台相关工作人员将会进行核查。


