Bitcoin Breaks Historical High!
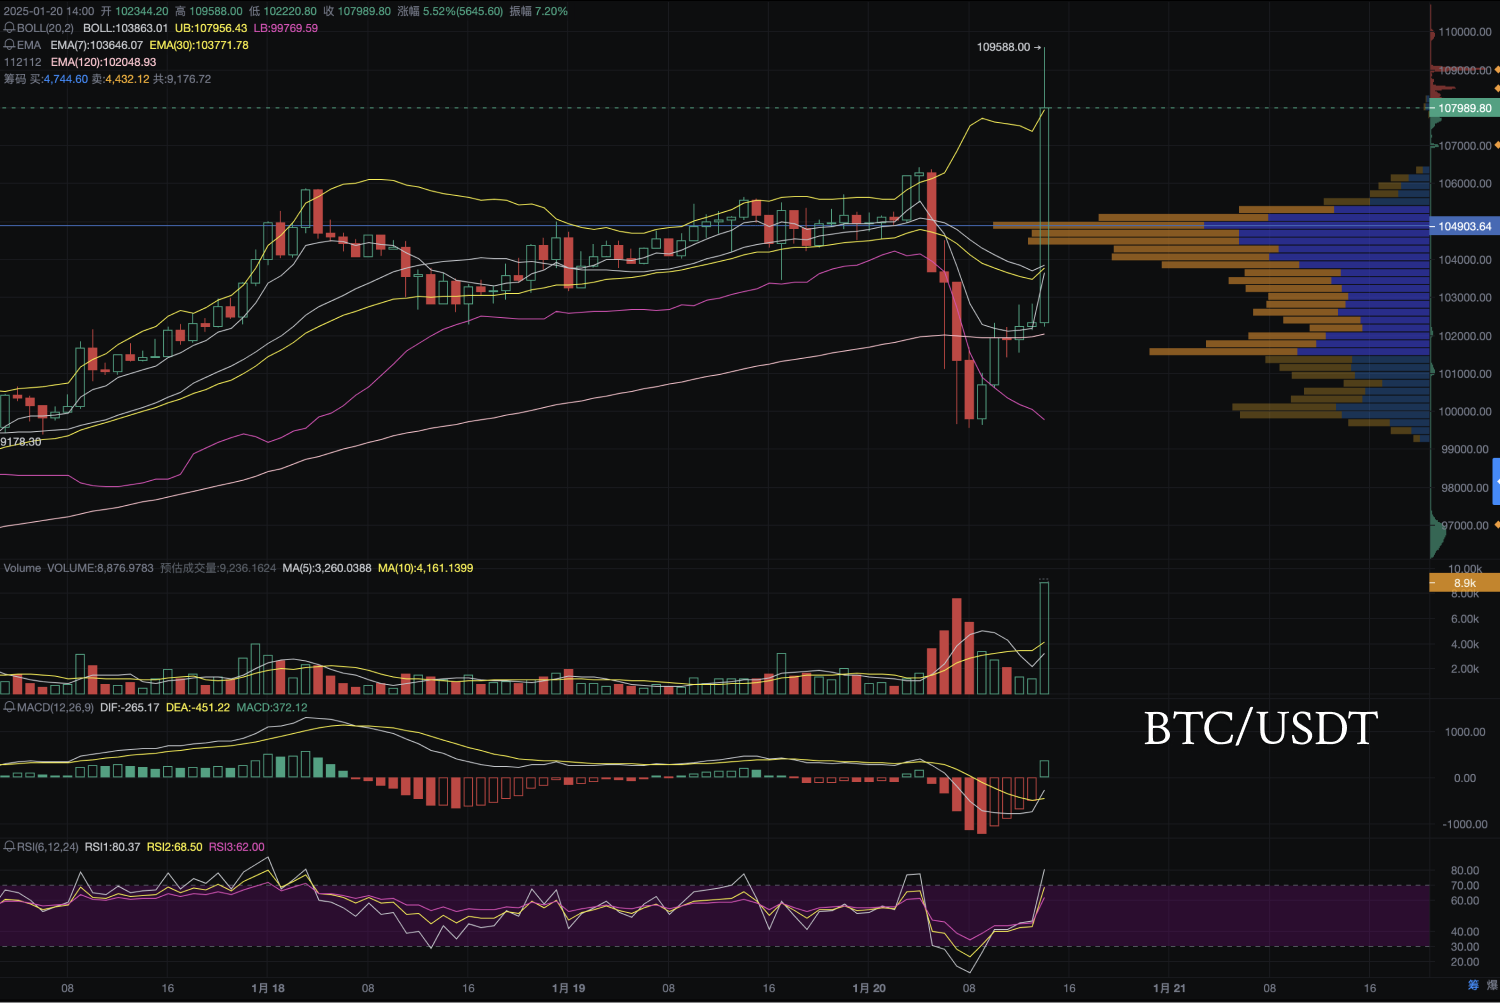
K-line Pattern: The recent hourly K-line shows a strong upward trend, with the price quickly rising from 102330.2 to 109855. On the daily level, a large bullish candle has formed, recovering most of the previous day's losses.
Technical Indicators:
The MACD has formed a golden cross on the hourly chart, with both DIF and DEA moving upwards, indicating strong bullish momentum in the short term.
The RSI on the hourly chart is at 68.1, close to the overbought zone, but has not yet entered extreme territory, leaving room for further upward movement.
EMA7, EMA30, and EMA120 are in a bullish arrangement, and the price is well above these moving averages, supporting the short-term upward trend.
Trading Volume: The hourly trading volume significantly increased at 14:00, reaching 35553, indicating heightened market activity and bullish participation. The daily trading volume has decreased compared to yesterday but remains at a high level, showing that market participants' enthusiasm is undiminished.

免责声明:本文章仅代表作者个人观点,不代表本平台的立场和观点。本文章仅供信息分享,不构成对任何人的任何投资建议。用户与作者之间的任何争议,与本平台无关。如网页中刊载的文章或图片涉及侵权,请提供相关的权利证明和身份证明发送邮件到support@aicoin.com,本平台相关工作人员将会进行核查。


