Important News on January 18:
- TRUMP becomes the third largest Meme coin by market capitalization in the crypto market.
- Massachusetts proposes to establish a "strategic Bitcoin reserve" in the state.
- Trump will deliver an inaugural speech at 1 AM on January 21.
- U.S. media: Biden will leave the task of enforcing the TikTok ban to Trump.
- Yesterday, the net inflow of Bitcoin spot ETFs in the U.S. was $975 million.
Conveying the way of trading, enjoying a wise life.

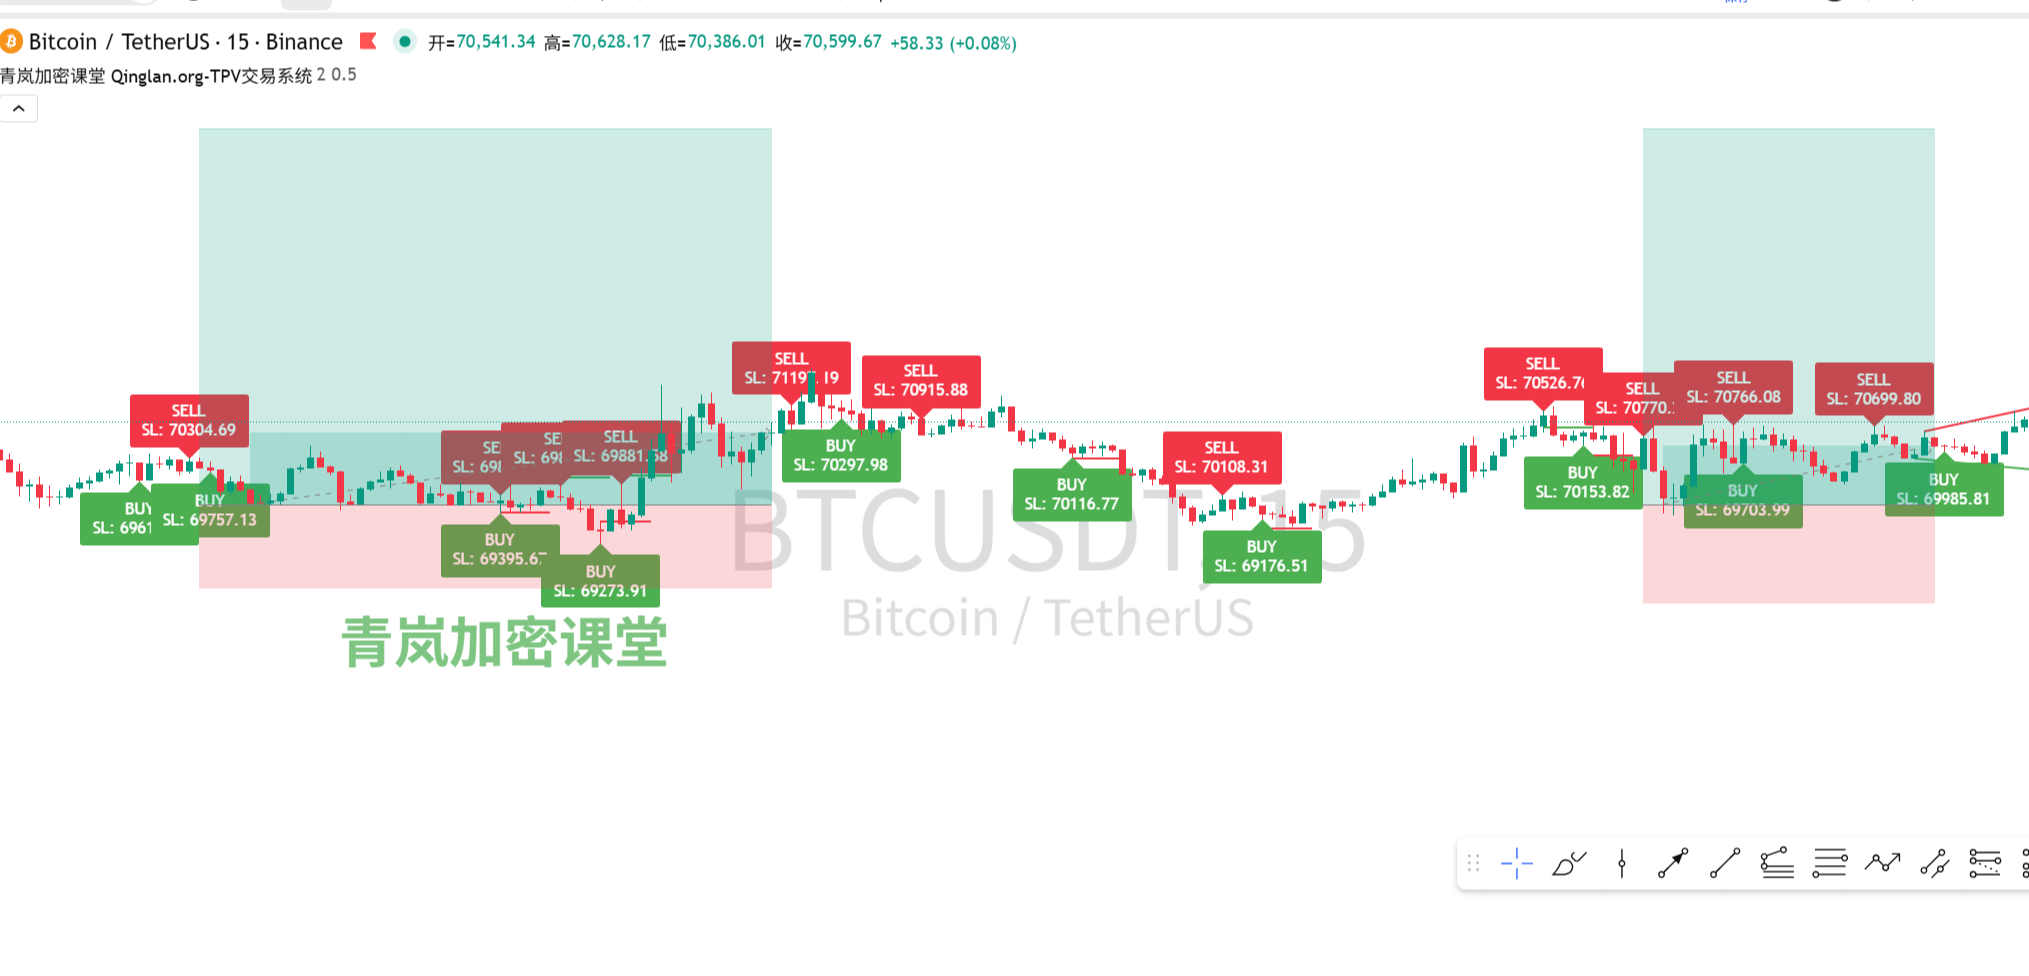
Bitcoin broke through the neckline at $102,700 yesterday, reaching a high of $105,000. Currently, Bitcoin has formed a double bottom on the daily chart, marking a pause. At this position, the neckline will become an important support level, turning from previous resistance to support. From yesterday's closing price, there is a long upper shadow, but the body is longer, indicating a strong bullish candle.
There was no significant volume on the downside, suggesting that selling pressure is not as strong as expected. At the same time, indicators have started to cross above the zero line, indicating that from a daily chart perspective, Bitcoin is clearly in an upward trend, reversing from a previous downtrend.
We talk about cycle resonance; not only is the daily chart showing an uptrend, but the 3-day chart is also slowly approaching the zero line. Once a golden cross forms at this position, it indicates that the daily and 3-day charts will resonate, making this position a bullish signal as well, so the 3-day chart also shows a bullish trend.
From the weekly chart perspective, we find that Bitcoin's price is very likely to form an engulfing pattern. If the closing price on Monday morning shows such a K-line, this position will serve as a platform, or support level.
Overall, regardless of short, medium, or long-term cycles, Bitcoin at the $91,500 position seems to indicate that this is the current relative bottom area. Of course, we previously mentioned the gap issue, and I believe the gap will still be revisited; it may not be this round, but the next round will likely revisit it.
At this stage, Bitcoin has reached a challenge at $110,000, which is the previous high. Therefore, we need to pay attention to whether Bitcoin will rise to the previous high or even higher. If Bitcoin pulls back in the short term, where will it pull back to? That is the point where we will add positions.
Returning to the daily chart, after this double bottom formation, the daily level is clearly $102,500. We see this position as its neckline support, which is also a point for adding positions. This position cannot be broken; if it breaks, it will be troublesome. So Bitcoin has broken through two points in one breath: one is a horizontal level, and the other is a trendline resistance point. Therefore, breaking through this point, the Trump effect is still quite evident.
Now looking at the 4-hour level, we see that Bitcoin has formed an engulfing pattern, which can also be seen as parallel. The appearance of this K-line combination at the top clearly indicates a need for a pullback, so in the short term, Bitcoin is expected to pull back. The first target for the pullback is $102,400.
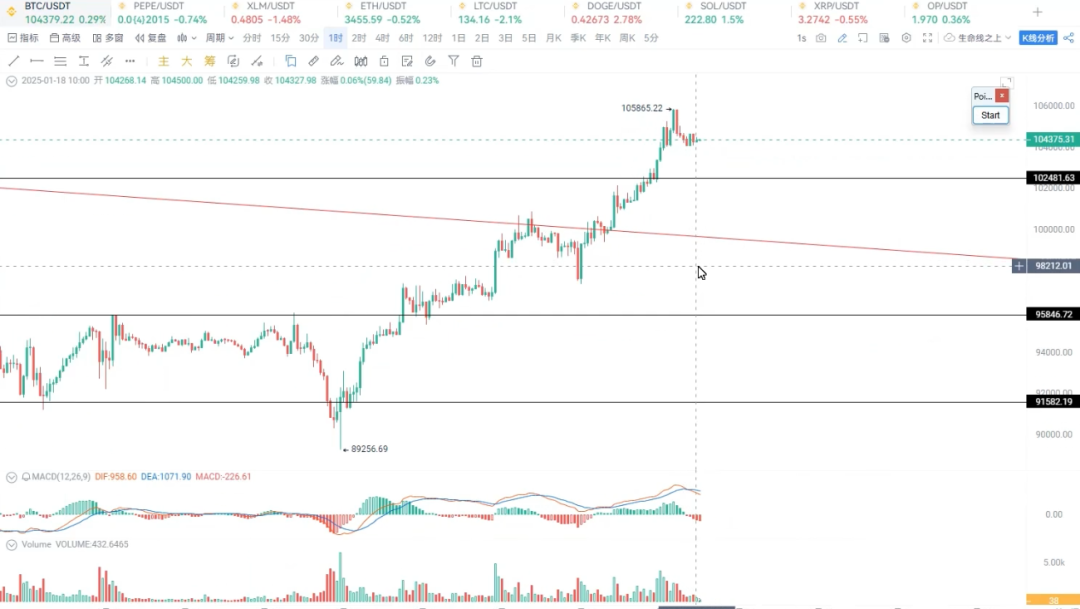
At the hourly level, after Bitcoin's price formed an engulfing pattern, it has slowly consolidated. I believe the probability of Bitcoin moving down is very high. So if the first support breaks, where will it go? It will head towards the $100,000 area. This is the short-term pullback trend for Bitcoin.
We know that long cycles rise, short cycles fall, so it is definitely a time to enter the market. If Bitcoin rises, it will likely first challenge $110,000. We measure through channels and find that channels are still very useful. At this point, Bitcoin has traversed two channels; looking at the 3-day chart, if this is a phase bottom, then it still needs to rise, so its channel upper boundary is $115,000, meaning Bitcoin has a potential upward range of 10,000 points.
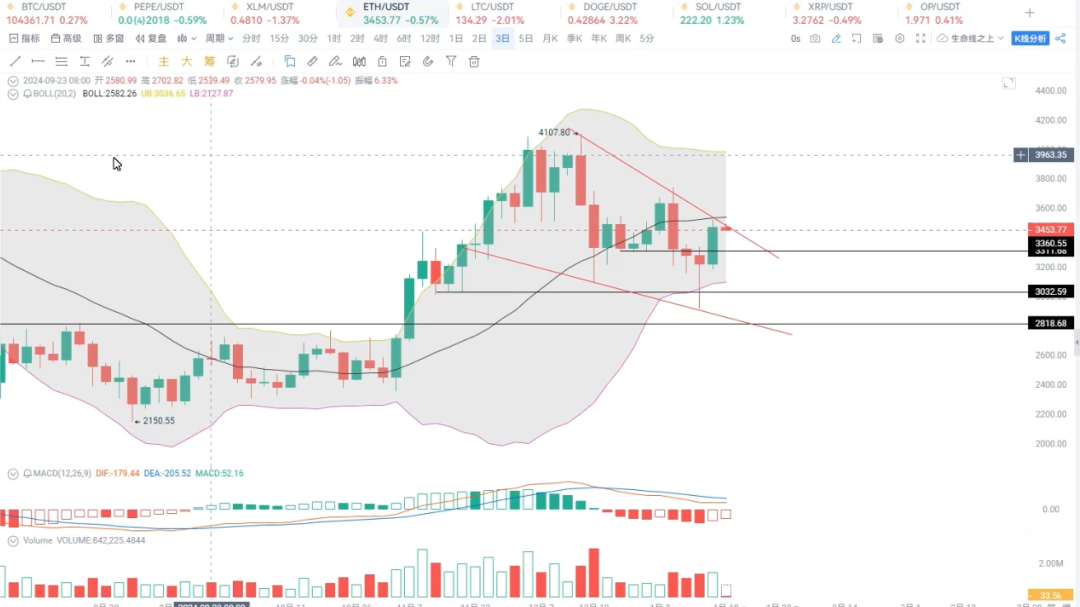
Returning to Ethereum, Ethereum is facing multiple pressures. The pullback to $3,360 is Ethereum's support level. From the daily chart perspective, Ethereum is also encountering this position, and its indicators are forming a double bottom, with the fast and slow lines forming a double bottom and diverging, making this position precarious.
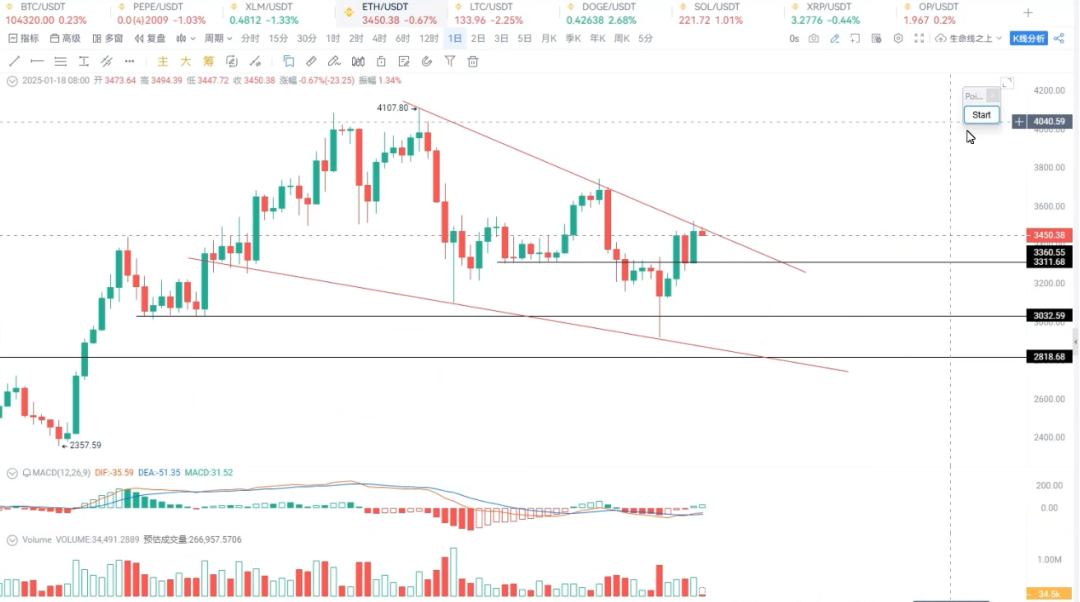
It can break upwards, but it can also pull back. For the pullback, we focus on $3,360, which is our point for adding positions or re-entering.
The resistance level remains at $3,500, and after $3,500, it is $3,700. Only after breaking this position can we say that Ethereum's price will break the previous high. Therefore, Ethereum's performance is currently still considered weak, weaker than SOL.

At least SOL has reached near the neckline, breaking through the lower level of this downtrend line, reaching $220, which becomes a very important resistance for SOL. Only after breaking this point can it move forward.
So from a short-term perspective, SOL also has a need for a pullback. From the intraday perspective, SOL has been diverging at this point, with indicators making new lows while prices continue to make new highs, so I believe SOL is likely to undergo another adjustment, an intraday adjustment.
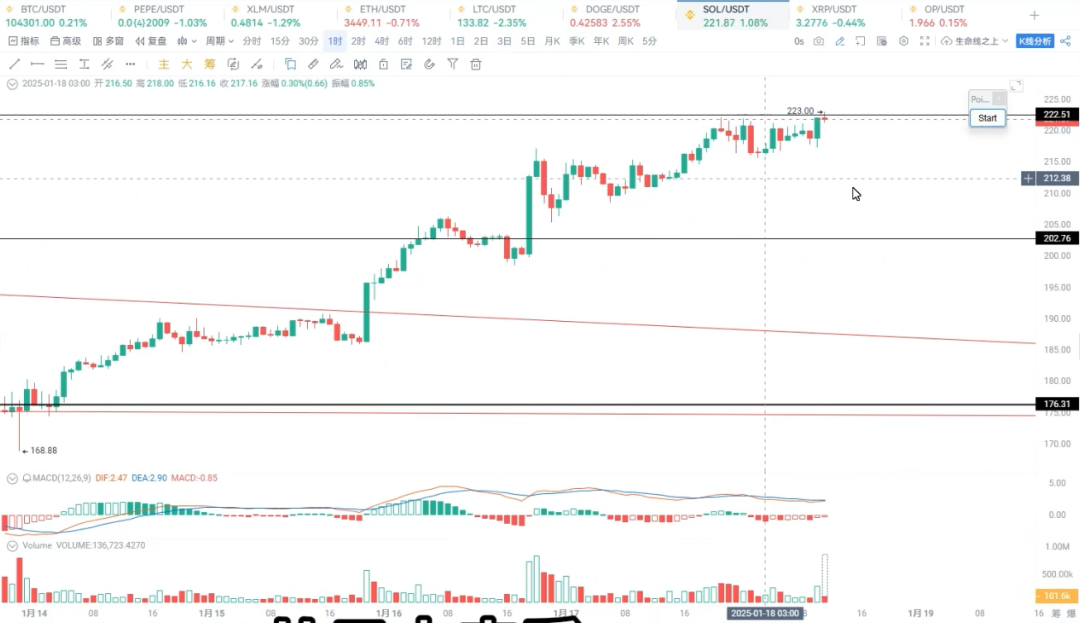
The support level for this adjustment is first at $215, and the second position is at $206. These two places will form support, but this area is also a point for adding positions. Therefore, at this position, the first test generally has a low probability of passing, and SOL will gather strength afterward.

Stellar has broken through the horizontal level, so a pullback to $0.46 - $0.47 can be considered for re-entry.
From the daily chart perspective, Stellar has been consolidating for three days, indicating that Stellar is also waiting for Ripple, as Stellar, Ripple, and ADA are sister coins, they rise together, fall together, and consolidate together; this has been a consensus for many years.
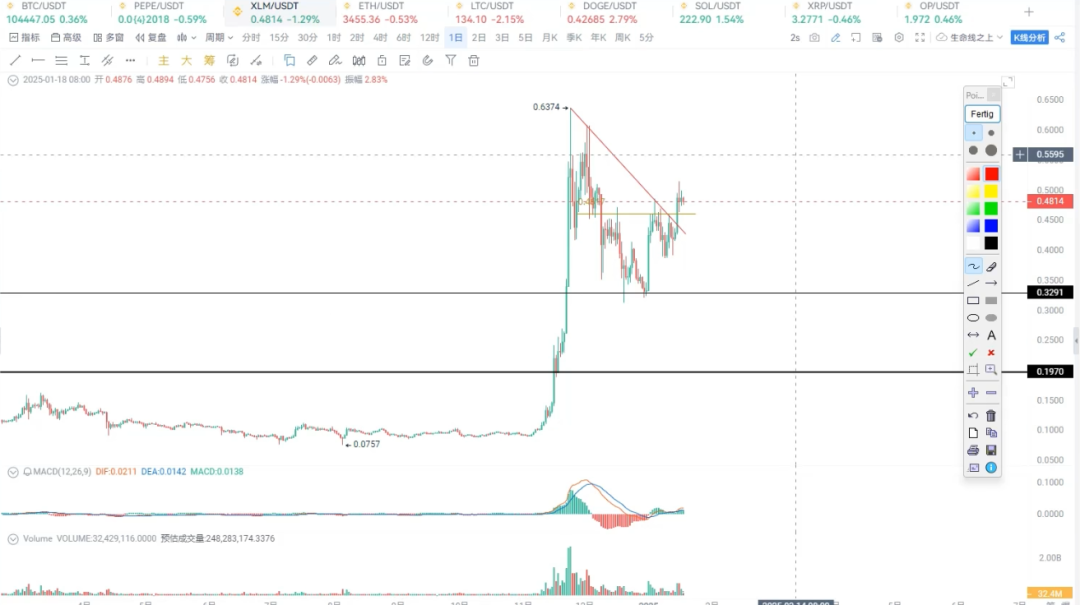
Stellar has formed a head and shoulders bottom at this point, so next, Stellar is likely to run towards $0.60, and if it breaks $0.60, where will the next target be? It will rise to $0.80. Therefore, I believe it is not difficult for Stellar to break the historical high this time, so a brief pullback is a good opportunity for you to enter the market.
Are there any other coins worth our attention? Of course, there are. Which coins are suitable for layout during this pullback? You can pay attention to Binance Square's No. 7 Crypto Academy. They update trading opportunities and follow-up situations for the market and altcoins every day.
To learn more, you can contact our assistant and join the VIP group.
免责声明:本文章仅代表作者个人观点,不代表本平台的立场和观点。本文章仅供信息分享,不构成对任何人的任何投资建议。用户与作者之间的任何争议,与本平台无关。如网页中刊载的文章或图片涉及侵权,请提供相关的权利证明和身份证明发送邮件到support@aicoin.com,本平台相关工作人员将会进行核查。