Important News on January 16:
- Texas Senator proposes a bill to establish the first state-level Bitcoin strategic reserve in the U.S.
- $349 million liquidated across the network in the past 24 hours, with both long and short positions affected.
- Data: XRP whales have accumulated 1.4 billion XRP in the past two months, worth approximately $3.8 billion.
- ETF analysts predict that Litecoin will be the next cryptocurrency ETF to be approved.
- Sources: The SEC is prepared to advance cryptocurrency policy reforms immediately after Trump takes office.
Conveying the way of trading, enjoying a wise life.

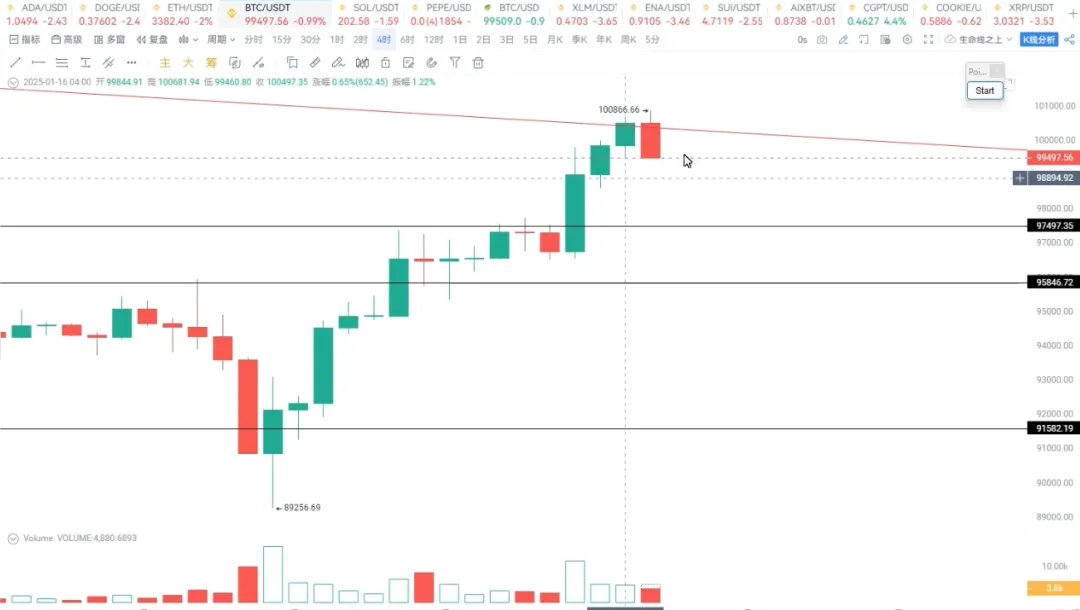
The rise of Bitcoin can be divided into three stages. The first stage was the day before yesterday, when Bitcoin dipped to $89,000 after breaking below the important support level of $91,500, reaching $89,000 and closing with a doji. If this situation is accompanied by volume, it can be considered a brief bottom.
The second stage was the release of the CPI data, which occurred last night. The release of this CPI data pushed Bitcoin's price to $100,000. When it reached this level, it began to encounter significant resistance. This resistance is the descending trend line formed by the first high of $108,353 and the second high of $102,700. Therefore, Bitcoin encountered resistance exactly at the $100,000 level, which is where the descending trend line lies. Looking at today's chart, it has started to pull back. Does this mean that Bitcoin cannot effectively break above $100,000, or even if it does break through, it would only indicate a mid-term upward reversal trend for Bitcoin?
This leads us to the third stage, which is Trump's inauguration. If this event can push Bitcoin's price up to what we call the neckline, which is the second high of $102,700, we would refer to it as the formation of a double bottom structure. Once this neckline is established and a breakout occurs with volume, Bitcoin is very likely to create new highs, moving towards targets of $110,000, $120,000, or even $130,000. However, we must first consider whether Bitcoin can effectively find support during this pullback and to what level it will retrace.
We see that on the 4-hour chart, it will close at 12 o'clock. From the current trend, it does not look ideal and may be a bearish engulfing pattern.

So its first support level should be set at $97,500. This means there is a dense trading area at this position. Therefore, $97,500 is the first important support for Bitcoin.
So if you have no positions here, or if your positions are small, you might consider adding to your position at this level.
The second important support is at $95,800. Thus, $95,800 is the second important support, and we should focus more on adding positions here. If $95,800 is also broken, what does that indicate? It indicates that this round of upward movement has ended. Therefore, Bitcoin still faces a significant deep pullback.
As mentioned earlier, $102,700 is a crucial point; if it cannot effectively break above, it could lead to a significant drop or a deep retracement. Today we need to pay attention to the positions of $97,500 and $95,800. The current price is $99,000, which is still some distance from those levels. If we look for another point, from the hourly chart, we can see that $98,600 is also a short-term support level.

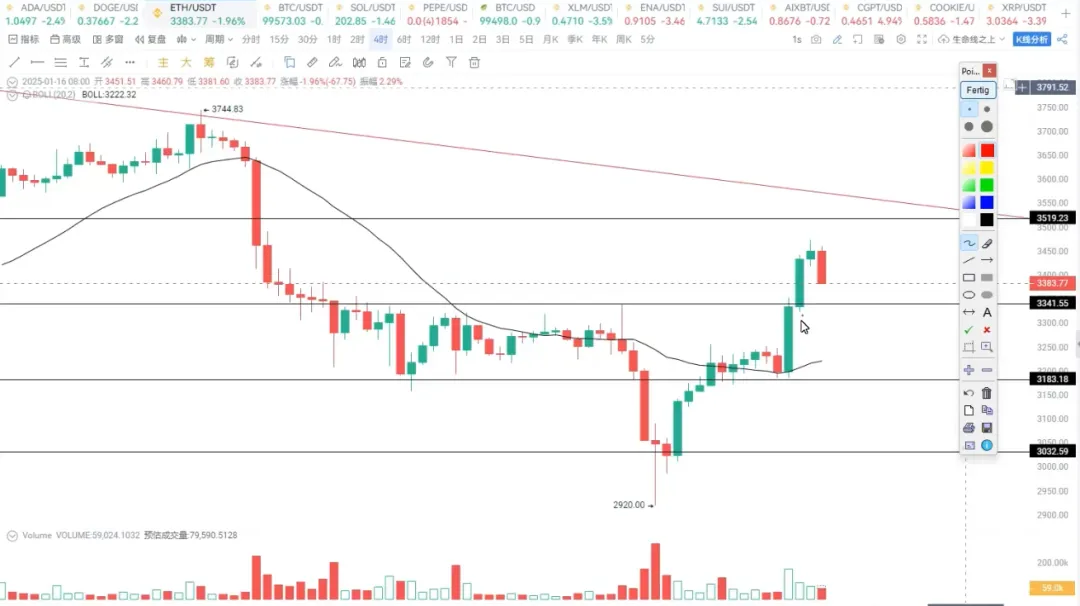
Returning to Ethereum, it closed with a long bullish candle yesterday. At this position, it has also risen above the middle band of the Bollinger Bands. Now, as it retraces to the middle band, its effective support should be set at $3,341. Thus, $3,341 becomes an important defense for Ethereum, where you can add to your position or go long.
In this case, Ethereum, like Bitcoin, is also under pressure from a descending trend line. Its first target is actually $3,520. Does breaking $3,520 mean that this market will reverse in the short term?
Not necessarily. It must break above $3,700, which is similar to Bitcoin's $102,700, as it is the neckline. Breaking the neckline and creating new highs is essential; otherwise, it will still face corresponding pullbacks.

So the first target is $3,520, with support at $3,341. This $3,341, in my view, is a point for going long and also a point for adding to positions. What if it breaks? What if it goes lower? If it breaks, it will head towards $3,200. If it breaks $3,183, it indicates that the way up is the same as the way down, suggesting an adjustment and the end of this rebound. Of course, we shouldn't be pessimistic; the current pullback is actually a normal retracement, a common occurrence of hitting resistance after a rise. Everything we just discussed is based on certain premises and foundations. So now we should focus on buying on dips and adding to positions on dips, and not overthink other aspects.
For more information, you can contact our assistant and join the VIP group.
免责声明:本文章仅代表作者个人观点,不代表本平台的立场和观点。本文章仅供信息分享,不构成对任何人的任何投资建议。用户与作者之间的任何争议,与本平台无关。如网页中刊载的文章或图片涉及侵权,请提供相关的权利证明和身份证明发送邮件到support@aicoin.com,本平台相关工作人员将会进行核查。


