Pattern Analysis
Based on the Bitcoin candlestick chart from AICoin, an analysis of Bitcoin's trend is conducted according to pattern theory:
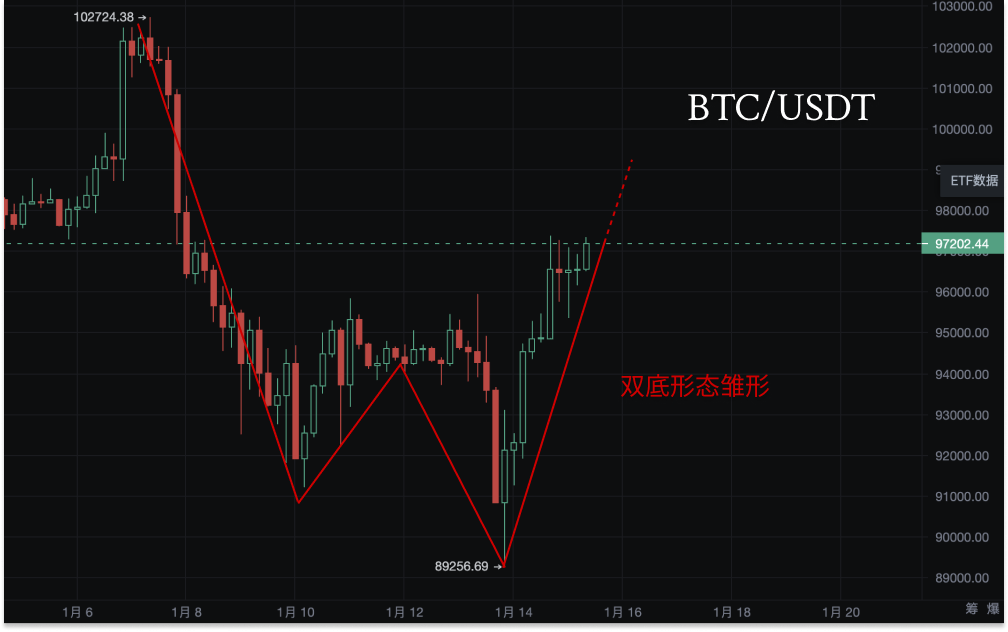
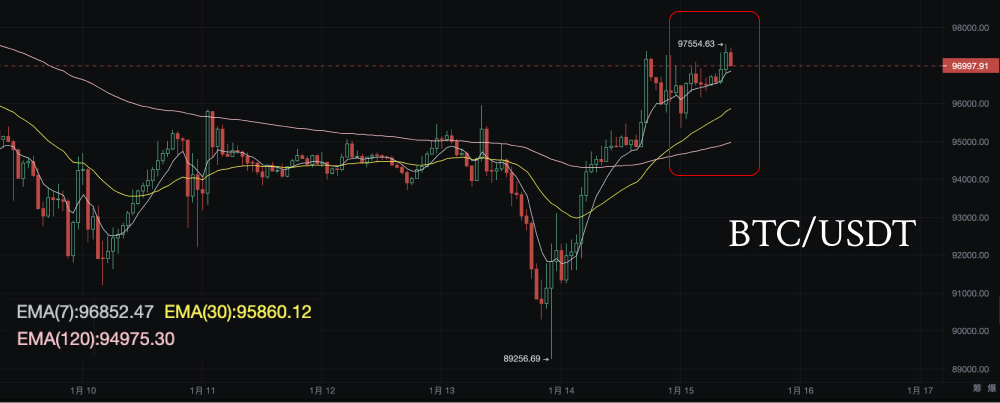
Pattern Recognition: Recent Bitcoin candlesticks show a clear embryonic W-bottom pattern (double bottom pattern), characterized by the price making two downward probes at the low point, followed by a significant rebound.
- Left Bottom: A deeper price correction, with the low possibly occurring between January 10 and January 13.
- Right Bottom: The second low formed around January 14, followed by a strong rebound, creating the right half of the double bottom structure.
Long-term Trend Judgment: If the double bottom pattern is confirmed and accompanied by a volume breakout at the neckline, the long-term upward target can be estimated by measuring the vertical distance from the neckline to the bottom and extending that distance upward. The target may approach the 100,000 area, which needs to be combined with the trading volume and market sentiment after the breakout.
Key Support and Resistance Analysis
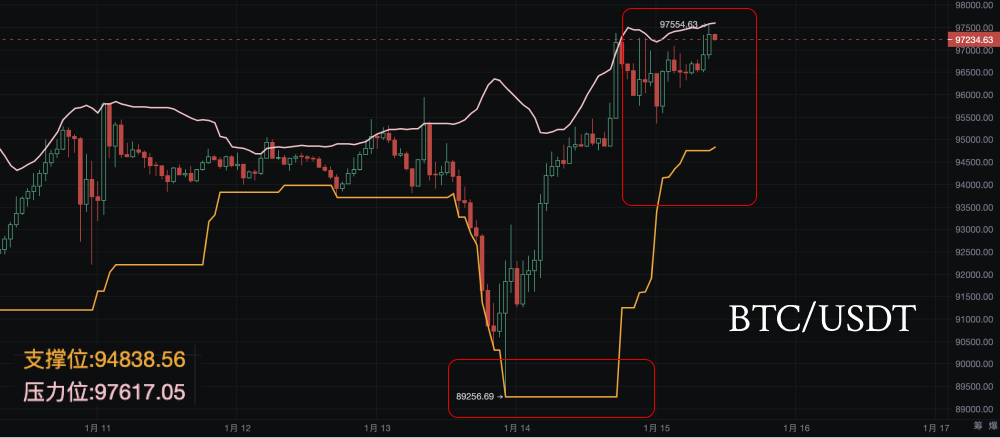
Resistance Level Analysis: 97617 (Strong Resistance)
- Technical Significance: 97617 is the current key resistance point, indicating that the price has encountered obstacles multiple times during the previous rise and has not effectively broken through, showing strong selling pressure at this level.
- Market Behavior: When approaching or touching 97617, a large number of sell orders may emerge, causing a short-term price retreat.
- Breakout Conditions: A significant enhancement in bullish sentiment is needed, accompanied by increased trading volume. If the price strongly breaks through this resistance, it may further open up upward space.
Support Level Analysis: 89256 (Strong Support)
- Technical Significance: 89256 is a lower strong support level, showing that historically, the price has received support and rebounded multiple times at this position. This may be a psychological defense line for market participants.
- Market Behavior: If the price falls to this level, bulls may increase their buying, supporting a rebound. If it breaks down, the market may further decline, and sentiment may weaken.
- Breakdown Risk: A breakdown below this support will trigger more bearish sentiment, potentially leading to a rapid price drop.
Support Level Analysis: 94838 (Secondary Support)
- Technical Significance: 94838 is the bottom of the recent oscillation range, representing a short-term weak support.
- Market Behavior: If the price short-term retraces but stabilizes at 94838, it may attract bottom-fishing funds to push the price up.
Risk Warning: If the price is blocked at the neckline and accompanied by a decrease in volume or a bearish candlestick retracement, the double bottom pattern may fail, and attention should be paid to the retest of support level 89256.
Short-term Patterns and Volatility
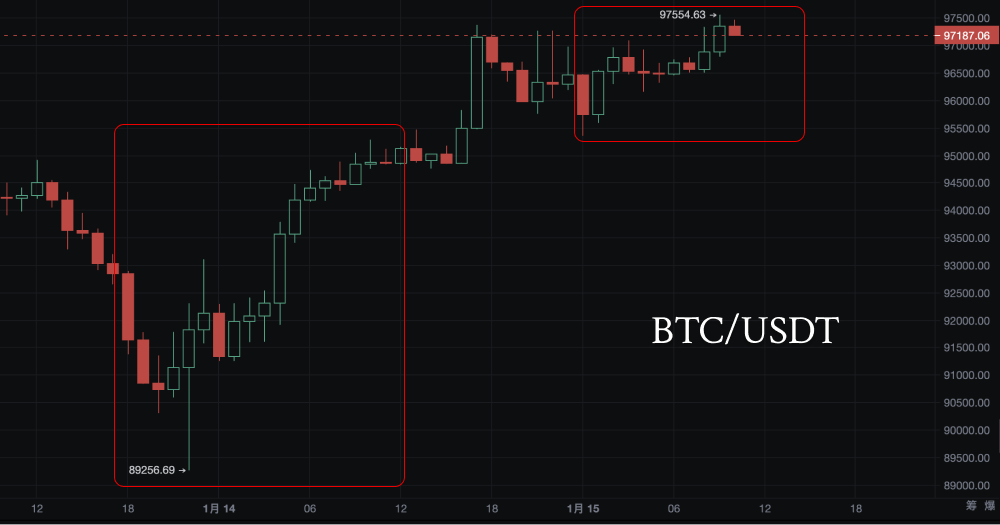
From a short-term perspective, analyzing Bitcoin's recent trend, the candlestick chart shows that Bitcoin is in a short-term upward oscillation trend: the lower lows are continuously rising, indicating strengthening bullish power. The upper side is gradually approaching the neckline resistance level of 97371, but it has not yet fully broken through.
Recently, the price has oscillated at a high level, forming a relatively narrow range of fluctuations. Some long upper shadows have appeared on the daily candlestick chart, indicating some selling pressure above.
Technical Indicator Analysis
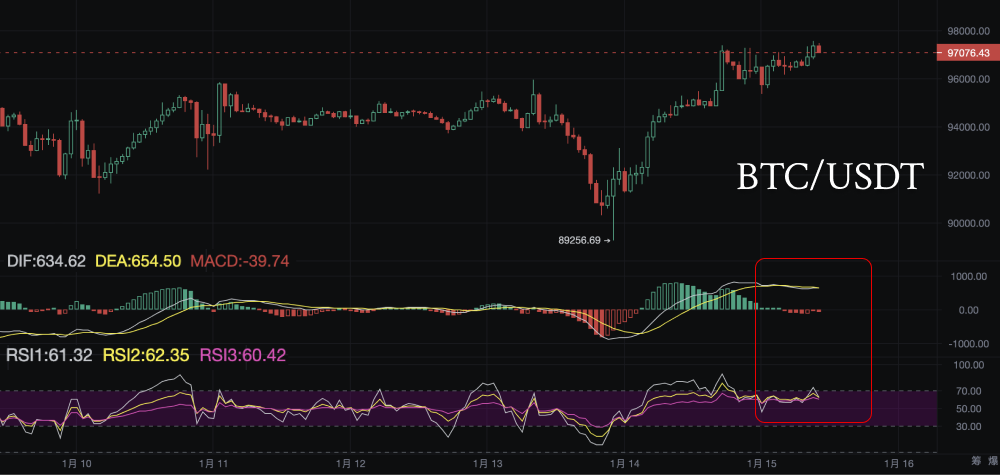
MACD: The hourly MACD is near the zero axis, with a tug-of-war between bulls and bears, but the daily level still maintains a bullish trend.
RSI: The hourly RSI is close to the overbought area, which may face short-term retracement pressure; however, the daily level has not yet entered the extreme area, overall leaning towards a strong position.
EMA: The current price is above EMA7 and EMA30, indicating that the short-term trend remains upward, but attention should be paid to the support strength of EMA7.
Bollinger Band Analysis
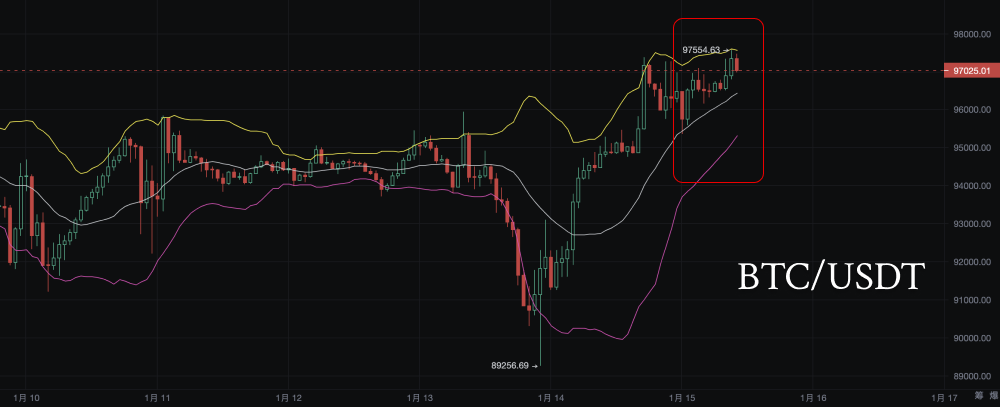
- Current Trend Characteristics: Upper Band Touch and Breakthrough: The red box shows that Bitcoin's price has repeatedly touched and broken through the upper Bollinger Band (with a maximum of 97554.63), indicating that the market may have entered the overbought range.
- Bollinger Band Opening: The Bollinger Band has significantly opened since January 13, indicating increased market volatility and the price entering a strong trend.
- Middle Band Support: From January 14 to January 15, the price has continuously moved upward along the middle band, not significantly breaking below it, indicating strong bullish momentum.
- Technical Signal: The price near the upper band has shown signs of stagnation, which may suggest an increased risk of short-term profit-taking. If the price falls back to the middle band (around 96000), it can still be considered a normal trend retracement.
Large Transactions & Chip Distribution Analysis
Large Transaction Analysis
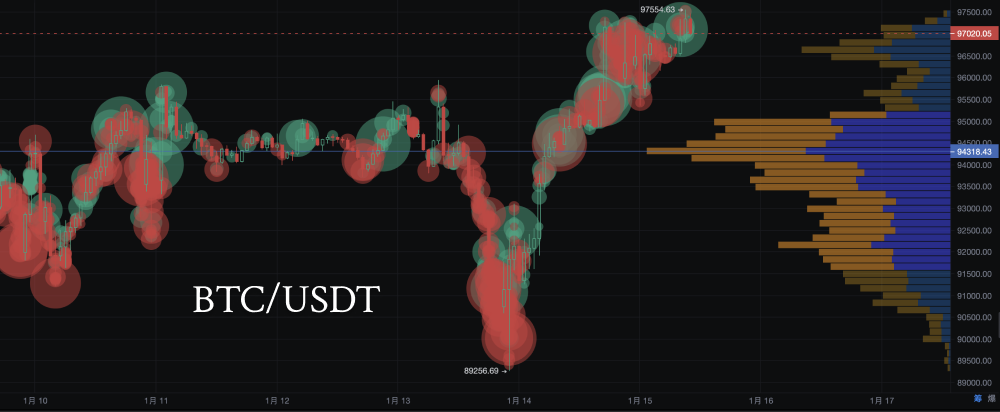
- Red and Green Dot Interpretation: Large Red (Sell Orders): Near the high point of 97554.63, the number of red bubbles has significantly increased, indicating a concentration of large sell orders, which may represent short-term top pressure.
- Green (Buy Orders) Support: Around 94000, the green bubbles are dense, indicating strong support willingness from bullish funds in this area.
- Bull-Bear Comparison: Large sell orders are dense above, which may suppress further price increases; large buy orders below are building short-term support.
Chip Distribution Analysis
- Key Chip Position: 94318 USDT Support: The blue chip concentration area shows a large accumulation of bullish chips, serving as the main support level.
- 96500-97500 Pressure: The orange chip distribution is relatively high, indicating significant divergence between bulls and bears in this range, which may form a resistance band.
- Chip Distribution Conclusion: Current chips are concentrated below the 95000 USDT area, indicating that funds are positioning long orders here, providing upward support for the price.
Today's Trend Prediction
Short-term Prediction: High-level Oscillation, Waiting for Direction Breakthrough
Bitcoin is currently in a stage of oscillation consolidation, with prices repeatedly testing the neckline resistance near 97371-97617, but has not yet strongly broken through. If it breaks through this resistance with volume, the short-term target may look towards the 98500-99000 USDT area; however, if there is no volume support, it may retrace to the 96000-94800 range for consolidation.
Mid-term Trend: Confirmation or Failure of the Double Bottom Pattern
If the price steadily breaks through the neckline of 97617 with increased trading volume, the double bottom pattern will be confirmed, targeting the 100,000 area.
Conversely, if it is blocked at the neckline and breaks below the secondary support level of 94838, caution should be exercised regarding weakening market sentiment, which may lead to a retest of the strong support at 89256.
Volatility and Risk
The continuous opening of the Bollinger Band indicates increased market volatility, but the long upper shadow near the upper band suggests some short-term retracement pressure. The RSI is close to the overbought area, which may face technical retracement in the short term.
Investment Suggestions
Short-term Operations
- Focus on Breakout Opportunities: If the price breaks through 97617 (neckline resistance) with volume, consider taking a light long position, targeting around 98500-99000.
- Prevent False Breakouts: If the price quickly rises but fails to stabilize above 97617, timely profit-taking or position reduction is necessary to avoid losses from a false breakout.
- Buy on Retracement Opportunity: If the price retraces to 94838 (secondary support) and stabilizes, consider buying low, with a stop-loss set below 94500.
Medium to Long-term Operations
- Double Bottom Pattern Confirmation Layout: After the neckline breakout, bulls can continue to hold positions, targeting 100,000 as a medium to long-term goal.
- Maintain Psychological Defense Line: If the price breaks below 89256, timely stop-loss is necessary to guard against further downside risk.
Trading Risk Warning
- False Breakout Risk: The price may briefly spike but fail to effectively break through the neckline, requiring caution in chasing long positions.
- Market Sentiment Volatility: There is currently significant divergence between bulls and bears in the market, necessitating close attention to trading volume and large transaction dynamics.
- Macro Risk: Attention should be paid to the impact of the US dollar index, macroeconomic policies, and other factors on Bitcoin market sentiment.
In summary, Bitcoin's trend today still requires attention to the neckline breakout situation in the 97371-97617 area, overall leaning bullish but accompanied by short-term retracement risks. Investors should flexibly adjust strategies and strictly implement profit-taking and stop-loss measures.
The above content is for reference only and does not constitute investment advice.
If you have any questions, you can contact us through the following official channels:
AICoin Official Website: www.aicoin.com
Telegram: t.me/aicoincn
Twitter: x.com/AICoincom
Email: support@aicoin.com
Group Chat: Customer Service Yingying、Customer Service KK
免责声明:本文章仅代表作者个人观点,不代表本平台的立场和观点。本文章仅供信息分享,不构成对任何人的任何投资建议。用户与作者之间的任何争议,与本平台无关。如网页中刊载的文章或图片涉及侵权,请提供相关的权利证明和身份证明发送邮件到support@aicoin.com,本平台相关工作人员将会进行核查。


