Long-Term Perspective
Trend Judgment
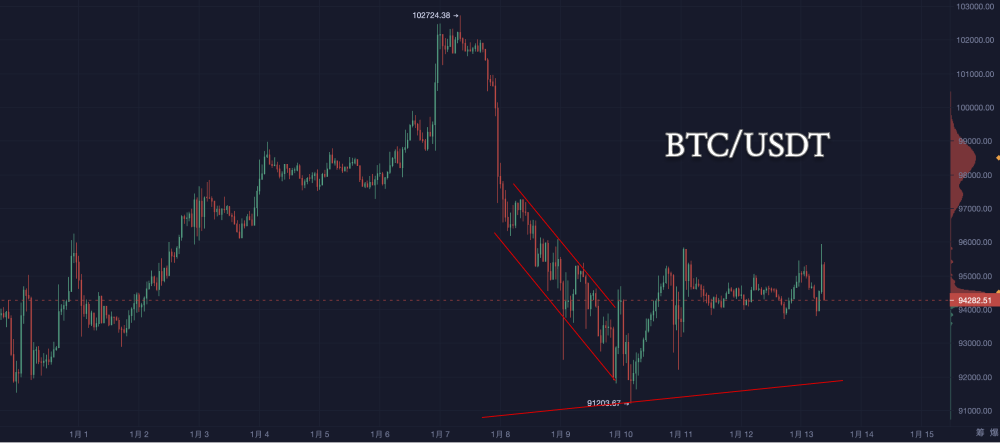
Based on the BTC candlestick data from AICoin, the price has experienced a clear upward trend, reaching a peak (approximately 102,724.38) before a sharp decline. Subsequently, the price has formed a consolidation in a lower range.
From a long-term perspective, the overall trend is currently bearish, especially after the sharp drop from the peak, indicating a lack of significant rebound strength in the market, suggesting that bullish momentum has been exhausted at high levels, with bears dominating.
Key Pattern Recognition
- Top Pattern: The top area shows a significant "long upper shadow" candlestick, indicating notable selling pressure at high levels.
- Downward Trend Structure: The price has dropped from the peak of 102,724.38 to 91,203.67, forming a complete "descending channel." Although there was a rebound afterward, the rebound was unable to effectively break through the pressure line of the descending channel.
- Bottom Pattern: 91,203.67 may constitute a phase support, but the current price has not shown signs of breaking through key resistance levels.
Long-Term Trend Forecast
If the price fails to effectively break through the upper boundary of the descending trend channel or form a clear bottom pattern (such as a double bottom or head and shoulders bottom), the long-term trend may continue to oscillate bearishly. Bullish signals should focus on whether the price can stabilize above 96,000 and form sustained volume.
Short-Term Perspective
Short-Term Trend Judgment
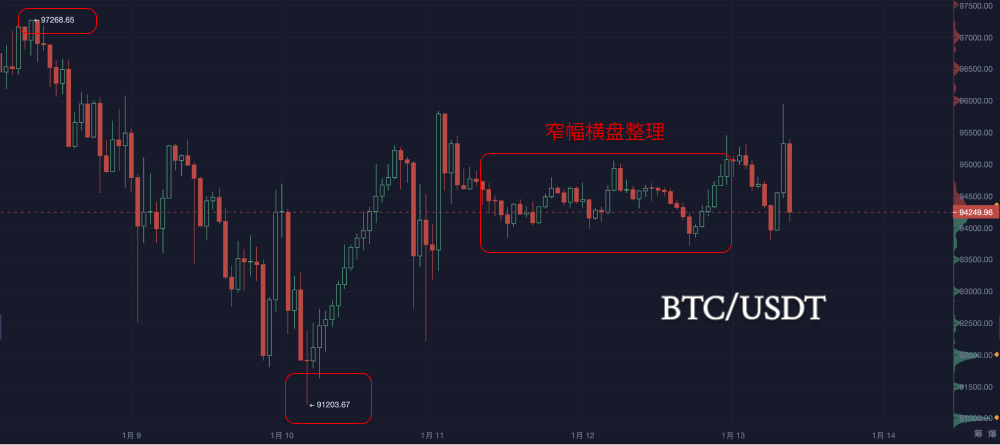
Based on the recent BTC candlestick trends, it can be seen that the price has dropped from a high (approximately 97,268.65) to a low (approximately 91,203.67) and is now showing a low-level oscillation recovery trend. The overall performance is characterized by "narrow range consolidation," with a fluctuation range between 94,500 and 95,500, indicating that the market is temporarily in a state of balance between bulls and bears.
Short-Term Candlestick Pattern Analysis
The recent candlestick patterns show relatively short bodies with long upper and lower shadows, indicating significant divergence in the market around the current price level, with major funds yet to determine a clear direction. The closing price yesterday formed a small bullish candlestick (closing at 95,084.96), suggesting a potential attempt to test upward in the short term.
Key Support and Resistance
- Support Level: 93,711
- Resistance Level: 95,358 (short-term resistance) and 96,000 (medium-term important resistance)

Short-Term Trend Forecast
If today the price can break through the 95,500 resistance level with increased volume, it may rise to the 96,000 area in the short term. However, if it fails to break through, the price is likely to continue consolidating sideways or even test the 94,500 support level downward.
Technical Indicator Analysis
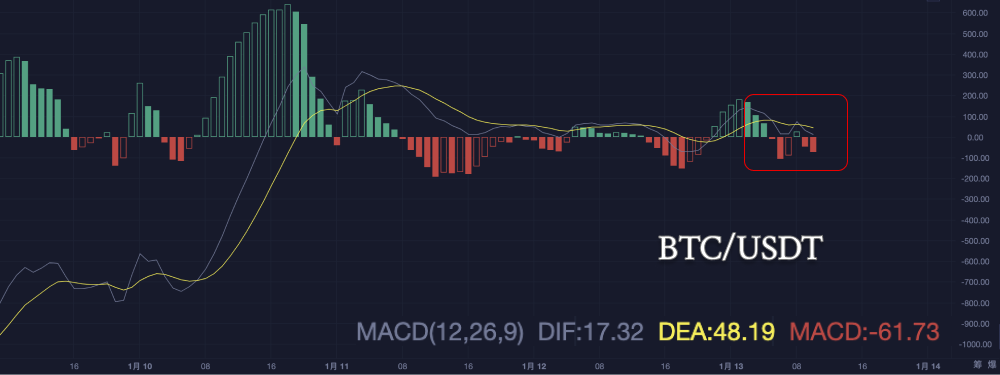
MACD: The hourly MACD is below the zero axis, with signs of convergence between the fast and slow lines, indicating a potential directional choice in the short term.
RSI: The RSI hovers around 50, not entering overbought or oversold territory, indicating neutral market sentiment.

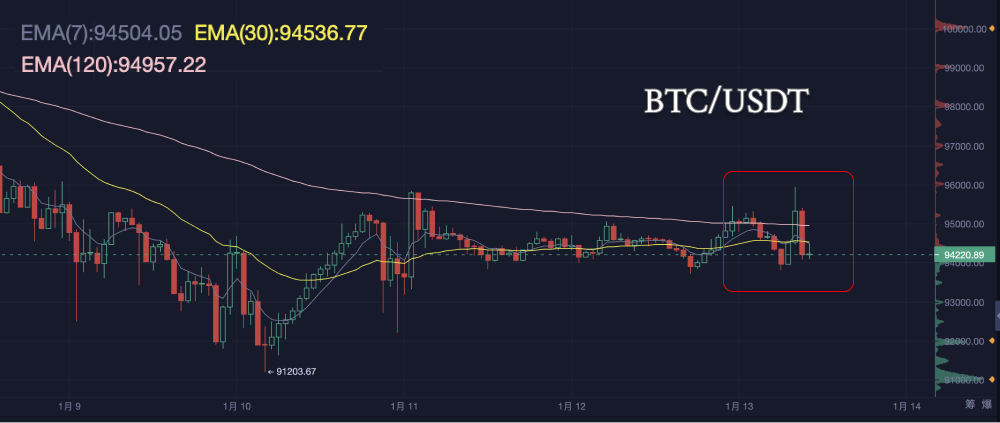
EMA: The current price is between EMA7 and EMA30, below EMA120, indicating a weak short-term trend, with the medium to long-term still needing observation for breakout conditions.
Bollinger Band Analysis:
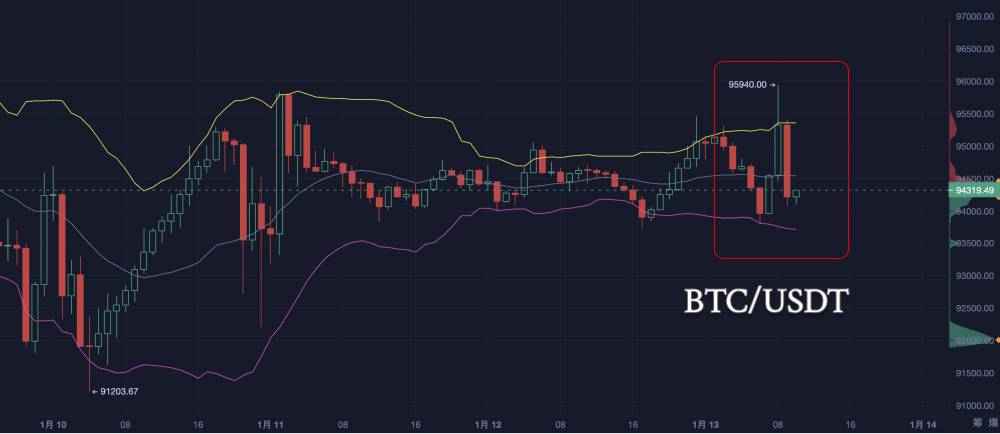
- Contraction and Expansion: The upper and lower bands of the Bollinger Bands show significant changes in the chart. Recent volatility has increased, with the upper and lower bands gradually opening, indicating heightened market volatility. Particularly in the red box area, the Bollinger Bands show a clear expansion trend, suggesting the market has experienced a significant price fluctuation.
- Price Position: Within the red box, the BTC price briefly touched the upper band (95,940 USDT), indicating strong bullish momentum in the short term. However, the price quickly retreated to near the middle band, showing that the upward movement could not be sustained, with intense bullish and bearish competition.
- Trend Judgment: The current price is close to the middle band, which may indicate a lack of directional movement in the short term, requiring observation of whether the price breaks through the upper or lower bands to determine the trend. If the price approaches the lower band again, it may signal an increased risk of short-term pullback; if it breaks through the upper band, it may initiate a new upward trend.
Large Transactions & Chip Distribution Analysis
Large Transactions (Bubble Chart)
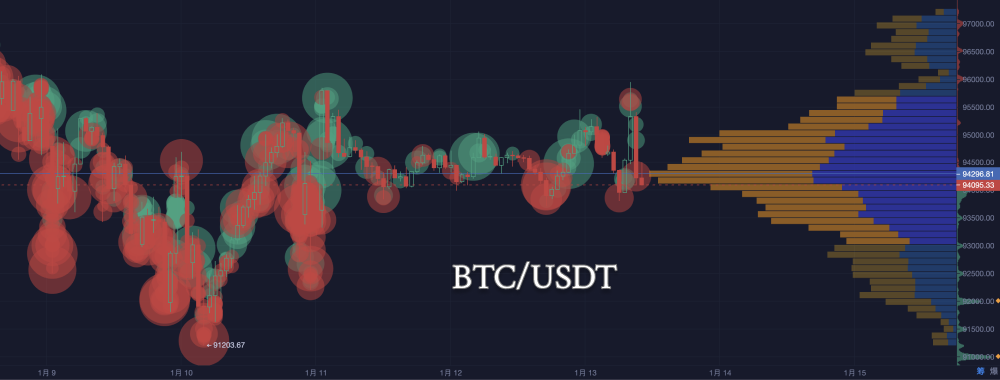
Recent Characteristics: In the chart, around January 10, the number of large red bubbles increased, indicating some selling pressure in the market. From January 12 to 13, the number of green bubbles gradually increased, suggesting that buying power has strengthened.
Buy-Sell Competition: The alternating appearance of red and green bubbles indicates a balance of bullish and bearish forces, with no clear one-sided trend formed.
Chip Distribution (Right Bar Chart)
Core Area: The height of the bar chart indicates the density of transactions within a certain price range.
Current Transaction Density Area: Major chips are concentrated in the 93,500 to 94,500 USDT range, which is the recent cost area.
The blue area represents the current high-density chip area, while the orange area shows a lower density, indicating that trading interest in that range is relatively low.
Today's Trend Forecast
Based on the current candlestick patterns and market trends, here are the expectations for today:
Possible Trend Directions:
Breakout Upward: If the market can effectively break through the 95,500-96,000 resistance level with increased volume, bullish forces may dominate, pushing the price towards 98,000 or even 100,000.
Continuation of Sideways Movement: If the market oscillates around 95,000, it may maintain narrow fluctuations today, waiting for more directional choices.
Pullback Downward: If trading volume shrinks and bullish momentum weakens, the market may retest the 91,200 support level.
Pattern Signals:
- Bullish Signal: If today’s close can break above yesterday's high with a longer lower shadow, it can be seen as a stronger rebound momentum in the market.
- Bearish Signal: If the price pulls back below 93,000, bears may regain an advantage.
Investment Recommendations Based on Analysis
1. Short-Term Operation Suggestions (Speculative Investors)
Current Strategy: Light Position for Short-Term Rebound
- Entry Conditions: If the price breaks through the 95,500 resistance level with increased volume, a light position can be entered above 95,500. The short-term target is 96,000 (medium-term resistance), with an aggressive target of 96,500.
- Stop-Loss Level: Set below 94,500 to prevent significant losses from a rapid price drop.
Risk Control:
- The short-term trend is not yet fully clear, and the market is in a consolidation phase, so positions should not be too heavy; it is recommended to keep position control within 20%-30%.
- If the price fails to break through 95,500, avoid blindly entering the market and patiently wait for a clearer trend.
2. Medium to Long-Term Investment Suggestions (Conservative Investors)
Current Strategy: Wait and See, Awaiting Bottom Stabilization
- Heavy Position Entry Not Recommended: The long-term trend is bearish, and the current market lacks clear bottom confirmation signals; blind entry may incur greater downside risk.
- Focus on Signals: If the price can break through 96,000 and steadily rise, indicating improved market sentiment, gradual entry can be considered, focusing on the next resistance level of 98,000.
If the price falls below 94,000, it indicates that bearish forces are further strengthening, and patience is needed to wait for lower price layout opportunities in the medium to long term.
3. Swing Trading Suggestions (Flexible Investors)
Current Strategy: Buy on Dips, Rolling Operations
- Layout Points: If the price dips to the 94,500-94,000 area, small positions can be attempted in batches, targeting 95,500-96,000. Each time the support level is tested, positions can be appropriately increased, ensuring the overall position does not exceed 50%.
- Sell Points: Gradually take profits in the 95,500-96,000 area to avoid risks from market fluctuations.
- Stop-Loss Points: Strictly set stop-loss at 93,800 to avoid deep drop risks.
4. Other Strategy Suggestions
Pay Attention to External Risk Factors
The current market oscillation may be influenced by external macroeconomic data or policies, and the following factors should be monitored:
- Changes in Monetary Policy: Such as interest rate adjustments or tightening market liquidity. Global market interlinkage: Fluctuations in external markets may affect sentiment.
- Industry Policy Support: If the asset belongs to a specific industry, policy changes may trigger new trends.
Maintain Patience and Strict Discipline
- The current market lacks a trending situation; investors should remain calm and not blindly chase highs or sell lows.
- Investment strategies should strictly execute profit-taking and stop-loss measures to avoid emotional fluctuations affecting judgment.
The above content is for reference only and does not constitute investment advice.
If you have any questions, you can contact us through the following official channels:
AICoin Official Website: www.aicoin.com
Telegram: t.me/aicoincn
Twitter: x.com/AICoincom
Email: support@aicoin.com
Group Chat: Customer Service Yingying、Customer Service KK
免责声明:本文章仅代表作者个人观点,不代表本平台的立场和观点。本文章仅供信息分享,不构成对任何人的任何投资建议。用户与作者之间的任何争议,与本平台无关。如网页中刊载的文章或图片涉及侵权,请提供相关的权利证明和身份证明发送邮件到support@aicoin.com,本平台相关工作人员将会进行核查。


