The U.S. Bureau of Labor Statistics released the latest data on the evening of the 10th, showing that non-farm employment in the U.S. increased by 256,000 in December, far exceeding market expectations of 164,000 and the previous value of 212,000, marking the largest increase in nine months. Additionally, the unemployment rate in December fell to 4.1%, below the expected and previous value of 4.2%. This unexpectedly strong employment report reinforced expectations for the Fed to slow down the pace of interest rate cuts, leading to a rise in the U.S. dollar index, which closed at 109.64. Both the U.S. stock market and the bond market experienced heavy selling pressure, with the yield on the 10-year U.S. Treasury rising to 4.77%, causing all four major U.S. indices to decline.
In the cryptocurrency sector, influenced by the drop in U.S. stocks, Bitcoin fell by 2.23% within 15 minutes of the data release, dipping to around $92,206 late Friday evening. However, Bitcoin then surged strongly to $95,836, and as of the time of writing, the price was $95,197, reflecting an increase of about 0.63% in the past 24 hours.
Bitcoin Four-Hour Chart
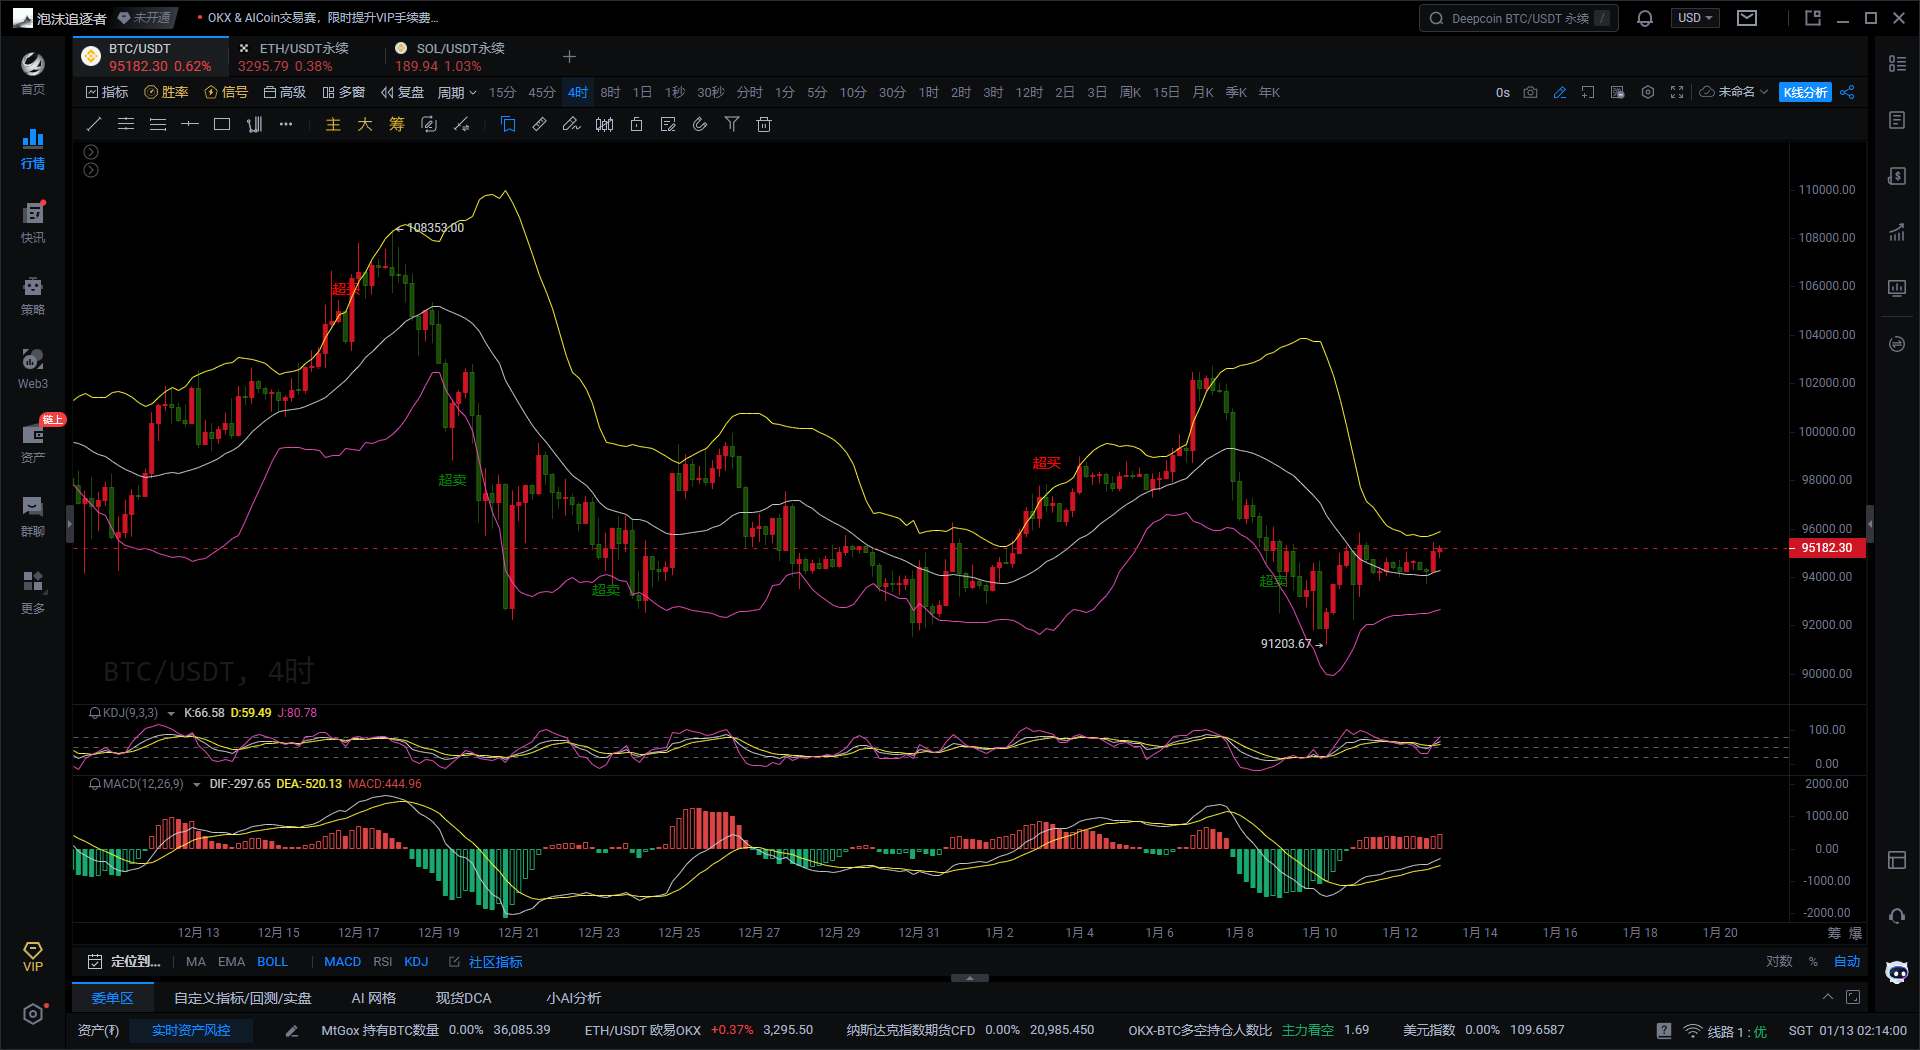
First, according to the Bollinger Bands indicator on the 4H Bitcoin chart, the middle band is showing a horizontal trend, indicating that the current market is in a consolidation phase. The upper and lower bands are slightly narrowing, suggesting that market volatility is decreasing in the short term, and prices may oscillate within the range of the upper and lower bands. However, the price has slightly broken through the middle band, indicating a potential upward test of the upper band in the short term.
Second, based on the KDJ indicator on the 4H Bitcoin chart, the K-line and D-line values have formed a golden cross signal in the oversold area, and the J-line has broken above the 80 line, entering the overbought area, indicating that there may be some pullback pressure in the short term. However, the overall trend still leans towards bullish.
Finally, according to the MACD indicator on the 4H Bitcoin chart, the DIF line and DEA line are forming a golden cross signal at a low level, and the MACD green histogram has turned from green to red, indicating that the market has some upward momentum.
Comprehensive Analysis: The price of Bitcoin is currently in a trend of oscillating upwards, with both the MACD and Bollinger Bands indicators showing that upward momentum is strengthening, but the KDJ indicator warns of a possible slight pullback.
In summary, the following suggestions are provided for reference:
Consider going long on Bitcoin when it pulls back to around 94,500-94,600, targeting 95,800-96,600. If it breaks through, you can continue to hold, with a stop loss at 94,100.
Instead of giving you a 100% accurate suggestion, I prefer to provide you with the right mindset and trend. After all, teaching someone to fish is better than giving them a fish; a suggestion may earn you a moment, but learning the mindset can earn you a lifetime! The focus is on the mindset, grasping the trend, and planning positions in the market. What I can do is use my practical experience to help everyone, guiding your investment decisions and management in the right direction.
Writing time: (2025-01-13, 02:15)

(Written by - Daxian Talks Coins) Disclaimer: There may be delays in online publication; the above suggestions are for reference only. The author is dedicated to research and analysis in investment fields such as Bitcoin, Ethereum, altcoins, foreign exchange, and stocks, having been involved in the financial market for many years with rich practical experience. Investment carries risks; please proceed with caution. For more real-time market analysis, please follow the official account Daxian Talks Coins for discussion and exchange.
免责声明:本文章仅代表作者个人观点,不代表本平台的立场和观点。本文章仅供信息分享,不构成对任何人的任何投资建议。用户与作者之间的任何争议,与本平台无关。如网页中刊载的文章或图片涉及侵权,请提供相关的权利证明和身份证明发送邮件到support@aicoin.com,本平台相关工作人员将会进行核查。


