
Yesterday, USDC Treasury burned 50 million USDC on the Ethereum chain, and in the early morning, USDC Treasury issued an additional 250 million USDC on the Solana chain.
Fidelity deposited 11,250 ETH (36.9 million USD) into Coinbase through Cumberland. In the past 24 hours, Fidelity has deposited a total of 31,249 ETH (103.55 million USD) into Coinbase through Cumberland.
Russia has "started selling" 1,032 bitcoins seized in the Infraud hacker organization case. On December 30, the U.S. Department of Justice was authorized to sell bitcoins worth 6.5 billion USD from the seized Silk Road assets. The market only saw the news when it dropped to around 94,000, and during the false breakout above 100,000, it rapidly fell by 11,500 points without any effective rebound. I personally feel that there may be insider information, and large holders may have exited early, which could be a form of market manipulation.
In the past 7 days, 797,781 people have been liquidated, mostly long positions, with nearly 10 billion RMB liquidated since the 7th. We are currently still in the downward B wave; if it breaks below 90,000, it will start the C wave, and a false breakdown is also possible. From December 10 to mid-month, I have been warning that if the channel breaks, it may go down to 82,000—85,000—88,000, which are also medium to long-term buying opportunities. Currently, it is still around 91,000, and those who are aggressive can still enter a position, continuing to add to their holdings as it declines (for spot trading).
Bitcoin
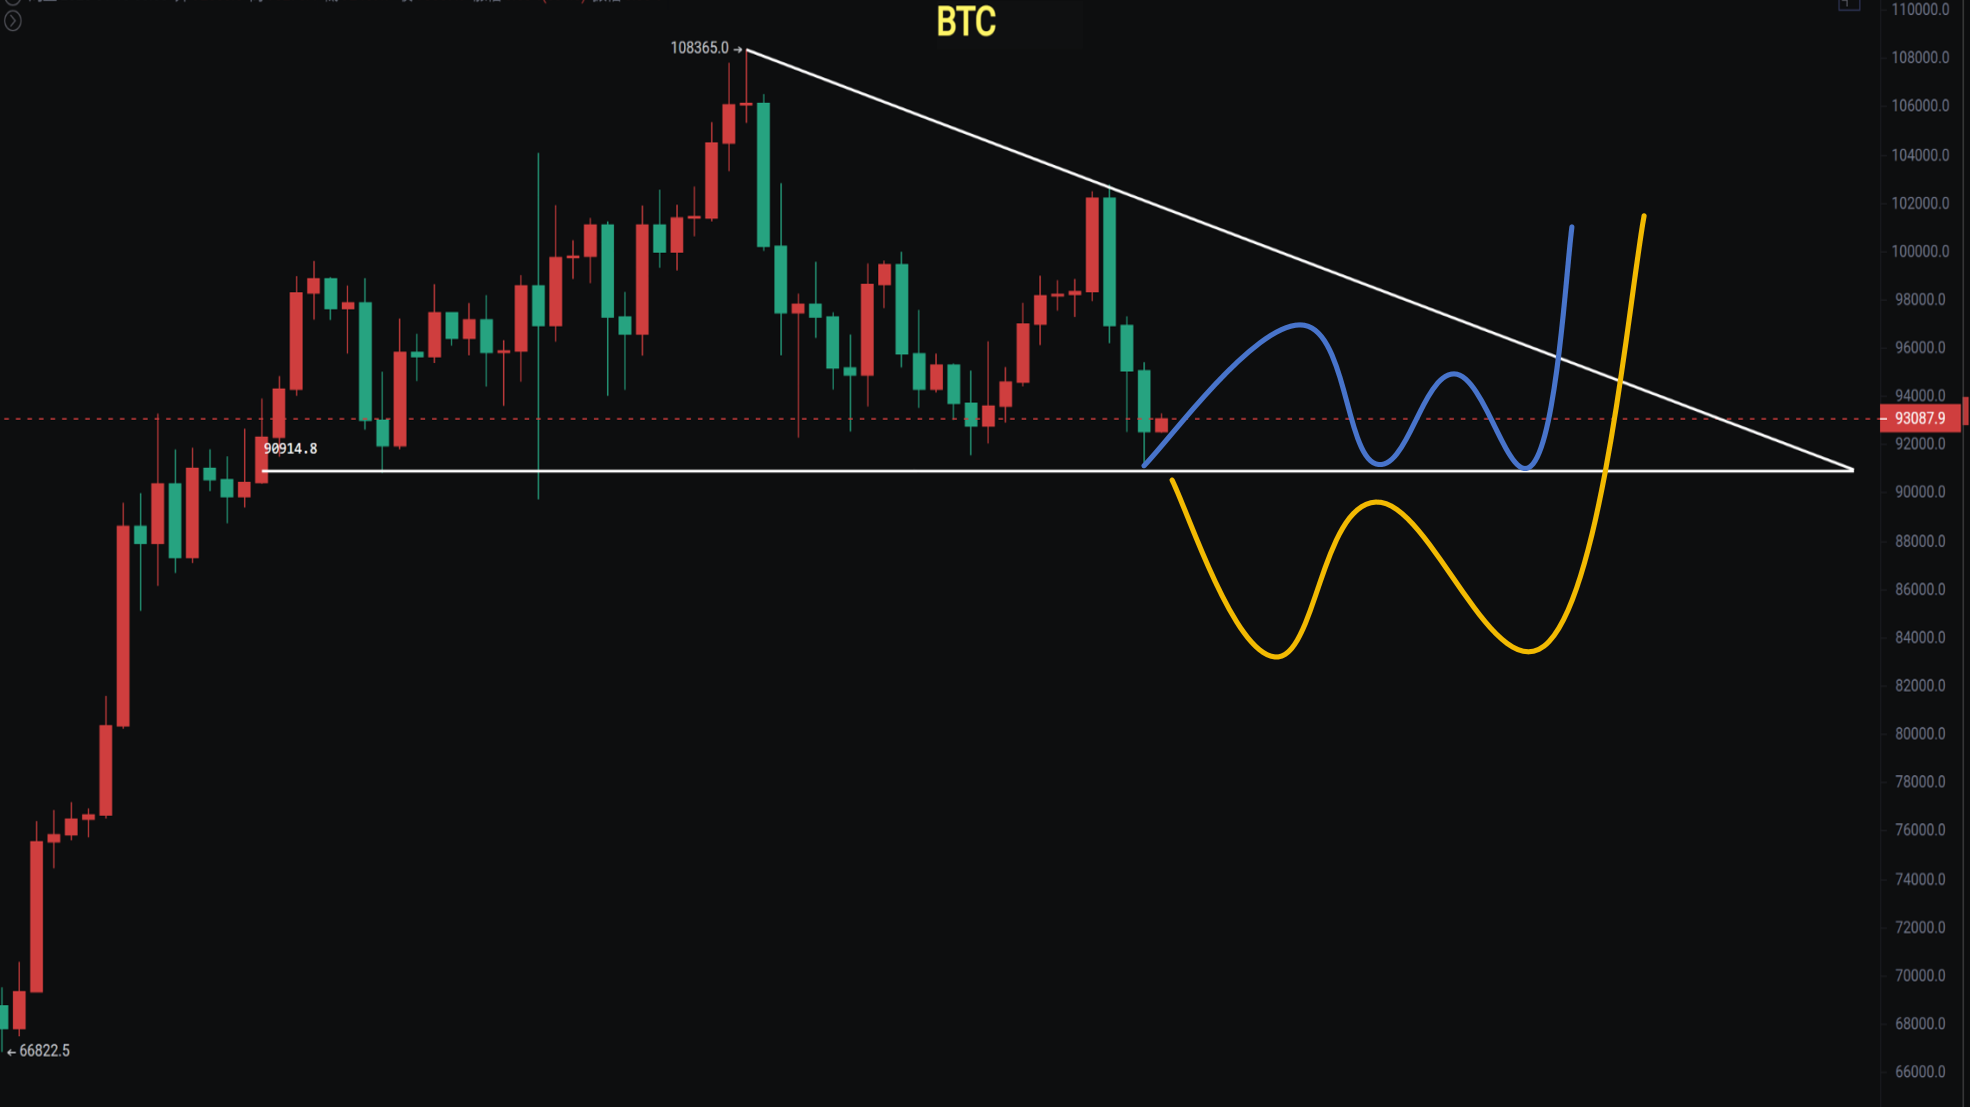
In the early morning, it broke below 91,500, dipped to 91,200, and is slowly rebounding. As of the time of writing, it is still around 93,400. For now, we can only say that there is a short-term demand for a rebound. At the latest, I also remind that BTC may again show a descending wedge in the short term, but retail investors' panic sentiment is still spreading, and there is a demand for a rebound in the short-term technical analysis.
The daily chart has fallen for 3 consecutive days with a divergence in volume and price (trading volume in the crypto market may not be real and can only be referenced), dropping to the lower Bollinger Band with a rebound expected around 96,000. The daily chart shows a converging triangle with bottom support, and it may also form a descending channel, depending on whether it can hold around 90,000.
On the 4-hour chart, there is a potential descending wedge; we will see the strength of the rebound. The upper pressure levels are 94,700—96,000—98,600.
Support: Pressure:
Ethereum
Still holding yesterday's view, the weekly closing is still engulfing, so we cannot rule out a repeat of the previous trend before breaking below 2,800. 2,800 is a strong support level, and it must not break down in an entity.
On the daily chart, it dipped to a low of 3,158 and has returned to where we previously discussed. Before, when Bitcoin broke below 100,000, I reminded to reduce positions, and when it broke 97,000, I also advised to exit. If Ethereum continues to decline, positions can be added above 2,800.
Support: Pressure:

If you like my views, please like, comment, and share. Let's navigate through the bull and bear markets together!!!
The article is time-sensitive and for reference only, updated in real-time.
Focusing on K-line technical research, sharing global investment opportunities. Public account: Trading Prince Fusu

免责声明:本文章仅代表作者个人观点,不代表本平台的立场和观点。本文章仅供信息分享,不构成对任何人的任何投资建议。用户与作者之间的任何争议,与本平台无关。如网页中刊载的文章或图片涉及侵权,请提供相关的权利证明和身份证明发送邮件到support@aicoin.com,本平台相关工作人员将会进行核查。


