
Trump is considering declaring a national economic emergency, which would provide a legal basis for imposing large universal tariffs on allies and adversaries. People may fall into a Great Depression like that of 1929, which would be devastating, and the cryptocurrency and stock markets have plummeted as a result of this news.
The U.S. Bitcoin spot ETF saw a net outflow of $569 million yesterday, while the U.S. Ethereum spot ETF experienced a net outflow of $159 million. This morning, the U.S. Department of Justice was authorized to sell $6.5 billion worth of Bitcoin from seized Silk Road assets.
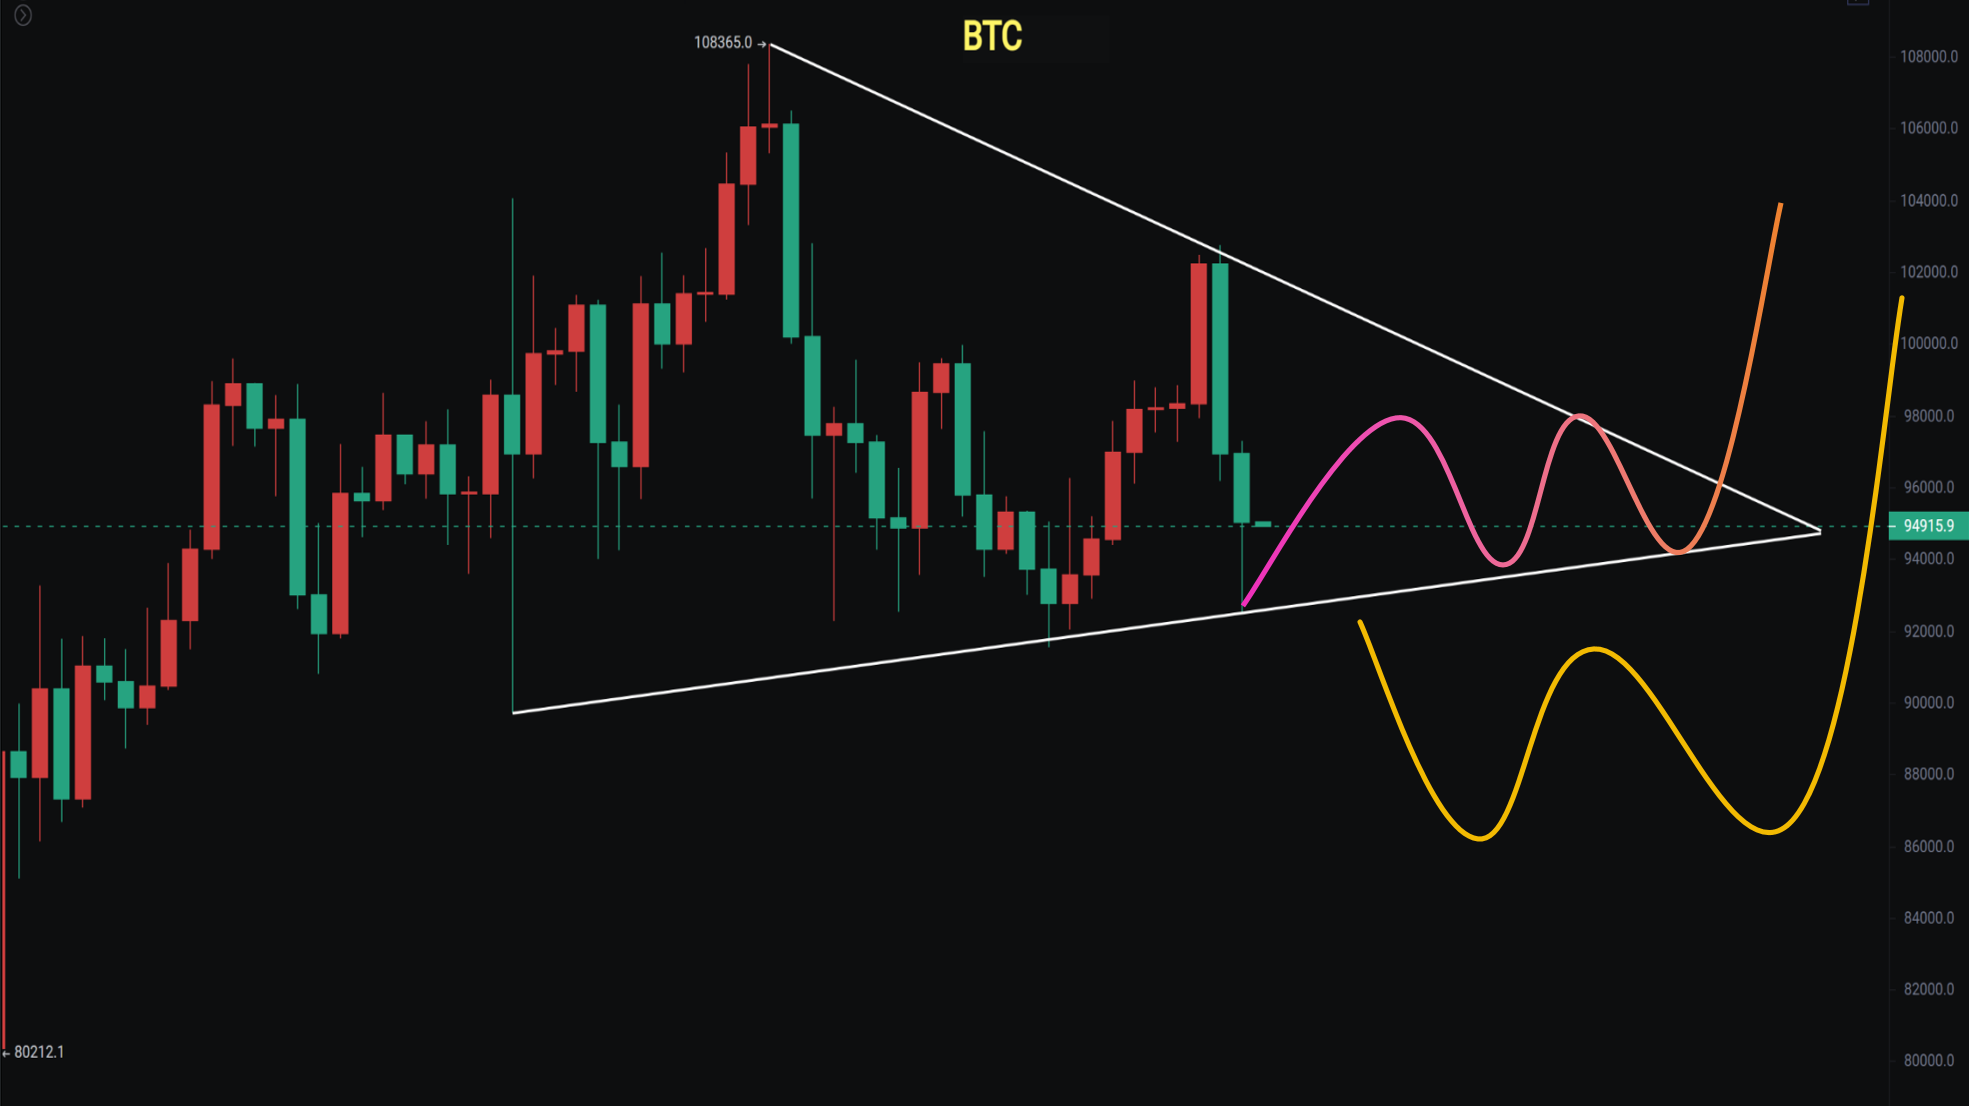
In the past 48 hours, 380,000 people have been liquidated, with liquidation amounts exceeding $1 billion. As of the time of writing, the market hit a low of 92,500, rebounding to around 94,700. There is short-term support, but the rebound strength is relatively weak.
Bitcoin
From the peak, it rapidly dropped 10,000 points, with the lowest pin at 92,500, which is 1,000 points away from the previous low of 91,500. It is still in a downward B wave. On the 4-hour chart, the rebound pressure is between 97,600 and 98,600. If the rebound cannot reclaim these key pressure levels, it cannot be ruled out that it will test the support level around 91,500 again, with a risk of breaking below.
On the daily chart, we have been discussing the ascending channel. The price has touched 100,000 and 102,000 three times on the rebound but has not effectively stayed above the channel. Since this pullback, it has been testing the Fibonacci 0.382 level, which needs to be monitored. If it does not break, it will continue to oscillate and test; if it breaks, it will test 0.5 or even 0.618 (87,594—82,694).
Support: Pressure:
Ethereum
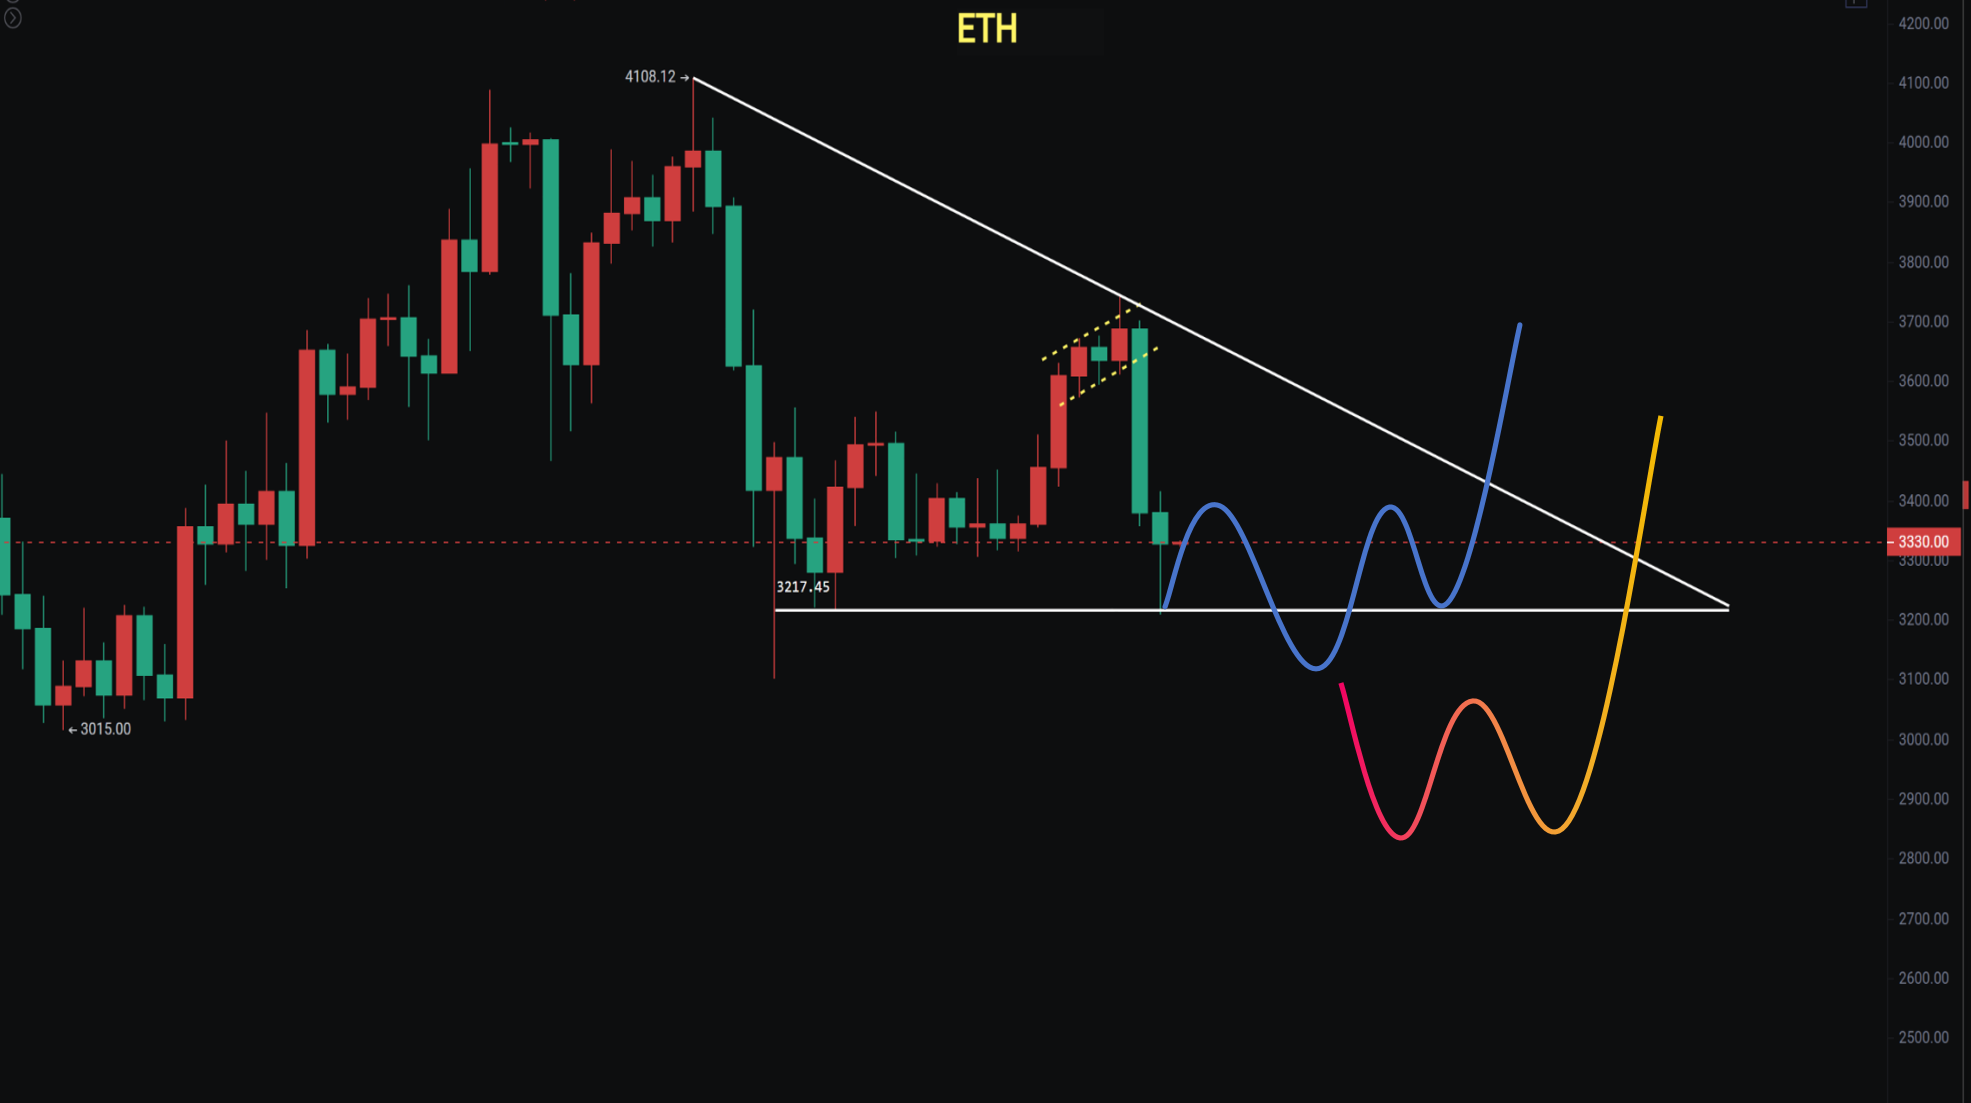
In two days, it has dropped 536 points, a decrease of 14.33%, with the lowest pin at 3,208 and currently around 3,330 as of the time of writing. If the weekly candle closes with an engulfing pattern, next week could be quite troublesome. It has been mentioned before that from a weekly perspective, it cannot be ruled out that it will replicate the previous drop below 2,800.
On the daily chart, it has fallen back into the 3,200—3,555 range, looking at the future oscillation direction. If Bitcoin breaks below 91,500, Ethereum will likely follow suit.
Support: Pressure:
SOL
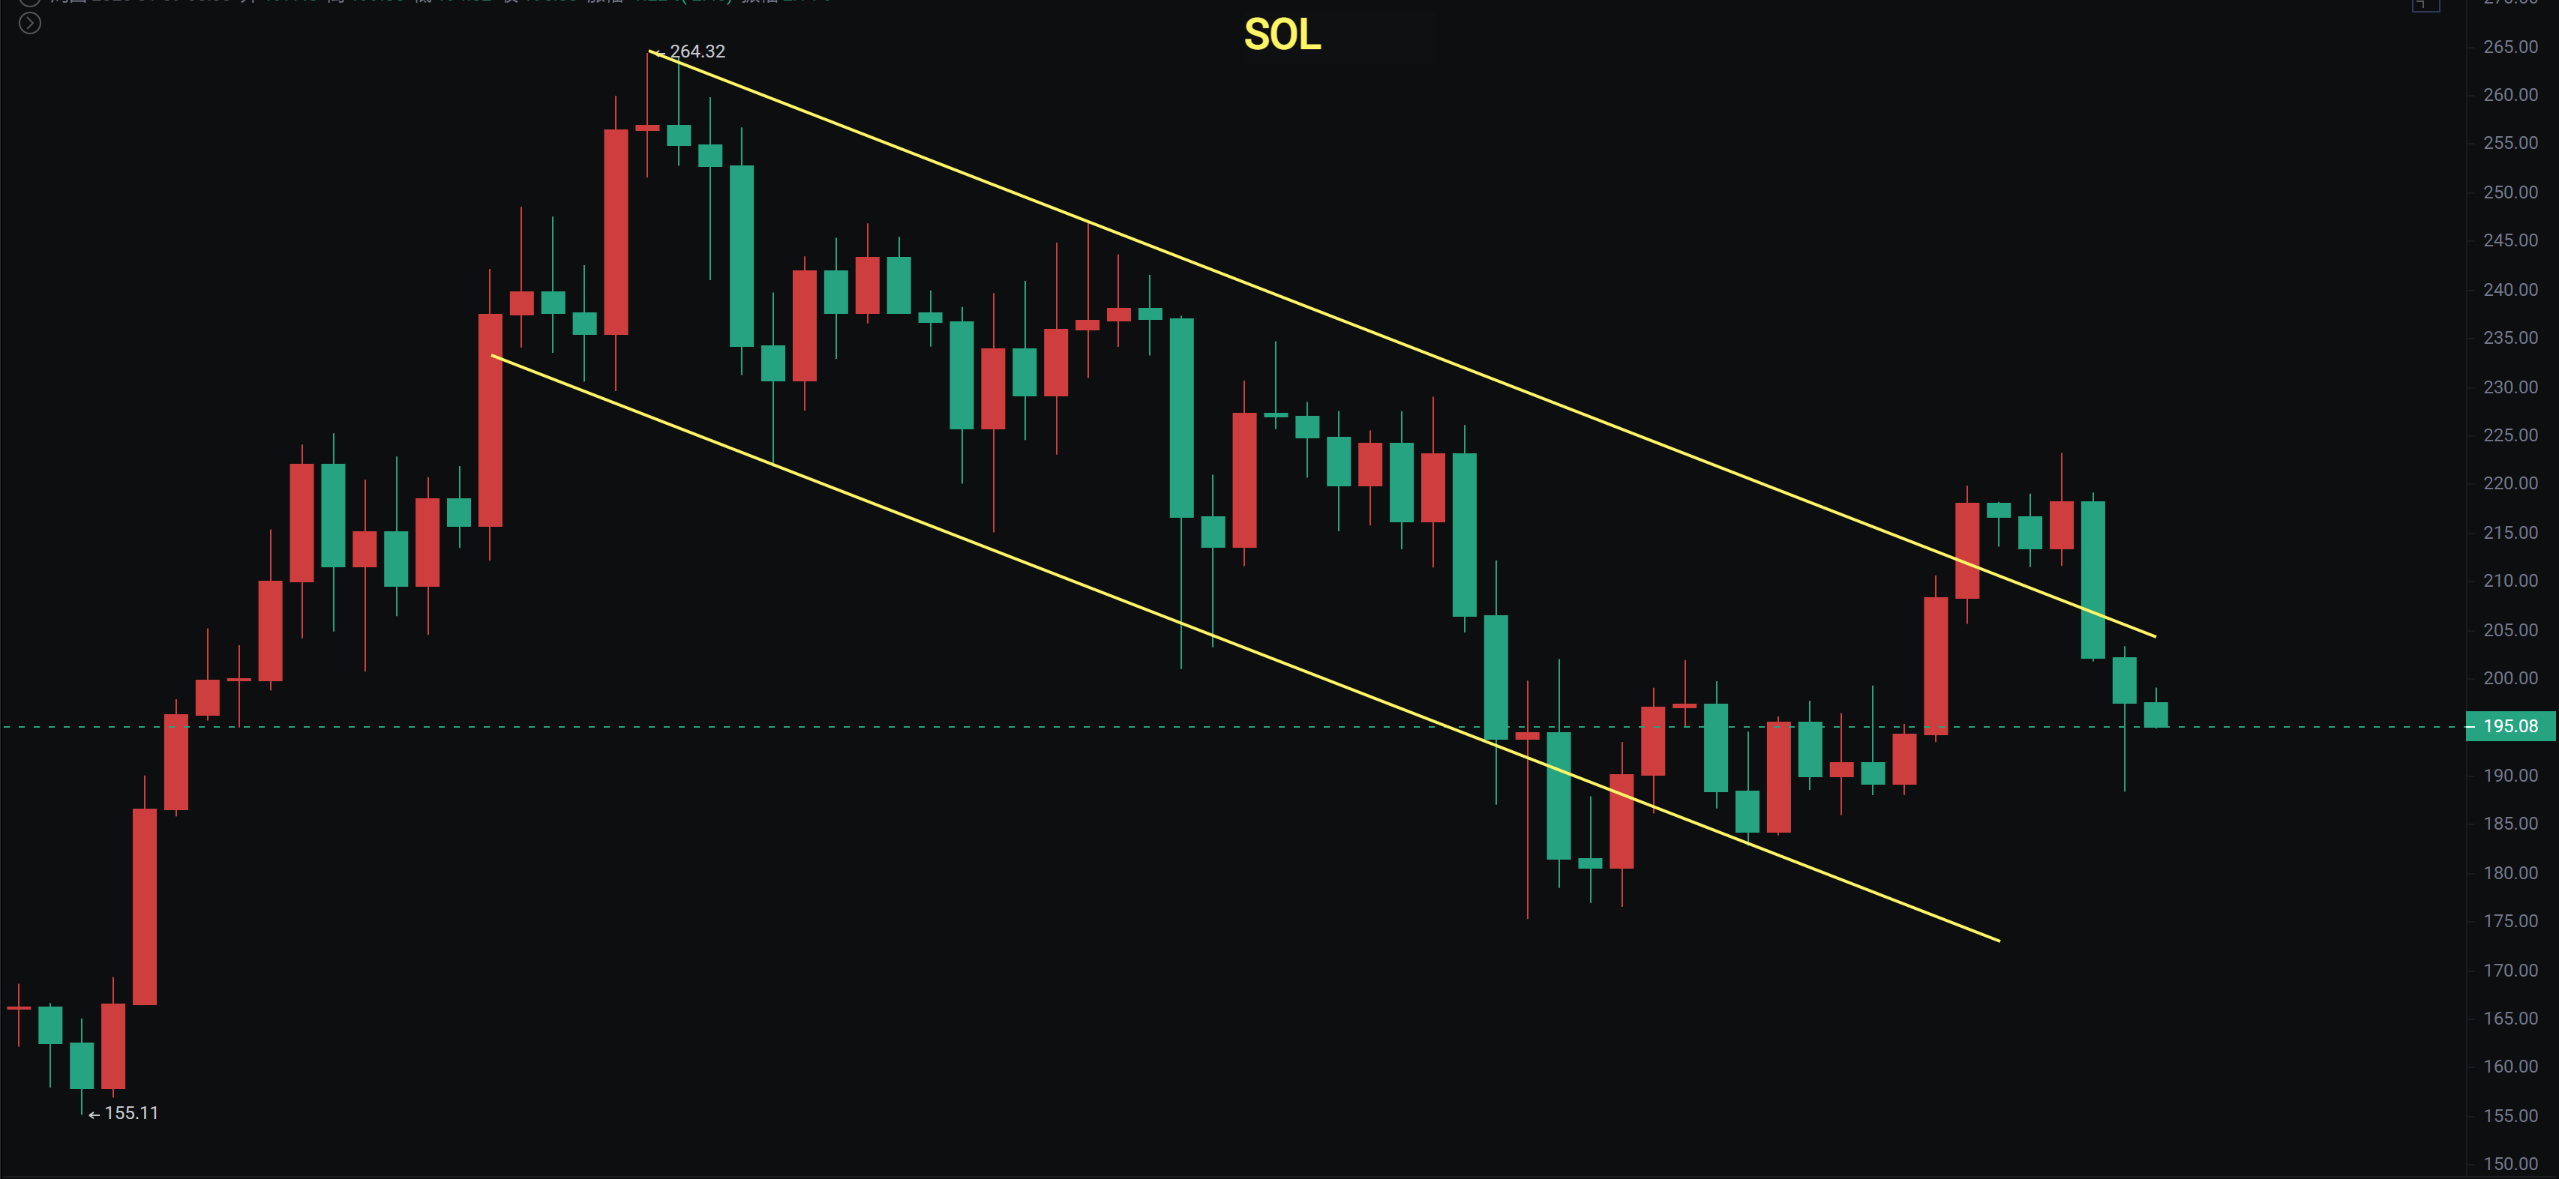
After breaking the ascending channel, it has continued to drop back, and it will need to test the support at 175—180.
DOGE
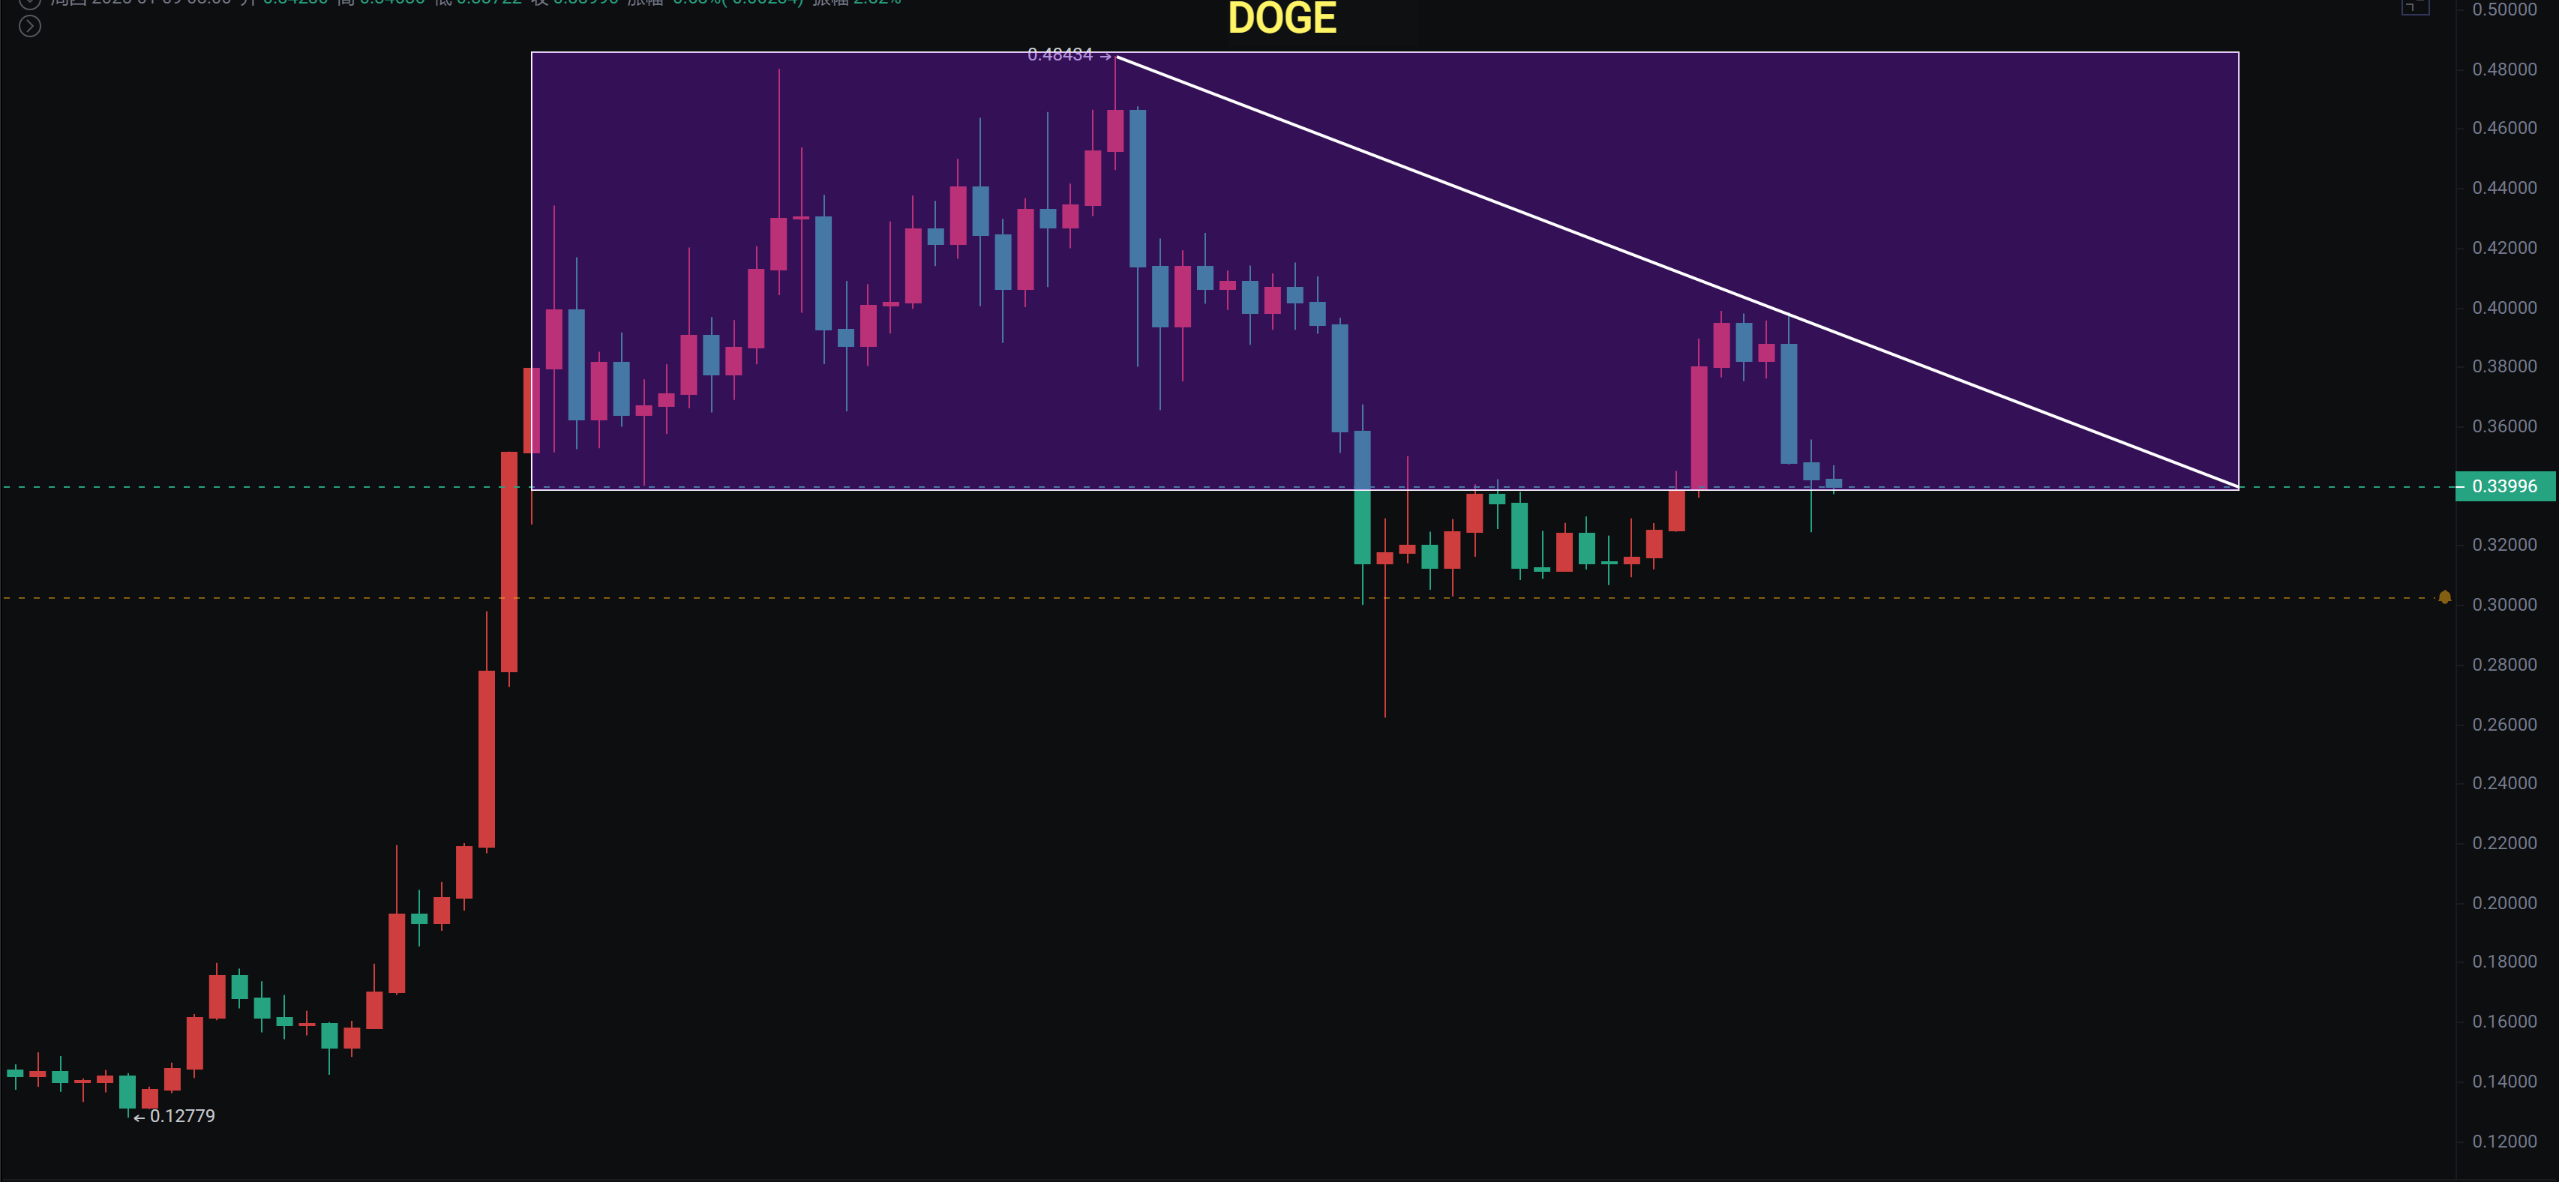
After breaking through the Fibonacci 0.382 level, it has dropped and is continuing to test the 0.382 level. We will continue to wait for an opportunity to build positions on the right side.
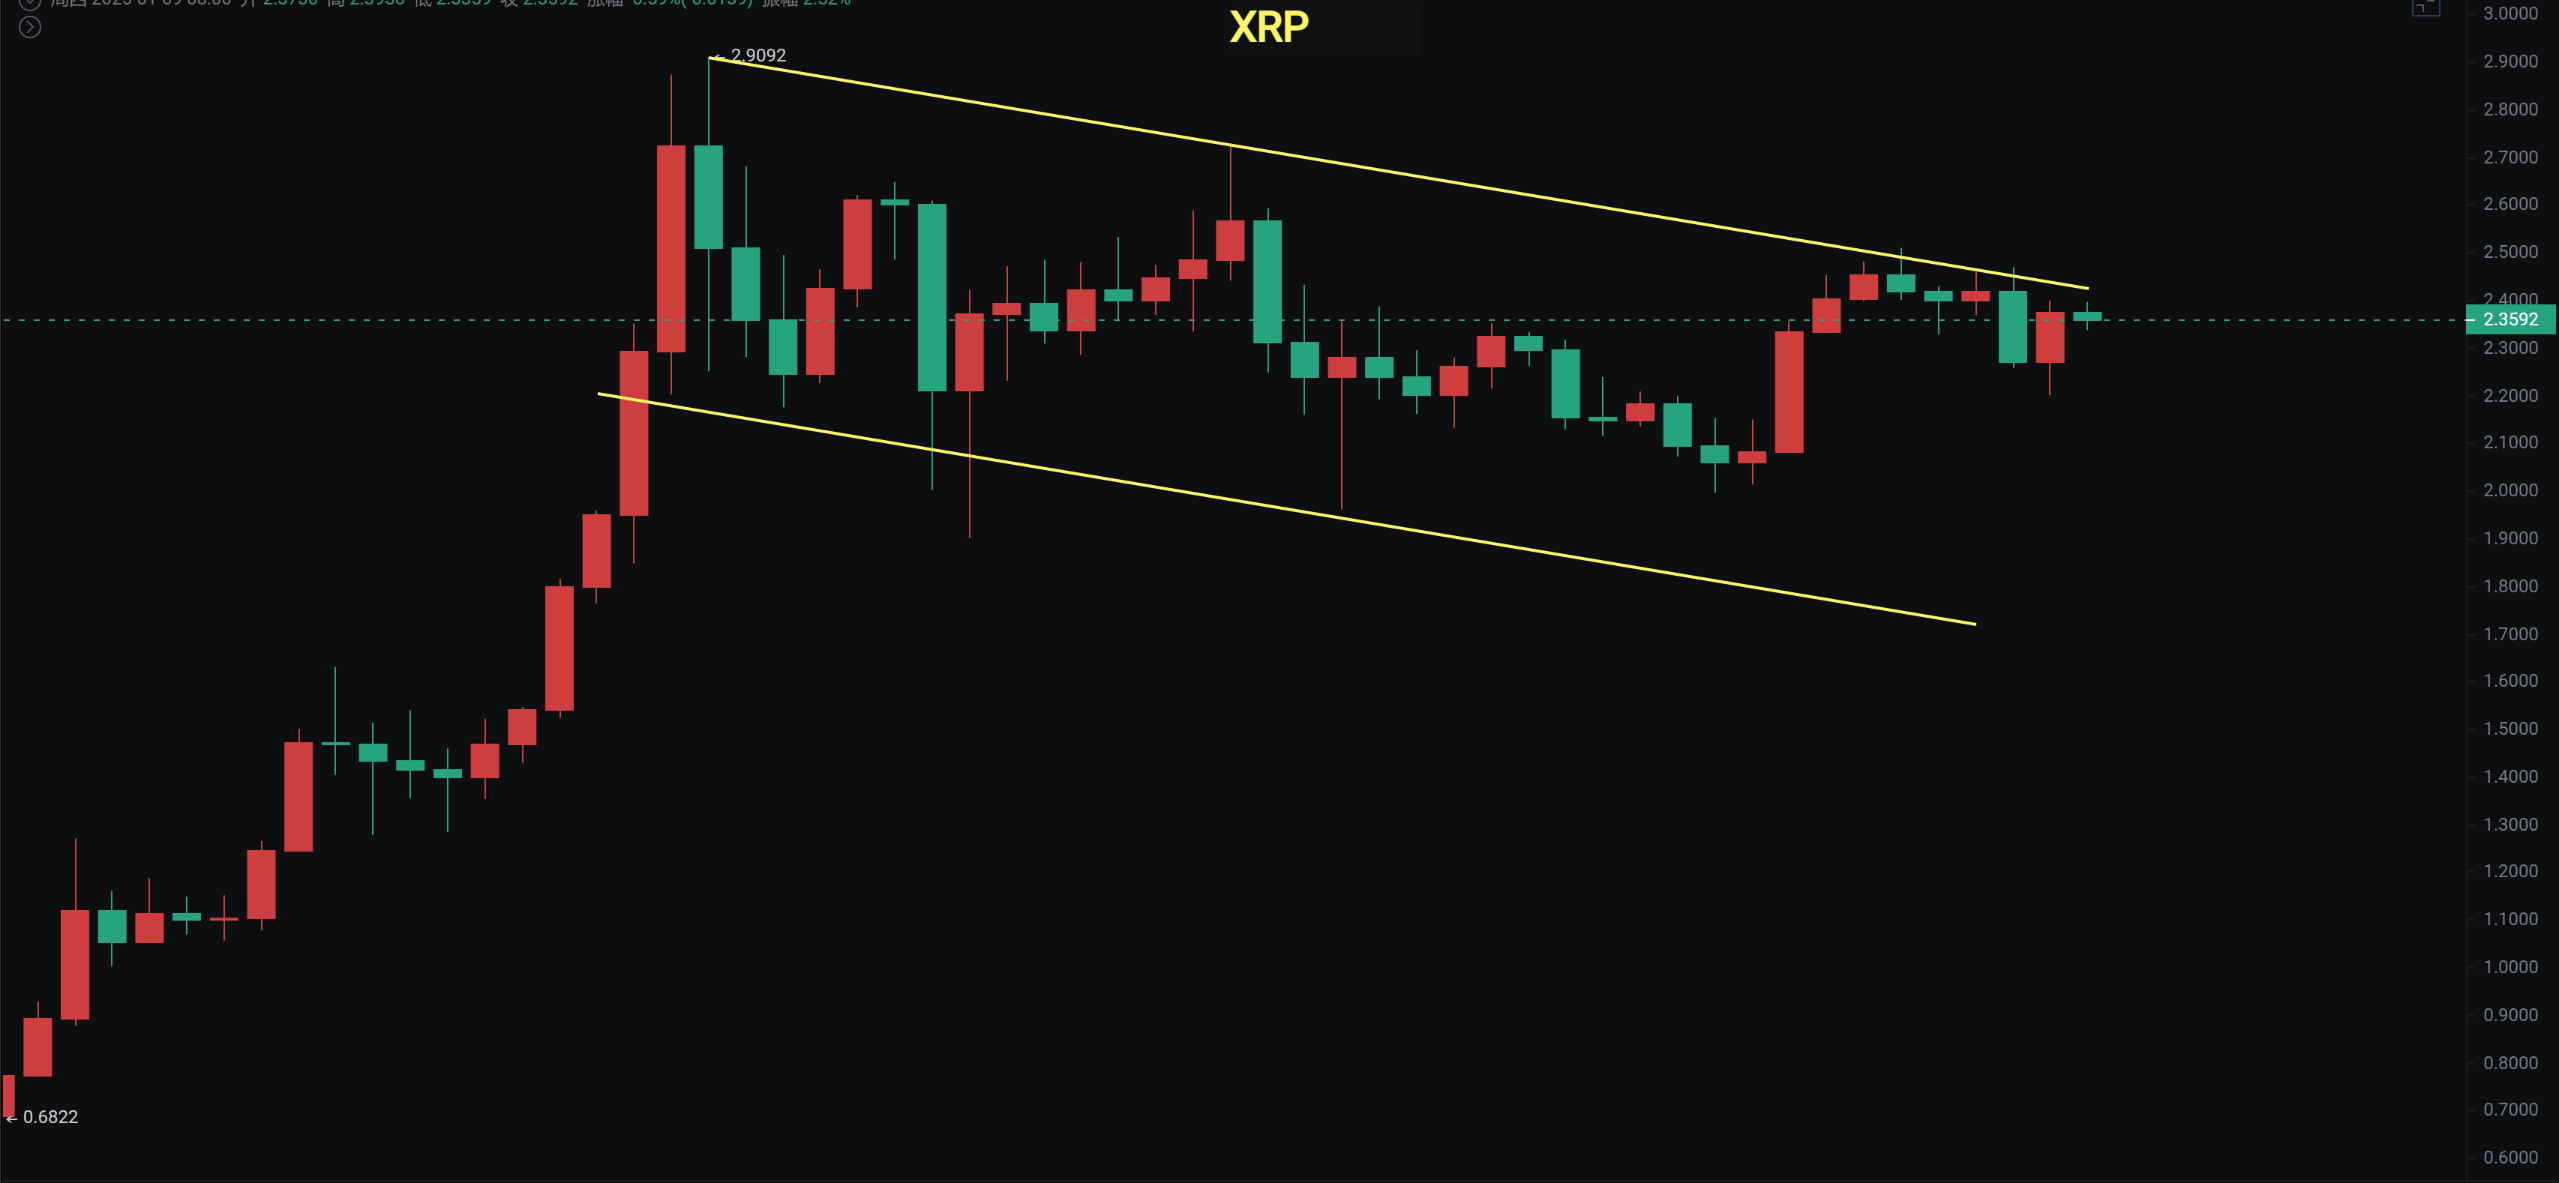
XRP
The daily chart is still within a descending channel and is relatively resilient, showing little retracement. In the future, the focus will be on catching up.
If you like my views, please like, comment, and share. Let's navigate through the bull and bear markets together!!!
The article is time-sensitive and for reference only, with real-time updates.
Focusing on K-line technical research, sharing global investment opportunities. Official account: Trading Prince Fusu

免责声明:本文章仅代表作者个人观点,不代表本平台的立场和观点。本文章仅供信息分享,不构成对任何人的任何投资建议。用户与作者之间的任何争议,与本平台无关。如网页中刊载的文章或图片涉及侵权,请提供相关的权利证明和身份证明发送邮件到support@aicoin.com,本平台相关工作人员将会进行核查。


