According to the AICoin market chart data, let's analyze the trend of Bitcoin on January 6.
Long-term Trend Analysis
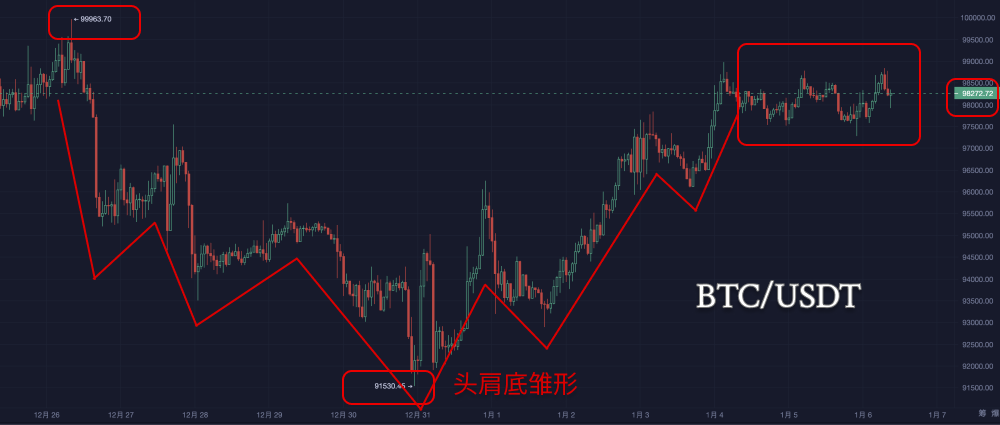
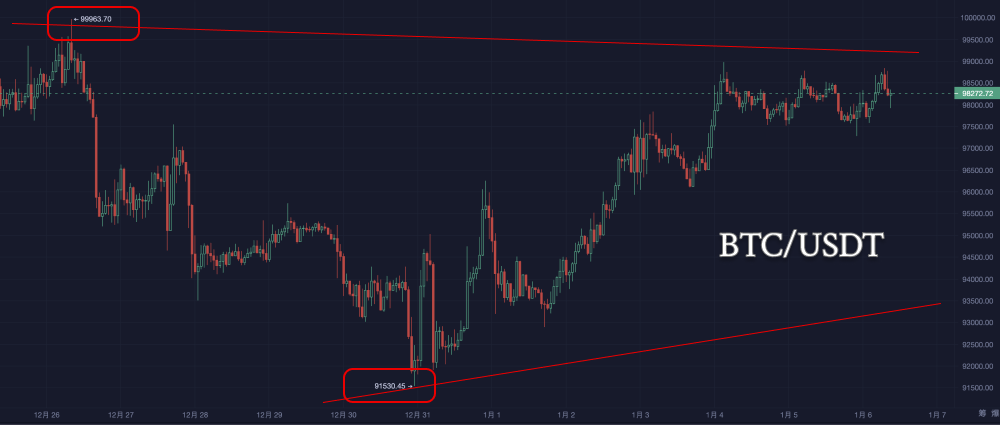
Trend Review: Starting from December 26, after reaching a high of 99963.70, the price experienced a significant downward trend, hitting a low of 91530.45. Subsequently, the market oscillated at a low level and gradually moved upward, forming a preliminary V-shaped reversal pattern, rebounding to around 98090.45.
Key Patterns:
- Inverted Head and Shoulders: From December 26 to January 3, the price trend may form an inverted head and shoulders pattern, with 91530.45 as the bottom.
- Consolidation: The current price is in a consolidation phase, with the high not yet breaking through the previous high of 99963.70.
Support and Resistance:
- Long-term Support Level: 91530.45, as the recent low, is an important long-term support level.
- Long-term Resistance Level: 99963.70 is the previous high, which needs to be closely monitored for potential breakthroughs.
Short-term Trend Analysis
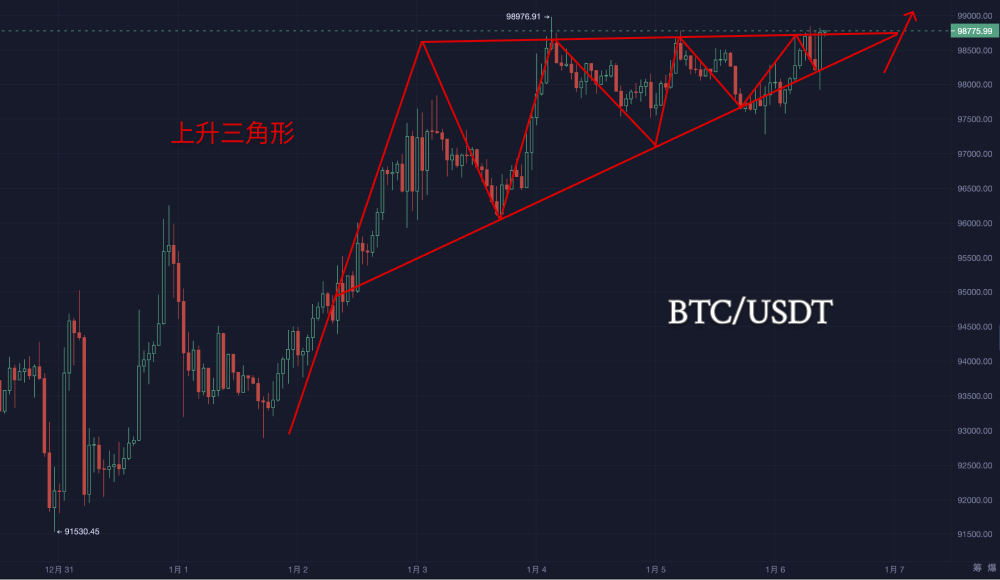
Trend Review: The chart shows that the price has generally exhibited an upward oscillation trend since the beginning of January, with a peak reaching 98976.91. The current price has retraced to around 98069.80, indicating that bulls are encountering some resistance near the previous high.
Key Patterns:
- Ascending Triangle Breakout: The previous trend indicates that the price formed an ascending triangle pattern, briefly spiking to 98976.91 after the breakout.
- Pullback Confirmation: The current price is undergoing a pullback after the breakout, focusing on whether it can hold above 97500.
Support and Resistance:
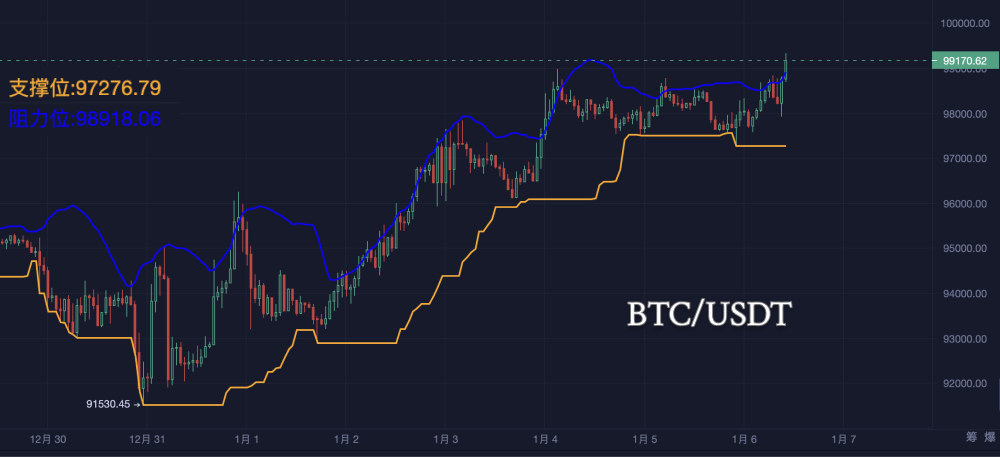
- Short-term Support Level: The range of 97500 to 98000 is currently an important support area. If it stabilizes, the probability of further upward movement is high.
- Short-term Resistance Level: 98976.91 is the recent high. If this level is broken, it may continue to challenge 99500 or even the 100000 mark.
Technical Indicator Analysis:
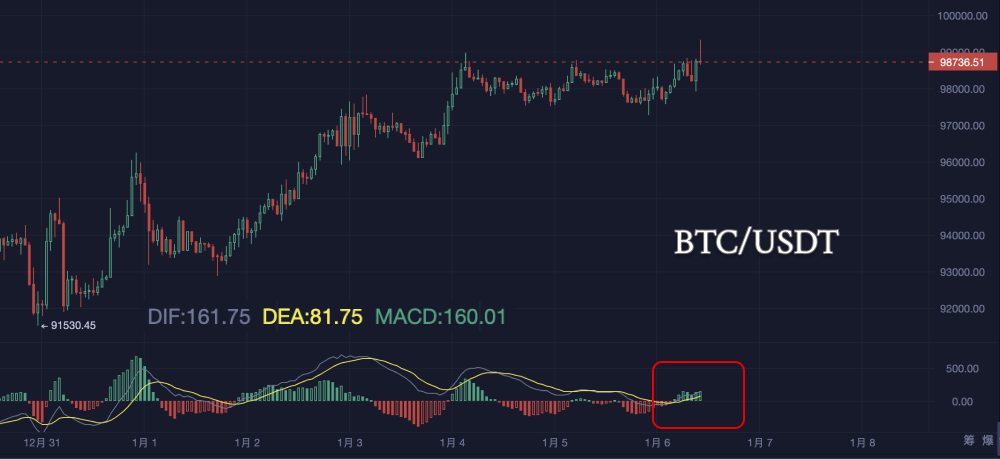
MACD: The MACD histogram is gradually lengthening, with the DIF line crossing above the DEA line, indicating that bullish strength is increasing in the short term.
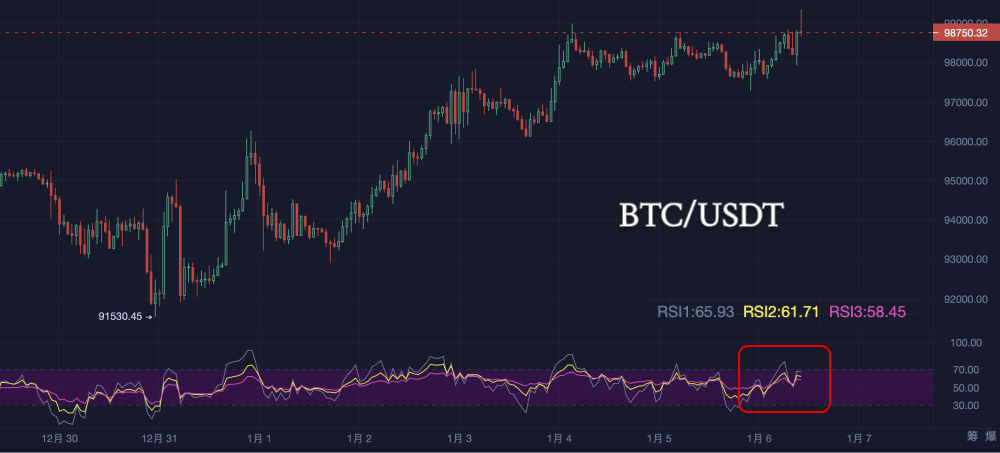
RSI: The RSI value is around 60, not entering the overbought or oversold zones, but close to the overbought area, requiring attention to potential pullbacks.
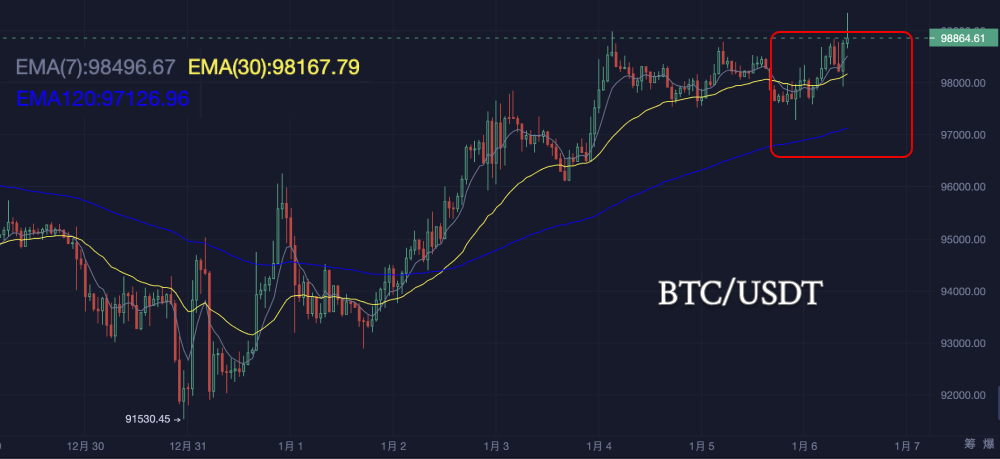
EMA: The current price is above EMA7, EMA30, and EMA120, with EMA7 > EMA30 > EMA120, indicating that the short-term, medium-term, and long-term moving averages are all in a bullish arrangement, showing a positive trend.
Combined Long-term and Short-term Analysis
Long-term Trend: The long-term trend remains within a channel of upward oscillation, but the upward momentum is gradually weakening. The important long-term support level is at 91530.45, and the current price is still above this support, indicating that the market is overall still bullish.
Short-term Trend: In the short term, the price has encountered resistance at the important resistance level of 98976.91 after a recent rebound, accompanied by signs of pullback confirmation. Currently seeking support in the 97500-98000 range is crucial for whether the bulls can continue.
Common Signals:
- Oscillation Range: Both long-term and short-term analyses indicate that the market exhibits strong oscillation characteristics, with the long-term range being 91500-100000 and the short-term range being 97500-98976.
- Momentum Change: The pullback behavior after the short-term rebound is relatively healthy. If the support holds, the market may continue to challenge the long-term resistance area of 99500-100000.
Market Forecast
Bullish Scenario (Probability High, 60%):
- Logic: The long-term bullish trend remains intact, and if the price stabilizes at the support level with increased volume, it may break upward again.
- Target Level: Short-term target: After breaking 98976.91, reach the psychological level of 99500, or even challenge 100000. Long-term target: After breaking upward, the space opens up, potentially challenging 102000.
Consolidation Scenario (Medium Probability, 30%):
- Logic: If the short-term rebound momentum is insufficient, the market may oscillate within the range of 97500-98976, waiting for direction selection.
- Target Level: Upper limit: 98976-99500. Lower limit: 96500-97500.
Bearish Scenario (Low Probability, 10%):
- Logic: If the price breaks below the 97500 support, bullish confidence may be undermined, triggering more selling.
- Target Level: Short-term support: 96500. Long-term support: 94500-91500.
Operational Suggestions
Conservative Investors: Wait for the price to break above 98976.91 to confirm the short-term upward trend, then take a light long position, targeting 99500-100000. Set a stop loss at 97500 to avoid pullback risks.
Aggressive Investors: Currently attempt to establish long positions in the 97500-98000 range, waiting for a short-term rebound, targeting 98976.91. If it breaks below 97500, quickly stop loss and observe the support performance at 96500.
Risk Control: The market is still in a consolidation pattern, and it is crucial to avoid chasing highs and lows. Carefully observe the volume-price relationship; if the volume decreases during a pullback, it indicates strong support; conversely, be cautious in operations.
Comprehensive Summary
The market is currently in a short-term pullback phase within a long-term upward oscillation, with key support at 97500 and resistance at 98976.91 being very important for the future direction. It is recommended that investors adopt flexible strategies, patiently waiting for clearer direction while strictly controlling risks.
If you have any questions, you can contact us through the following official channels:
AICoin Official Website: www.aicoin.com
Telegram: t.me/aicoincn
Twitter: x.com/AICoincom
Email: support@aicoin.com
Group Chat: Customer Service Yingying、Customer Service KK
免责声明:本文章仅代表作者个人观点,不代表本平台的立场和观点。本文章仅供信息分享,不构成对任何人的任何投资建议。用户与作者之间的任何争议,与本平台无关。如网页中刊载的文章或图片涉及侵权,请提供相关的权利证明和身份证明发送邮件到support@aicoin.com,本平台相关工作人员将会进行核查。


