Author: Bitcoin Magazine Pro
Translation: Blockchain in Plain Language
As we move into 2025, it is time to examine the potential scenarios Bitcoin may face this year in a rational and analytical manner. By combining on-chain data, market cycles, macroeconomic data, and other factors, we can go beyond mere speculation and paint a data-driven picture for the coming months.
1. MVRV Z-Score: Huge Upside Potential
The MVRV Z-Score measures the ratio between Bitcoin's realized price (the average purchase price of all Bitcoins in the network) and its market capitalization. By standardizing the volatility of this ratio, we obtain the Z-Score, which historically has clearly shown the trends of market cycles.
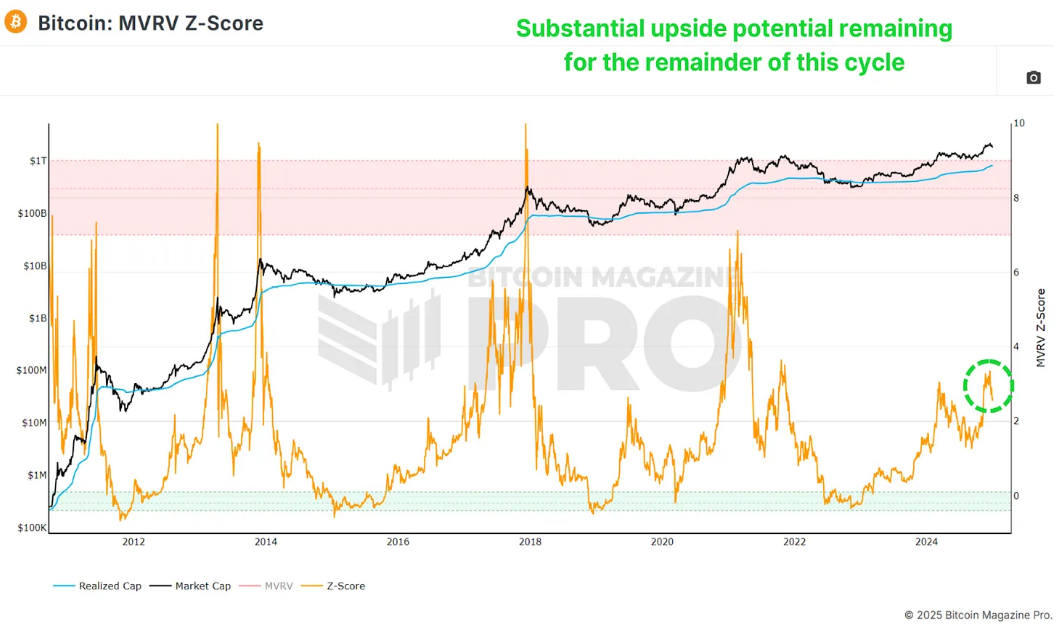
Figure 1: The MVRV Z-Score indicates we still have a long way to go before reaching the market cycle peak.
Currently, the MVRV Z-Score suggests that we still have significant upside potential. Although the Z-Score has exceeded 7 in past cycles, I believe any value above 6 indicates market overextension, requiring closer observation of market peaks in conjunction with other indicators. Our current level is comparable to May 2017, when Bitcoin's price was only a few thousand dollars. Considering the historical context, there is still potential for several hundred percentage points of upside from the current level.
2. PiCycle Oscillator: Bullish Momentum Resuming
Another key indicator is the PiCycle top and bottom indicator, which tracks the 111-day and 350-day moving averages (the latter multiplied by 2). Historical data shows that when these two moving averages cross, it typically signals that Bitcoin's price will peak within a few days.
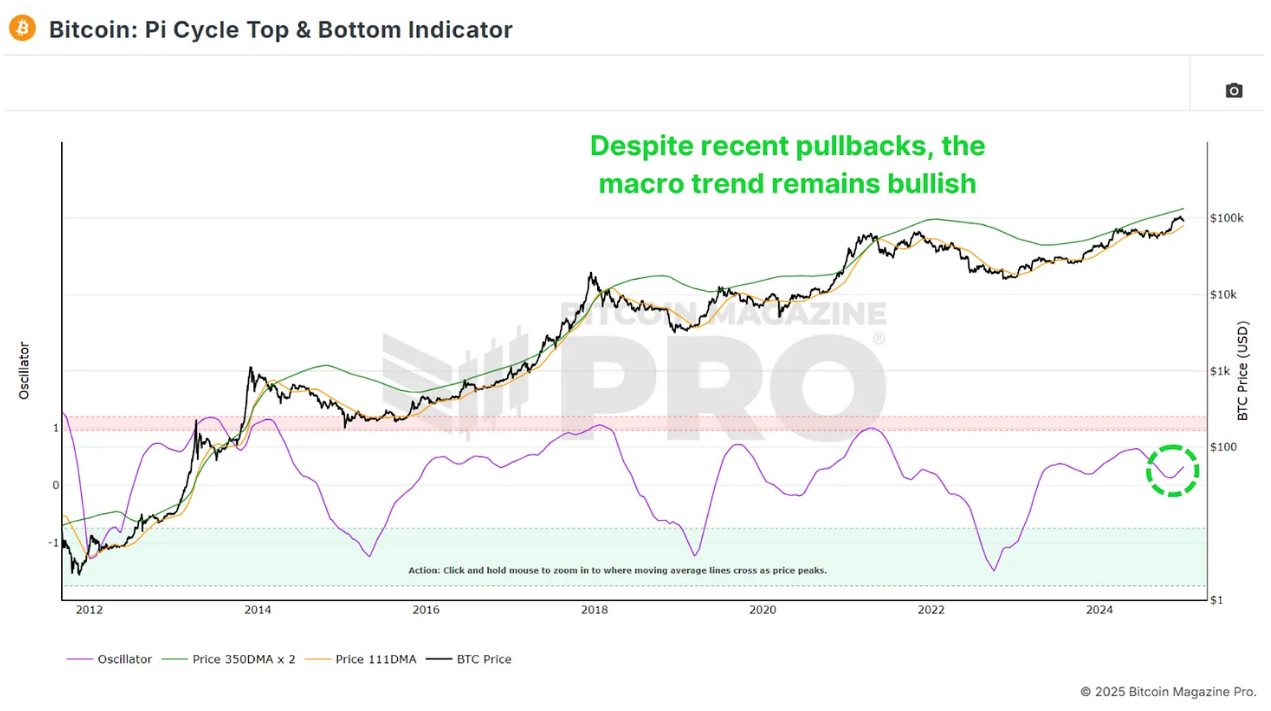
Figure 2: The macro trend remains bullish.
The distance between these two moving averages has begun to rise again, indicating that bullish momentum is resuming. Despite experiencing several periods of consolidation in 2024, the current breakout suggests that Bitcoin is entering a stronger growth phase, which may last for several months.
3. Exponential Growth Phase of the Cycle
From Bitcoin's historical price trends, cycles typically last 6 to 12 months in the "post-halving cooling" phase before entering an exponential growth phase. Based on past cycle data, we are approaching this breakout point. Although the return rates may be lower compared to earlier cycles, we could still see significant gains.
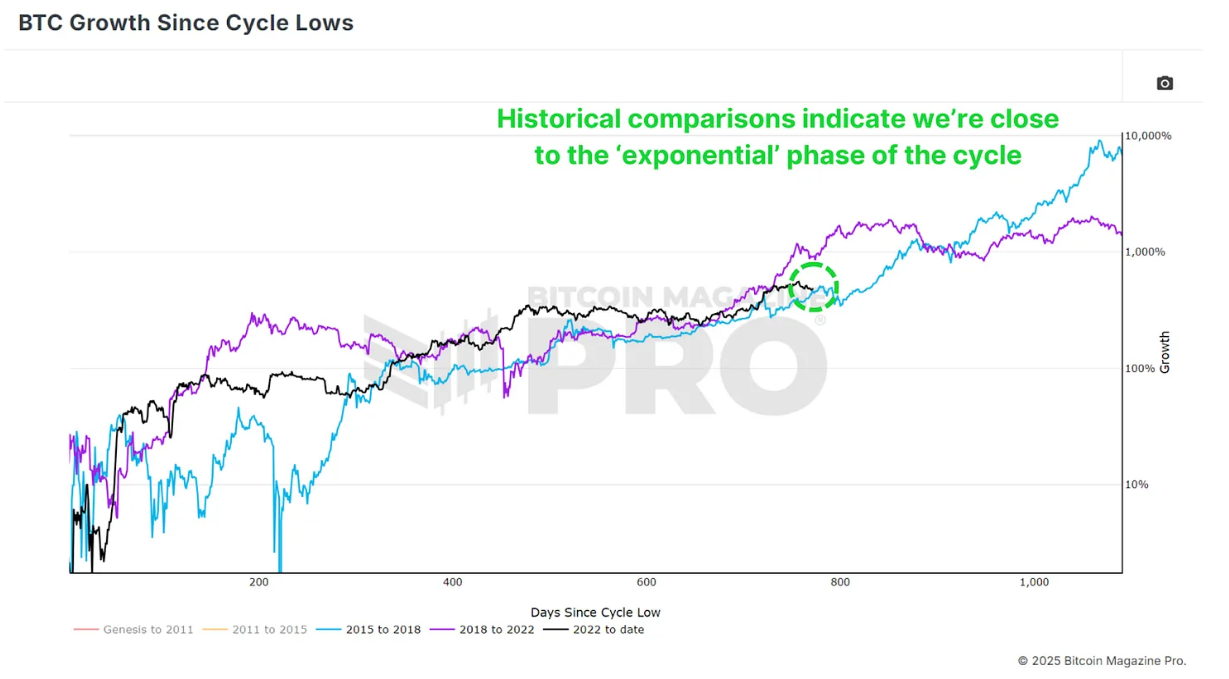
Figure 3: Compared to previous bull market cycles, we are nearing the most bullish phase of the cycle.
As background information, after breaking the previous historical high of $20,000 in the 2020 cycle, Bitcoin's price peaked at nearly $70,000, achieving a 3.5-fold increase. If we see a conservative estimate of a 2x or 3x increase from the previous peak of $70,000, Bitcoin could realistically reach between $140,000 and $210,000 in this cycle.
4. Macroeconomic Factors Supporting Bitcoin's Performance in 2025
Despite facing some resistance in 2024, Bitcoin has remained strong, even in the face of a strengthening U.S. Dollar Index (DXY). Historically, Bitcoin's movement has typically been inversely correlated with the DXY, so if the DXY experiences a strong reversal, it could further boost Bitcoin's upside potential.
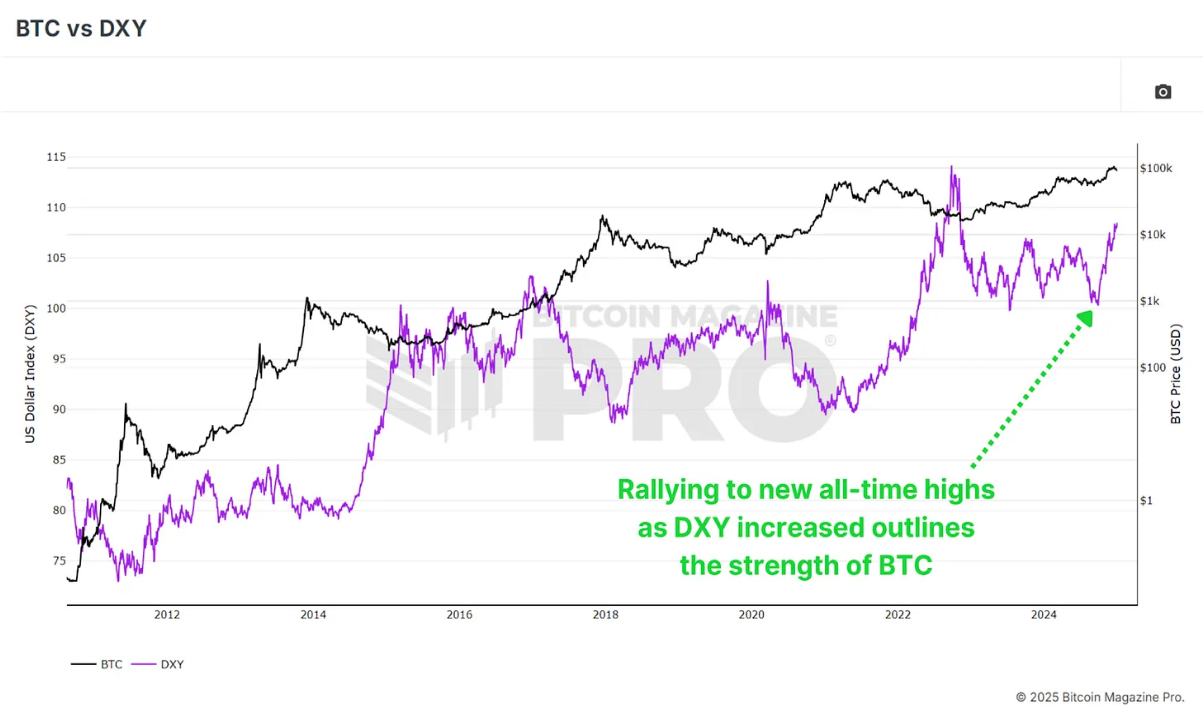
Figure 4: Even with a significant rise in the Dollar Index, Bitcoin continues to rise.
Other macroeconomic indicators, such as the high-yield credit cycle and global M2 money supply, suggest that the market environment for Bitcoin is improving. The monetary supply contraction observed in 2024 is expected to reverse in 2025, laying the groundwork for a more favorable market environment.
5. Cycle Master Chart: A Long Way to Go
The Bitcoin cycle master chart aggregates multiple on-chain valuation indicators, showing that Bitcoin still has considerable growth potential before reaching overvaluation. Currently, the upper limit is around $190,000, and this upper limit continues to rise, further reinforcing the outlook for sustained upward momentum.
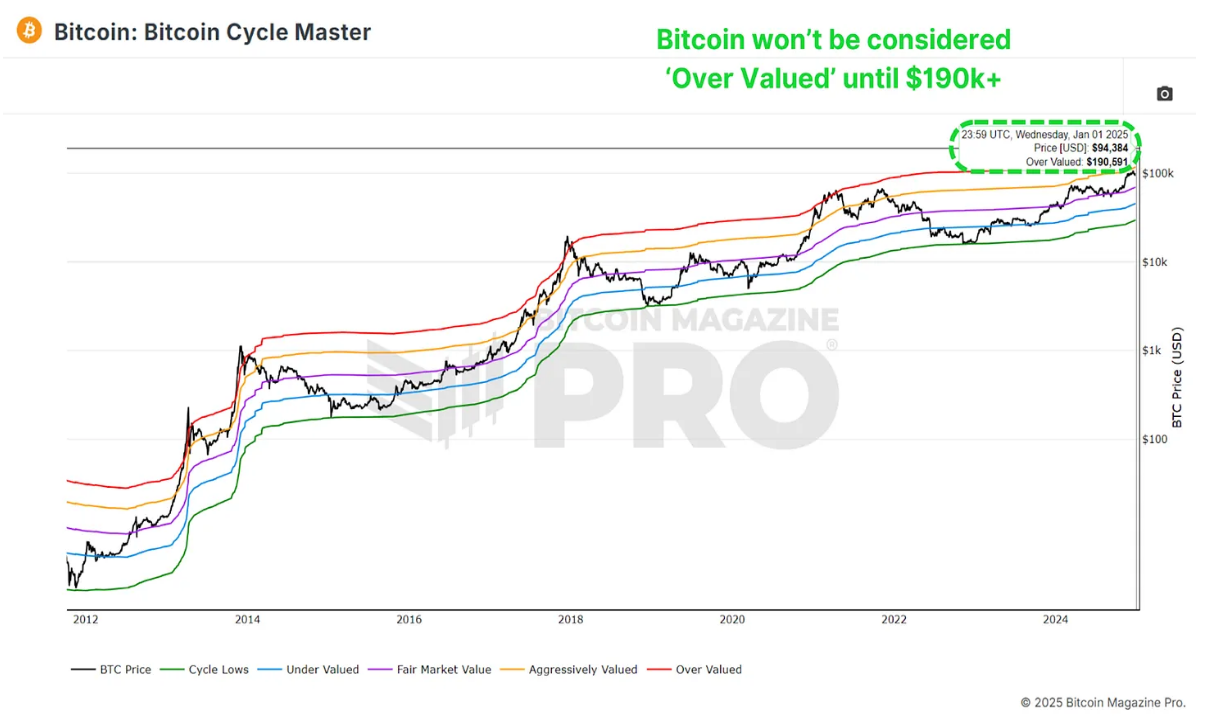
Figure 5: The "overvaluation" level of the cycle master chart has exceeded $190,000.
6. Conclusion
Currently, almost all data indicators point to a bullish 2025. As always, past performance does not guarantee future results, but the data strongly suggests that Bitcoin's best days may still lie ahead, even after an exceptionally positive performance in 2024.
免责声明:本文章仅代表作者个人观点,不代表本平台的立场和观点。本文章仅供信息分享,不构成对任何人的任何投资建议。用户与作者之间的任何争议,与本平台无关。如网页中刊载的文章或图片涉及侵权,请提供相关的权利证明和身份证明发送邮件到support@aicoin.com,本平台相关工作人员将会进行核查。


