Bottom Pattern Analysis
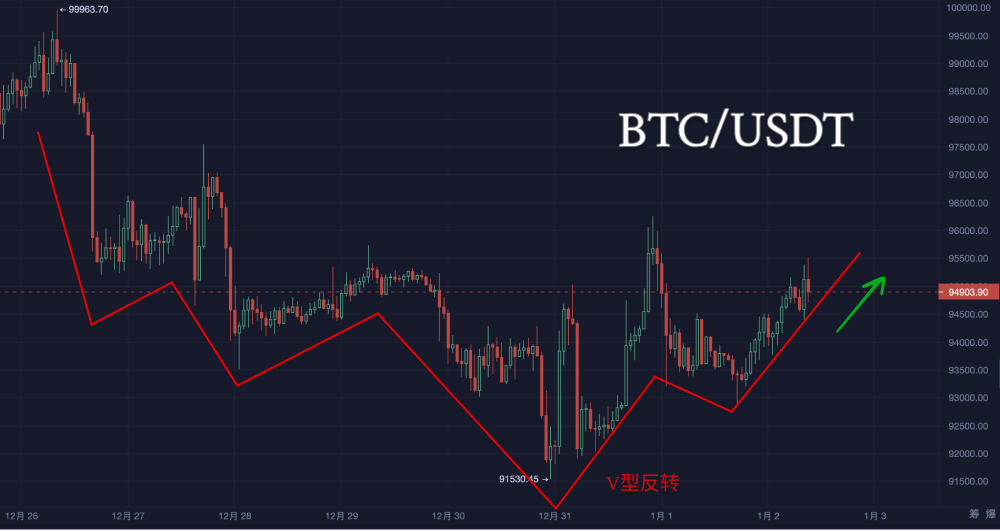
The chart shows a clear low point formed on December 28 (around 91,530.45), after which the price gradually rebounded, exhibiting characteristics of a "V-shaped reversal." In the upward trend following the reversal, several long bullish candles appeared, indicating strong buying power in the market.
Short-term Consolidation Pattern
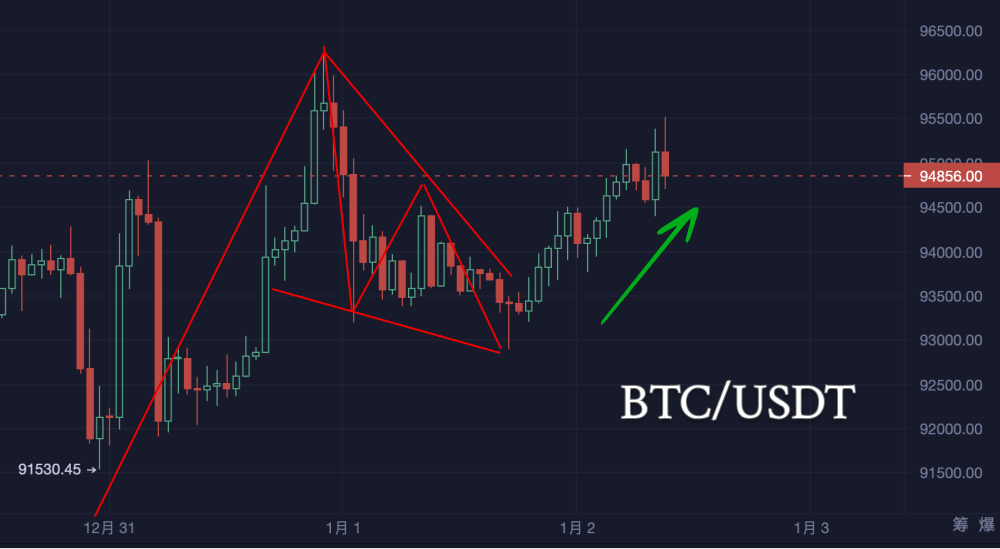
During the rebound from December 31 to January 2, the price formed a narrow oscillation range, possibly part of a "rectangular consolidation" or "flag consolidation." The previous price has broken through the upper boundary of the consolidation range, indicating the possibility of further upward movement.
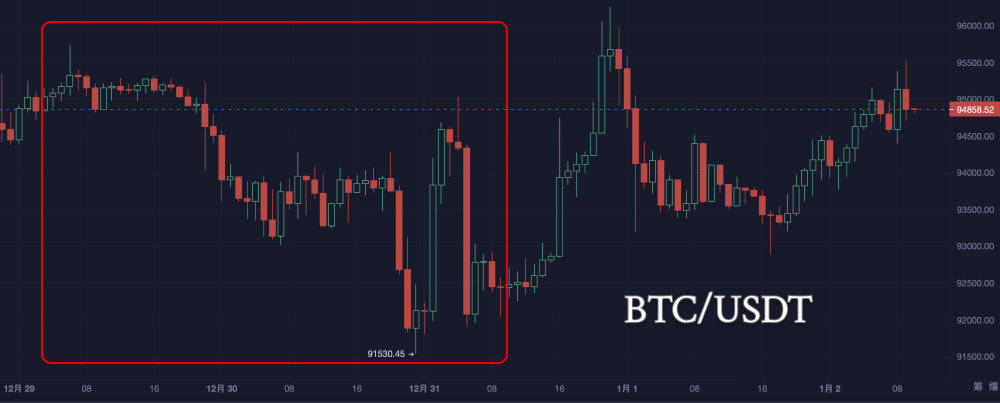
In the range from December 29 to December 31, the price showed an overall downward oscillation trend. Multiple long lower shadows appeared, indicating strong support below, with selling pressure gradually weakening at lower levels.
Around January 1, the price showed a strong rebound, closing with a large bullish candle, breaking through the previous oscillation range, indicating increased bullish confidence. The current trend shows a series of small bullish candles, in an oscillating upward trend, indicating market bullish dominance, but the upper shadow indicates some pressure above.
K-line Support and Resistance Analysis
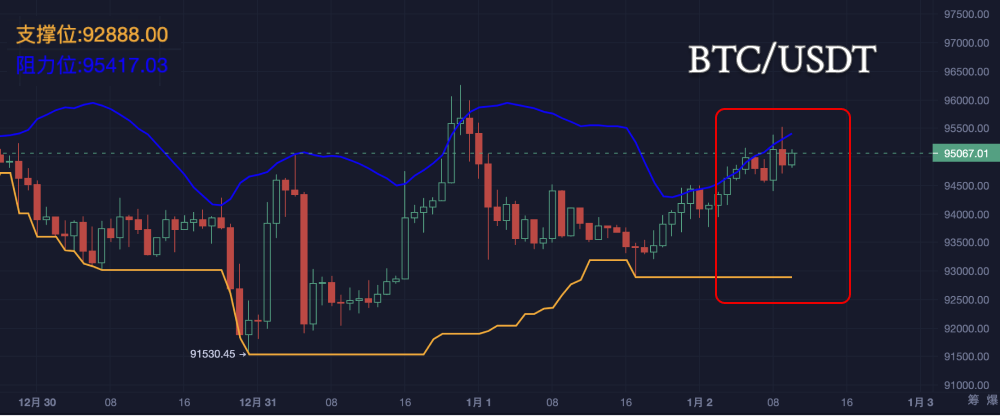
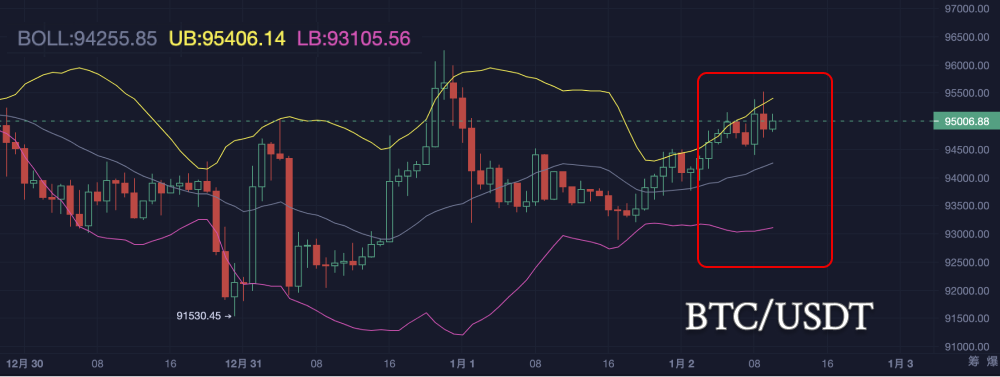
Resistance Level: Yellow line (Resistance): Around 95417.63, close to the current price, attention should be paid to whether the price can effectively break through in the short term. If the resistance level is broken, 97544 may become the next target.
Support Level: Lower support level: 92888. The price has touched this point multiple times without breaking below, forming strong support.
Trend Summary: The current price is between support and resistance, in a key area. If it breaks through 95304 with volume, the price may further test 97544.
Bollinger Bands Analysis
Bollinger Band Shape: The Bollinger Bands are gradually widening, indicating increased market volatility. The current price has broken through the middle band and is approaching the upper band, showing that the market is strong in the short term.
Price Position: If the price continues to operate near the upper band, it indicates strong bullish power, and the market tends to rise. If the price breaks down through the middle band, it may test the lower band area (near support level 92888) again.
Technical Indicators Analysis
MACD: The current MACD is in the positive area, but the DIF and DEA are gradually approaching, which may signal a death cross, requiring attention to subsequent trends.
RSI: The RSI is currently around 60, not entering the overbought or oversold range, with no obvious pullback or rebound signals in the short term.

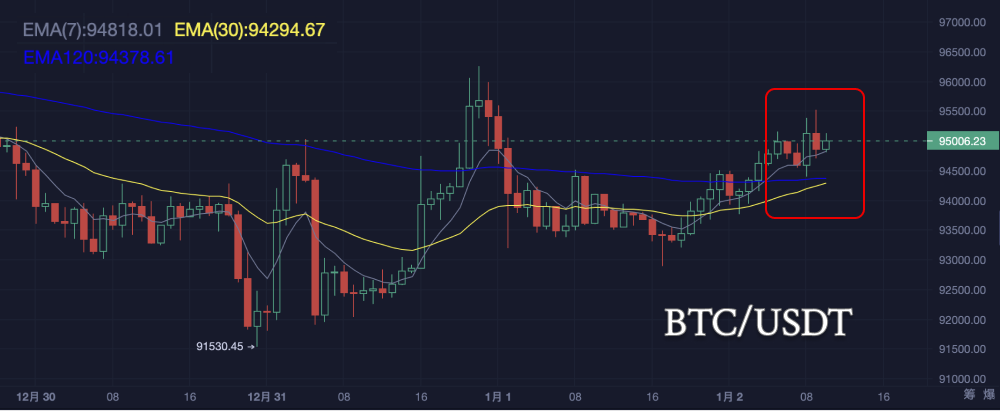
EMA: The 7-hour EMA (94818) is close to the current price, while the 30-hour EMA (94294) and 120-hour EMA (94378) are both below the current price, indicating that the overall trend is still upward.
OBV:
- Trend Analysis
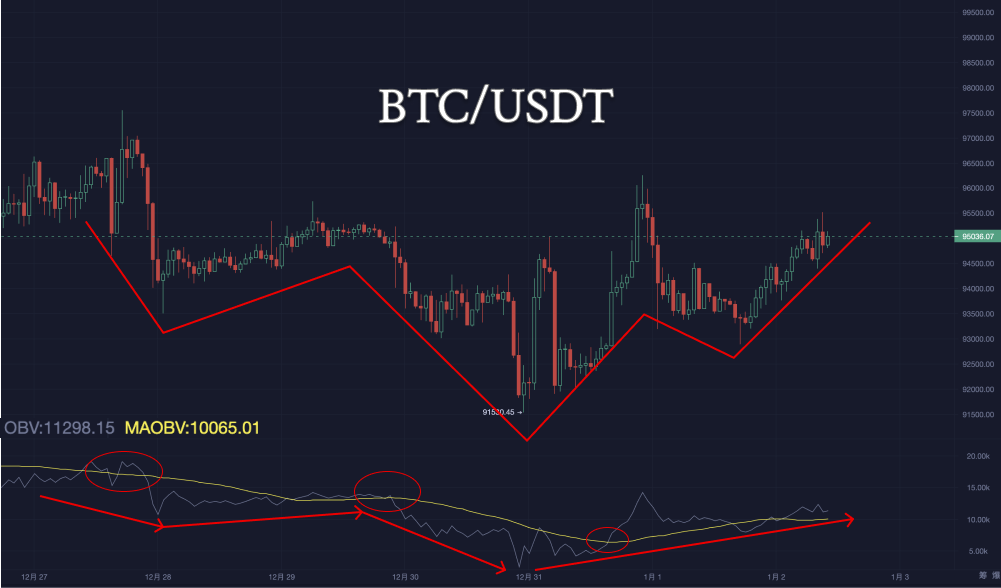
- Downward Trend (December 27 - December 31): The OBV value continued to decline, indicating that during this period, trading volume was often accompanied by price declines, showing heavy selling pressure in the market.
- Stabilizing Rebound (Starting January 1): The OBV gradually stopped falling and rebounded from a low position, breaking through the short-term moving average (yellow line MAOBV). This change indicates that buying power in the market is gradually increasing, and bottom-fishing funds may be entering.
- Moving Average MAOBV Cross Analysis
- Death Cross (December 28 - 29): The OBV curve fell below the moving average MAOBV, indicating weakened market momentum, and the price may continue to weaken.
- Golden Cross (Around January 1): The OBV curve rose above the moving average MAOBV, suggesting that market momentum is strengthening, and further upward movement may occur in the future.
- Combined with K-line Patterns
- The rebound of OBV is basically consistent with the "V-shaped reversal" trend in the previous K-line chart, further confirming the enhancement of buying power and the possibility of price rebound.
Today's Trend Prediction
Bullish Scenario
If it breaks through the resistance level (95417): Target level: 97544 (recent key resistance above). Momentum signal: Confirmed by a bullish candle with volume. Strategy: Follow the trend to go long, with a stop loss set below the resistance level.
Strong Characteristics: The price continuously closes at high levels and breaks through the upper Bollinger Band, indicating that the upward trend is expected to continue.
Bearish Scenario
If it is blocked and falls back: Pullback target: 92888 (near the middle Bollinger Band and support level). Momentum signal: Appearance of long upper shadows, bearish candles with volume, or signals breaking below the support level. Strategy: Attempt to short, with a target of 92888 and a stop loss set above 95304.
Weak Characteristics: If today's price closes below yesterday's opening price, it indicates bullish exhaustion, and deeper pullbacks should be guarded against.
Comprehensive Suggestions
Main Strategy: Focus on the breakthrough situation near the resistance level of 95304. If broken, look bullish with a target of 97544; if blocked, attempt to short with a target of 92888. The Bollinger Bands indicate increased volatility, and the price may run along the upper band in the short term, but caution should be taken against price pullbacks.
Auxiliary Signals: Combine trading volume to confirm momentum direction, avoiding false breakouts or oscillation risks.
Risk Warning: It is recommended to respond flexibly to intraday trends, control positions, and set stop losses! The above content is for reference only and does not constitute investment advice.
If you have any questions, you can contact us through the following official channels:
AICoin Official Website: www.aicoin.com
Telegram: t.me/aicoincn
Twitter: x.com/AICoincom
Email: support@aicoin.com
Group Chat: Customer Service Yingying, Customer Service KK
免责声明:本文章仅代表作者个人观点,不代表本平台的立场和观点。本文章仅供信息分享,不构成对任何人的任何投资建议。用户与作者之间的任何争议,与本平台无关。如网页中刊载的文章或图片涉及侵权,请提供相关的权利证明和身份证明发送邮件到support@aicoin.com,本平台相关工作人员将会进行核查。


