Bitcoin has increased by 125% throughout 2024, while Ethereum has risen by 48% over the same period. The Hong Kong-listed company Yuxing Technology purchased 78.2 Bitcoins in 2024, with an average purchase price of $80,960.
Switzerland has initiated a referendum review process to incorporate Bitcoin into its constitutional framework.
USDC Treasury has minted an additional 50 million USDC on the Ethereum chain, bringing the total minted on the Ethereum chain to over 274 million USDC.
Bitcoin
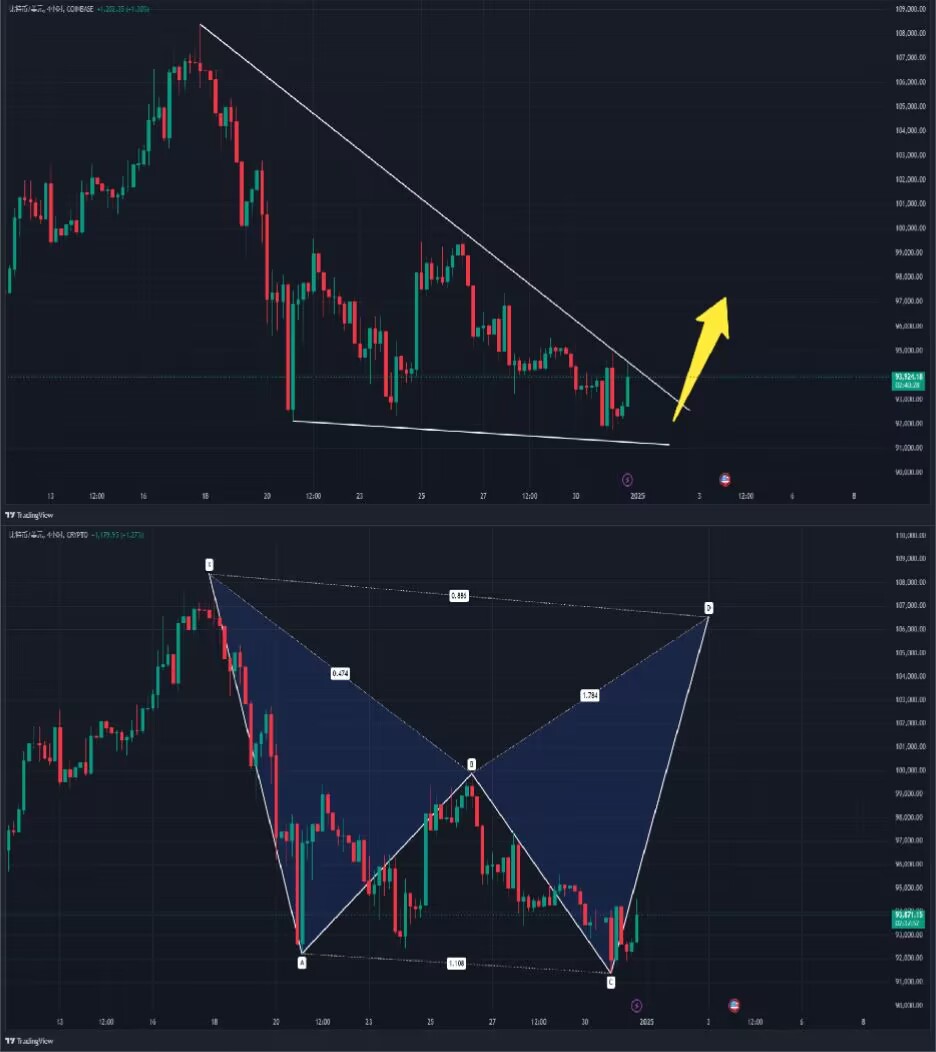
The daily chart for Bitcoin shows a bearish engulfing pattern, breaking below the previous pin at 92,232, with a low of 91,500 before rebounding. If it does not break below 91,500, this will be considered a temporary bottom, and if the daily chart retraces to MA60 without breaking, it could form a triple bottom.
The 4-hour chart also indicated a descending wedge and bat pattern, with a peak rebound to 96,250 before a decline. The MACD continues to show a bottom divergence, and we will see if the subsequent pressure at the 100,000 neckline can be broken. If it breaks, there is a chance to reach 103,333—106,000. The 1-hour chart shows a crazy washout, which is also a way to clear out long positions. Currently, it is still in a B-wave adjustment; if it does not break below 91,500, the correction will end, and breaking 100,000 will initiate a main upward wave.
Support: Pressure:

Ethereum
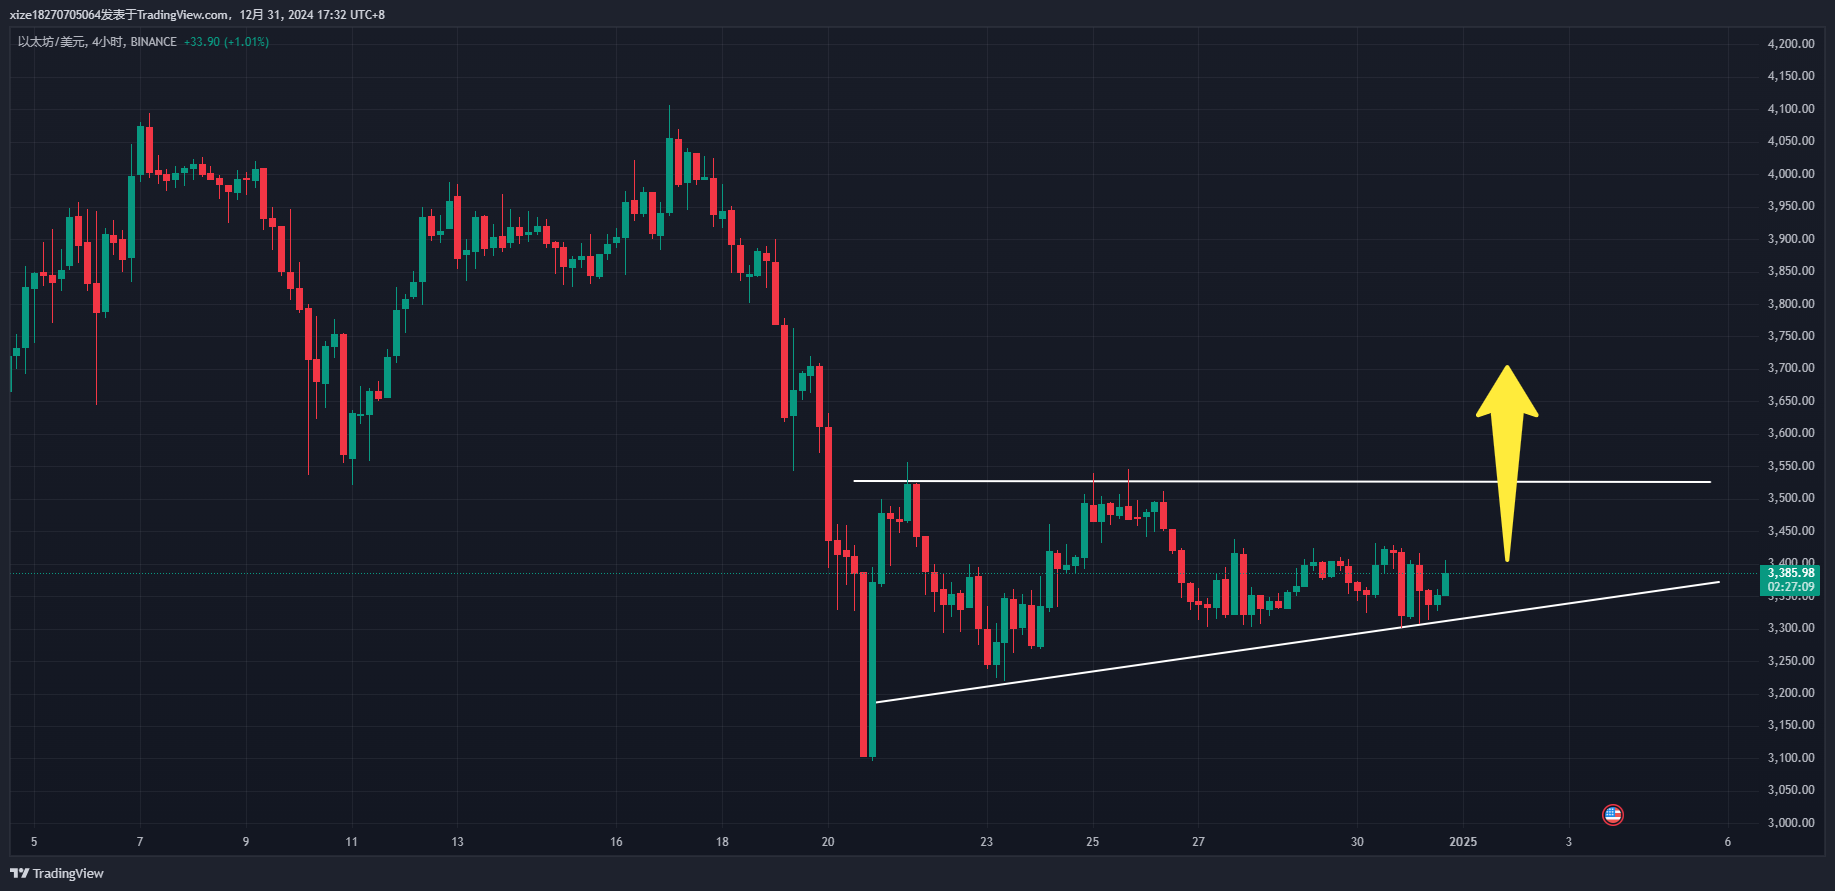
The daily chart for Ethereum has been in a narrow range of 3,300—3,444 for a week. Currently, it is still below 3,500, so we will see if Bitcoin can hold above 91,500 for a rebound; if it breaks through, Ethereum will follow suit. We have preemptively positioned and laid out some altcoins, so hold steady.
The strategy for Ethereum remains the same; if given a lower opportunity, we can still add to our positions.
Support: Pressure:

SOL
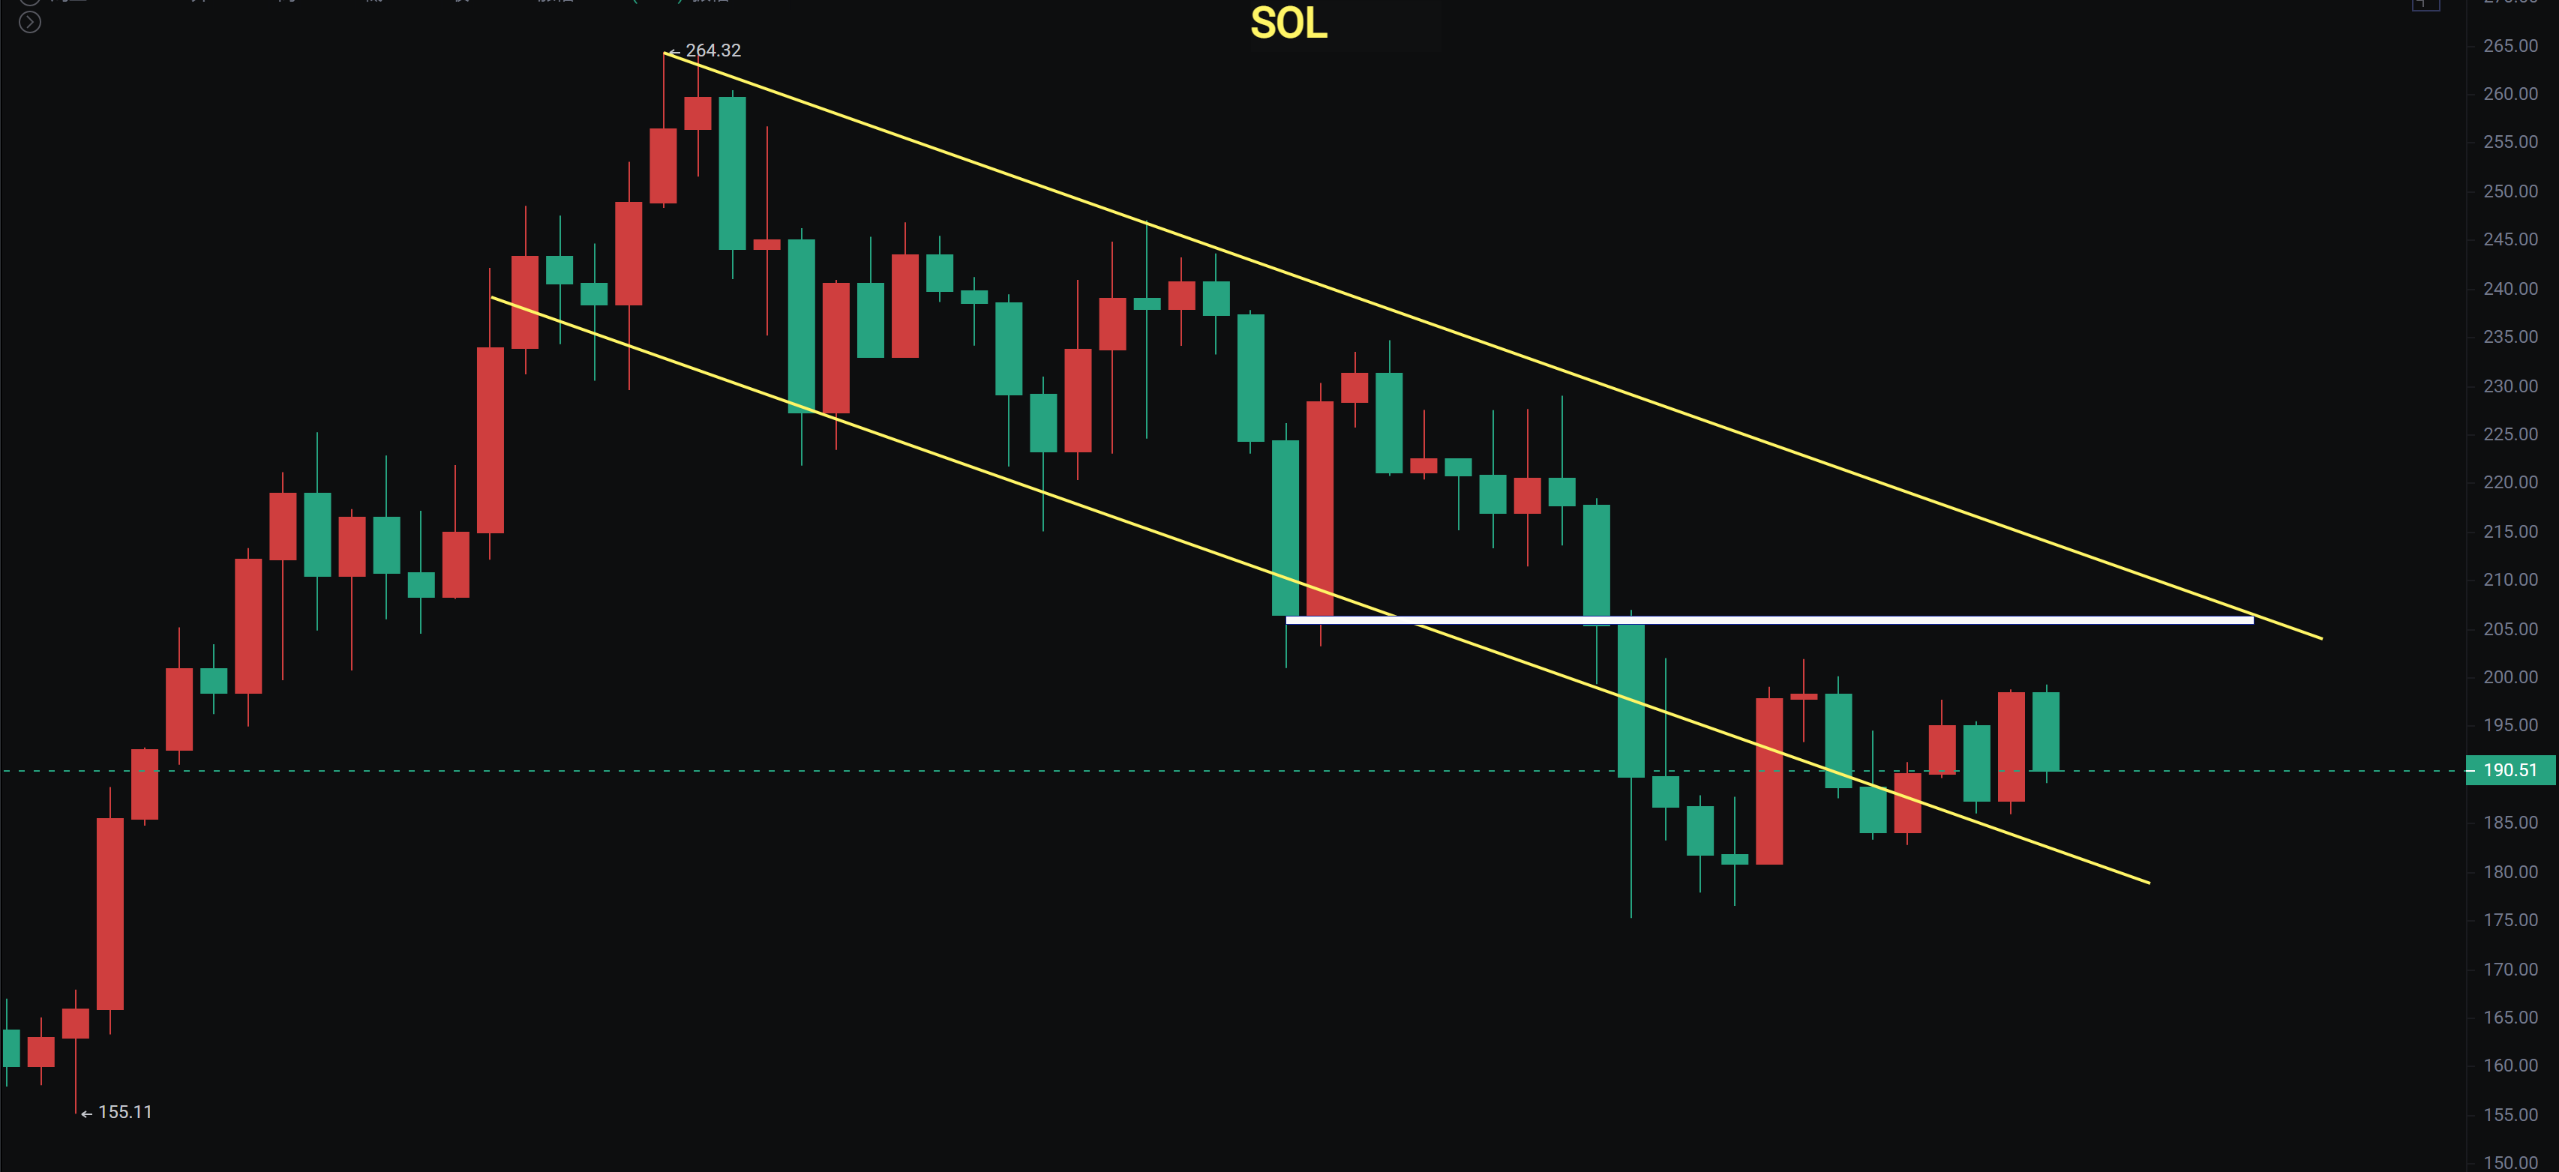
The daily chart has maintained a descending channel, with the price having dipped below the Fibonacci 0.5 level but has since recovered. If there is still an opportunity to buy in the range of 175—180, it remains a buying opportunity.

LTC
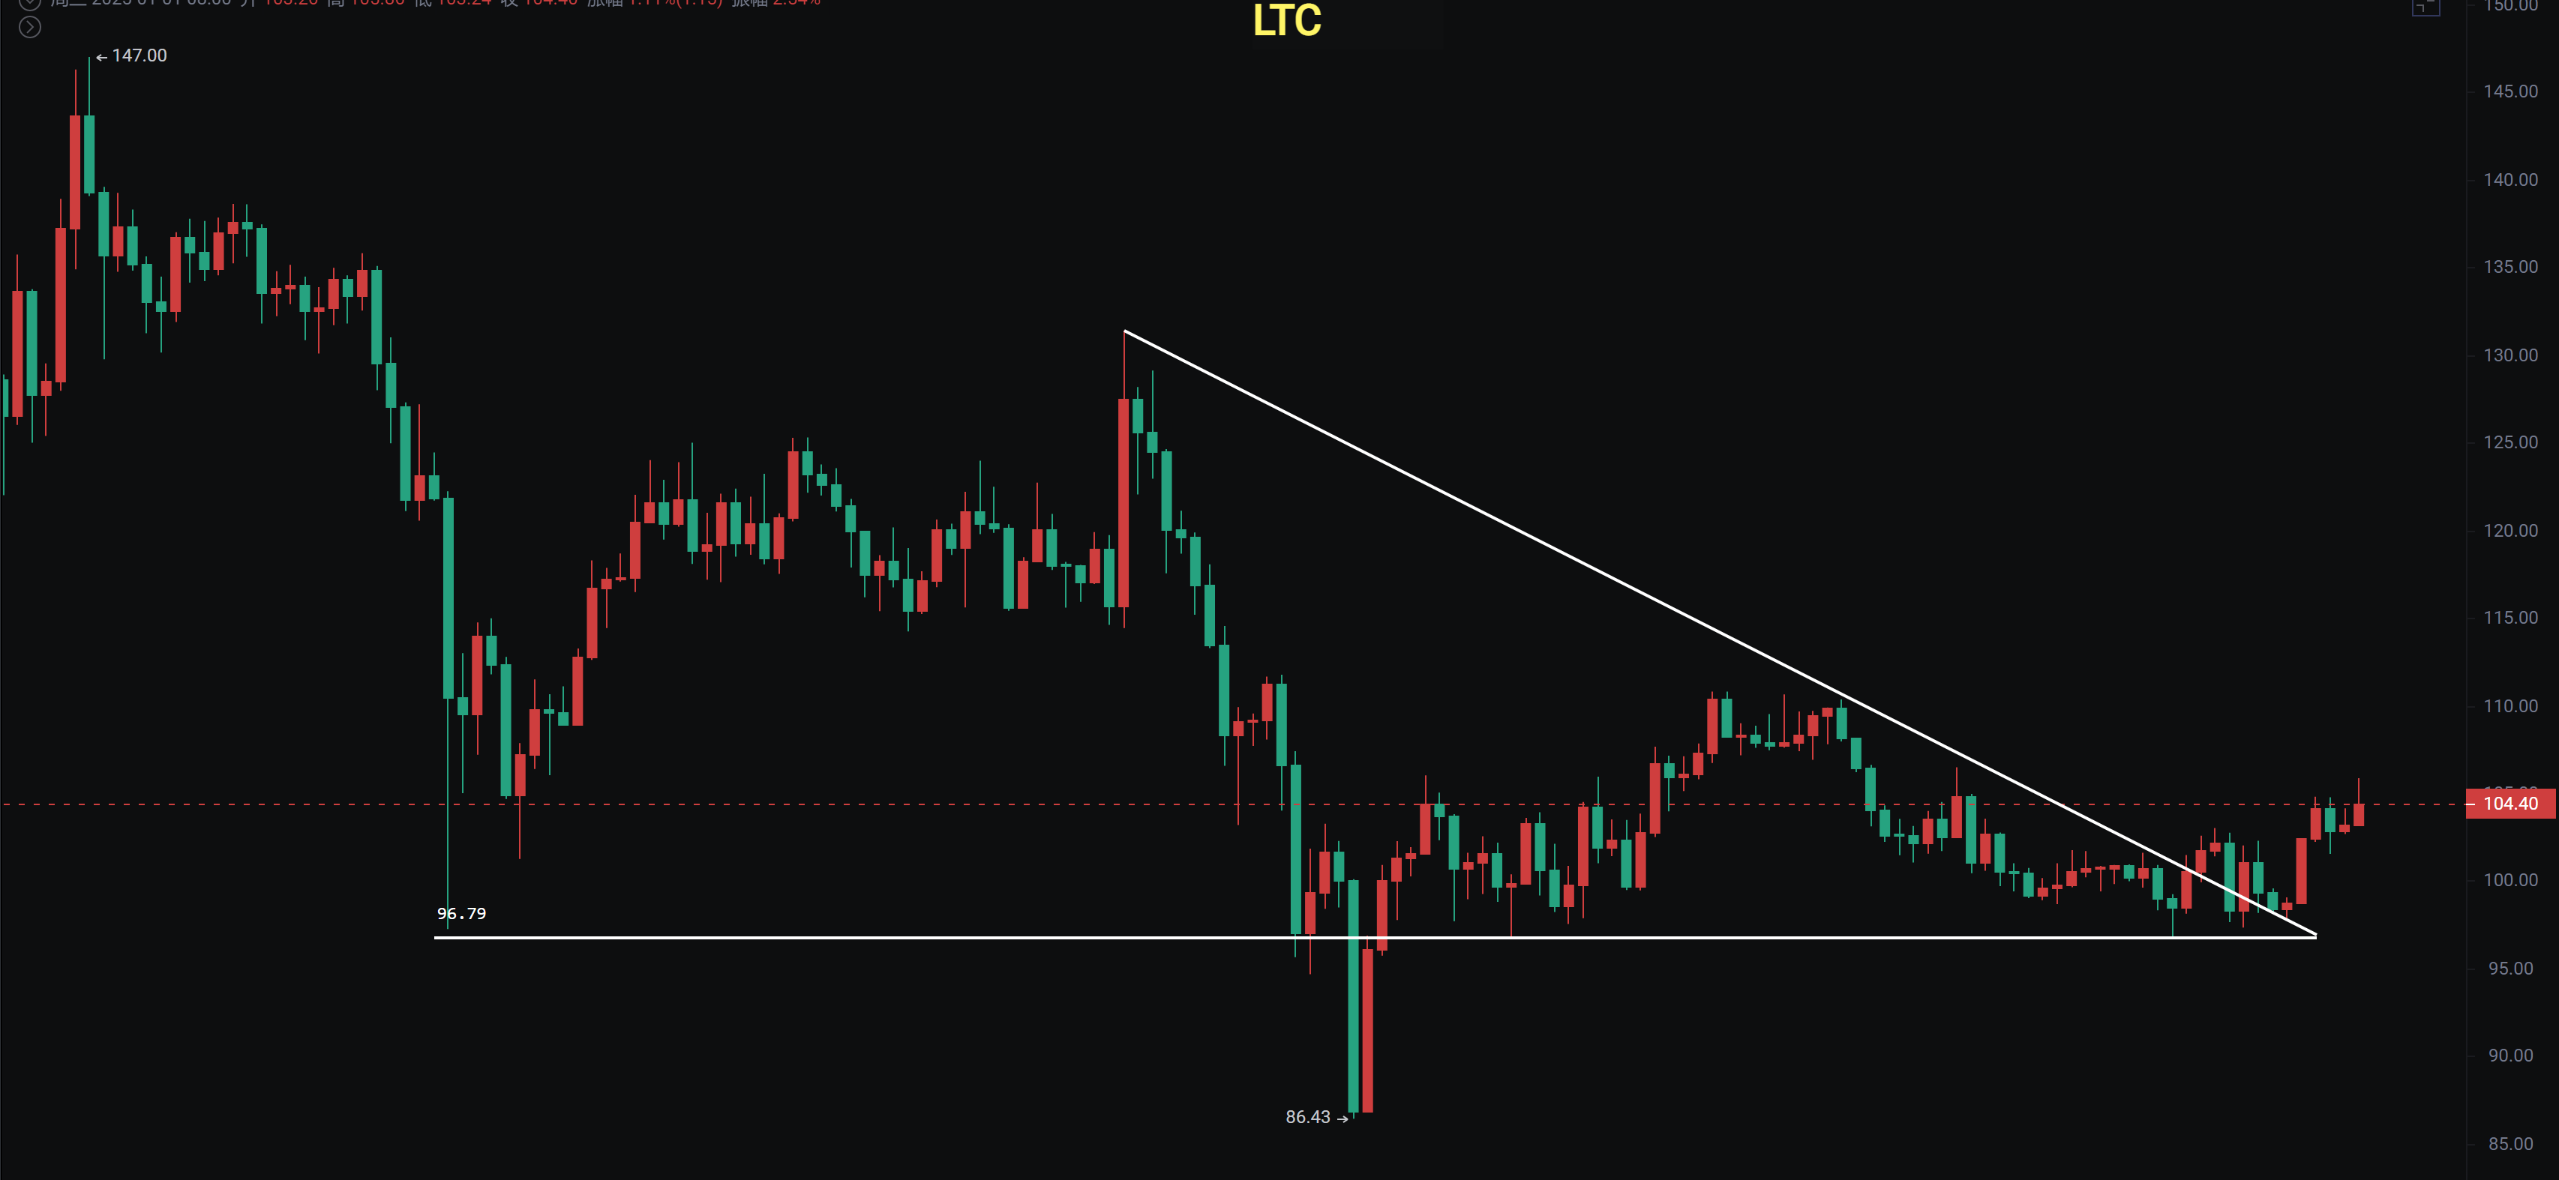
After a low pin at 86, it rebounded and recovered the first pin at 96.87. The 4-hour chart shows a short-term bottom divergence, and if it breaks through without falling below 96.87, it could be a good entry point.

PEPE
Yesterday, Musk's announcement regarding the X name and profile picture featuring Pepe led to a timely reminder, resulting in a 22% increase. We also gained a few points from it and can still hold on. Musk tweeted twice this morning, including frog elements.
If you like my views, please like, comment, and share. Let's navigate through the bull and bear markets together!!!
This article is time-sensitive and for reference only; it is updated in real-time.
Focusing on K-line technical research, we aim to win global investment opportunities. Public account: Trading Prince Fusu

免责声明:本文章仅代表作者个人观点,不代表本平台的立场和观点。本文章仅供信息分享,不构成对任何人的任何投资建议。用户与作者之间的任何争议,与本平台无关。如网页中刊载的文章或图片涉及侵权,请提供相关的权利证明和身份证明发送邮件到support@aicoin.com,本平台相关工作人员将会进行核查。


