Author: Frank, PANews
2024 is destined to be a remarkable year in the development of cryptocurrency. From the official approval of Bitcoin and Ethereum ETFs to former President Trump's proposal to make Bitcoin a national strategic reserve, cryptocurrencies are gradually becoming an internationally recognized emerging asset class. Bitcoin has surpassed the $100,000 mark, while MEME coins on Solana are emerging one after another, causing previously popular projects to fade into the background, resulting in a stark contrast in the crypto market. Behind these changes, public chains remain the core battleground of the crypto market, and all these competitions are reflected in the competition among public chains.
So, from a data perspective, which public chains truly rose in 2024? Which public chains' decline may not be underestimated but rather a genuine fall? PANews conducted a review and summary on this.
Data Explanation: The focus of this review is on the popular Layer 1 and Layer 2 chains, examining dimensions such as annual TVL, token prices, market capitalization, active addresses, and transaction counts from January 1, 2024, to December 29, 2024. Some public chains that launched their mainnet in 2024 used the initial data of their tokens at launch and year-end data. TVL data is sourced from Defillama, daily active and transaction volume data from Tokenterminal and official browsers, and price data from Coingecko.
The public chains reviewed include:
Layer 1: Solana, Ethereum, BNB Chain, Sui, Aptos, TON, Avalanche, Cardano, Hyperliquid, Fantom (Sonic), Tron, Near
Layer 2: Base, Arbitrum, Optimism, zkSync, Polygon, Blast, Scroll, StarkNet, Taiko, Linea.
Layer 1 TVL Average Growth of 7 Times, Hyperliquid and TON with the Highest Increases
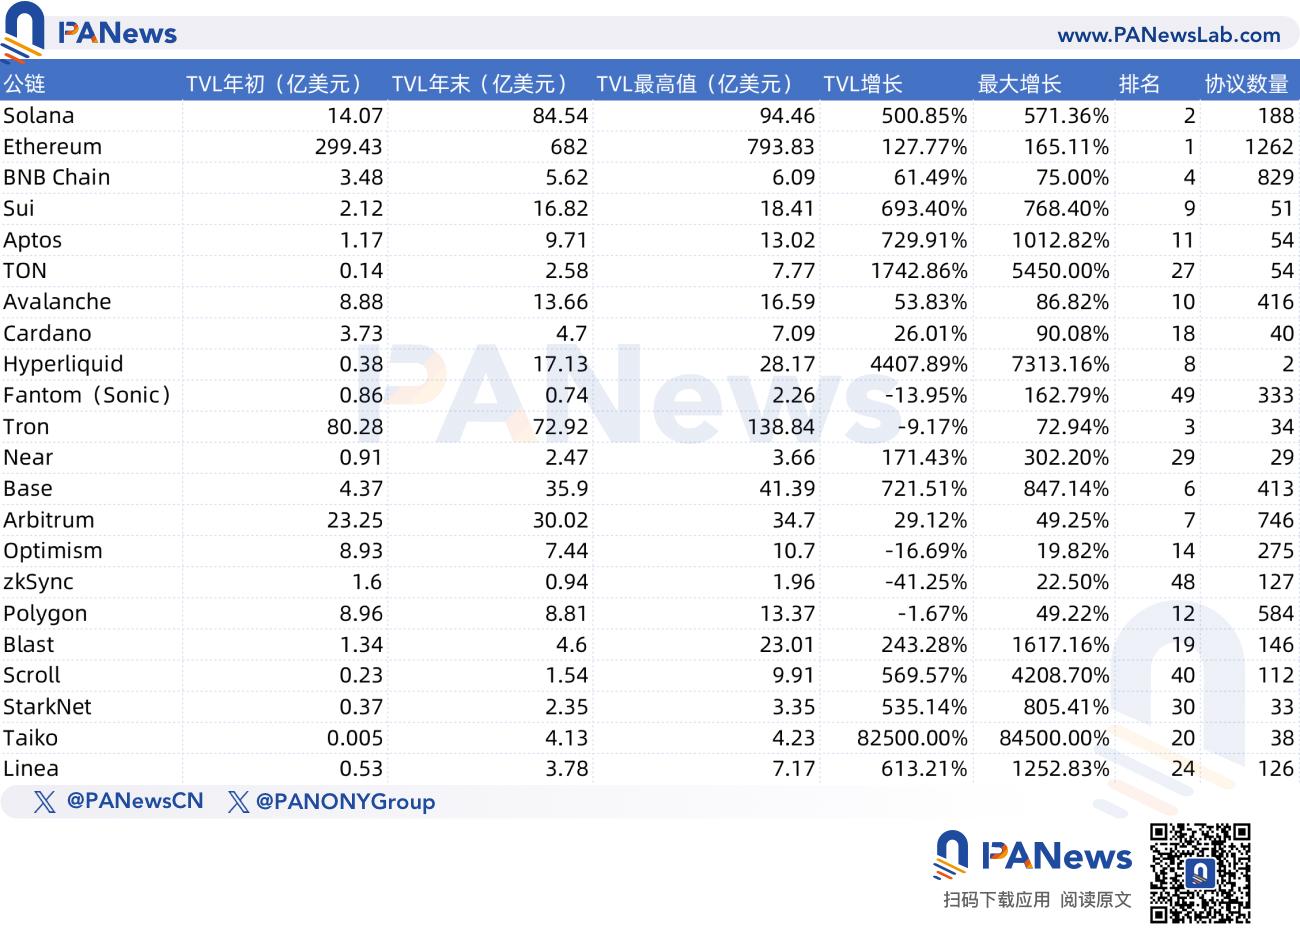
In terms of TVL data, overall, the TVL of the analyzed public chains grew by 117.7% throughout the year. Among them, Layer 1 chains saw an average TVL growth of 707.69% in 2024, while Layer 2 projects had an average TVL growth of 8515.22%. This significant increase is mainly due to the low initial TVL of the Layer 2 chain Taiko, which resulted in an increase factor of 825 times; excluding Taiko, the average growth of other Layer 2 chains this year was 294.69%.
Among Layer 1 chains, the highest TVL growth was seen in Hyperliquid, TON, and Aptos, all exceeding 10 times, with Hyperliquid's TVL increasing by 4407% since its launch. In Layer 2, Taiko and Base were the kings of growth this year, with Taiko's TVL increasing by 82500% from its launch to the end of the year, while Base's TVL grew by approximately 721.51% throughout the year.
In addition to growth, some public chains did not only fail to see significant increases after a year but also experienced a decline. Among them, zkSync saw the most severe drop, with its TVL decreasing by 41.25%, followed by Optimism (-16.69%), Fantom (-13.95%), Tron (-9.17%), and Polygon (-1.67%).
Half of Public Chains Experienced a Decline in Daily Active Users, Solana with the Highest Daily Active Users
In terms of network activity, Hyperliquid, Sui, and TON had the highest increases in daily active addresses in 2024, with increases of 13381.48%, 3350.55%, and 2409.43%, respectively. Besides these three public chains, Base, Aptos, and Solana also saw their daily active data increase by over 10 times throughout the year.
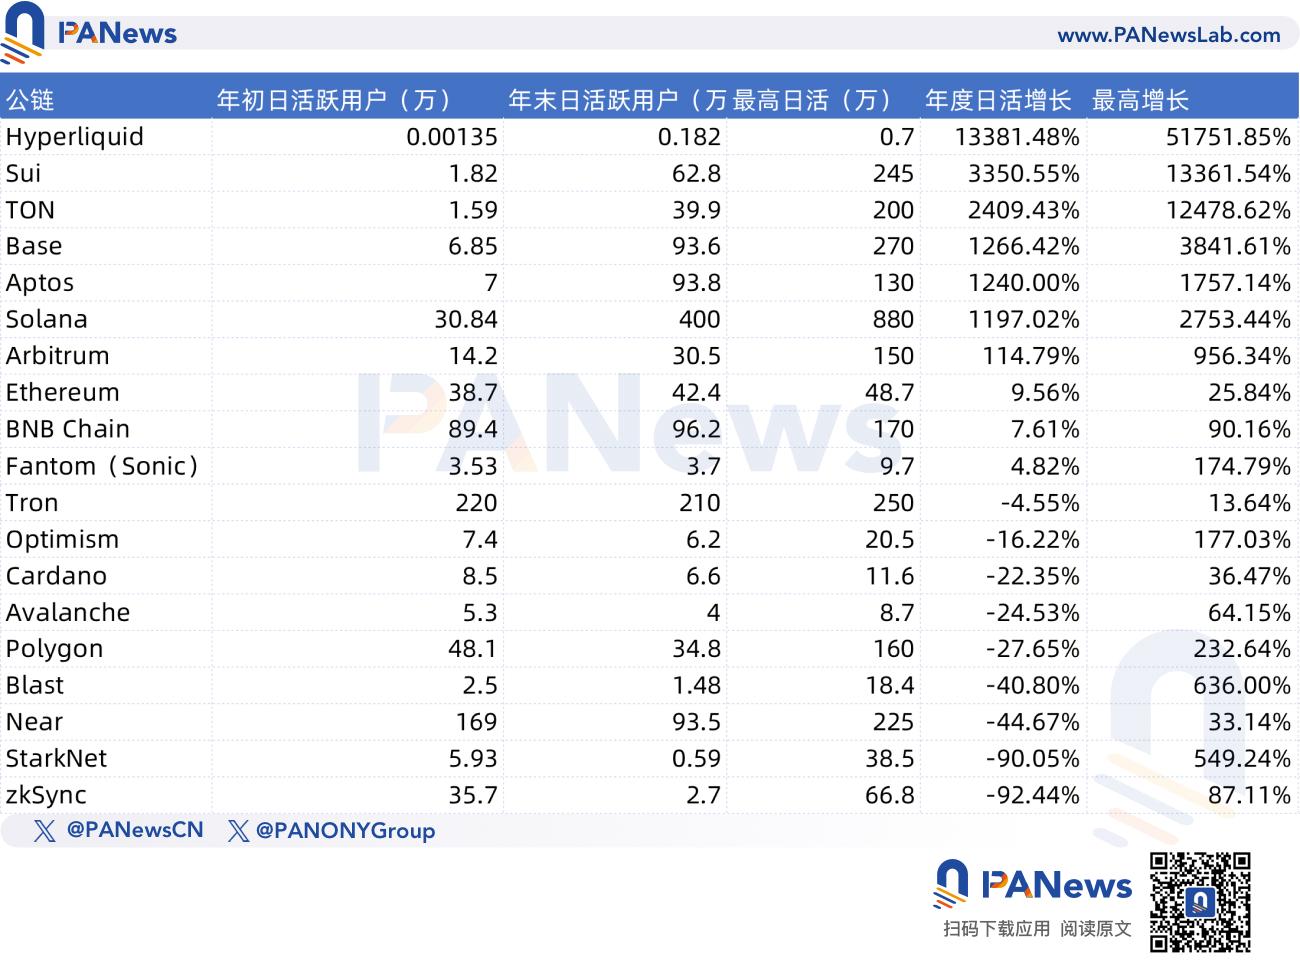
Surprisingly, among the 22 analyzed public chains, 9 chains experienced varying degrees of decline in daily active data this year. Among them, zkSync and StarkNet saw the most severe drops in daily active users, exceeding 90%. Additionally, Near, Blast, Polygon, Avalanche, Cardano, Optimism, and Tron all experienced varying degrees of decline compared to the beginning of the year.
At the beginning of the year, Tron had 2.2 million daily active addresses, ranking first among all public chains. After a year of changes, Solana has become the public chain with the highest daily active addresses, reaching 4 million, and in terms of the highest daily active data recorded, Solana also achieved 8.8 million, making it the public chain with the most users.
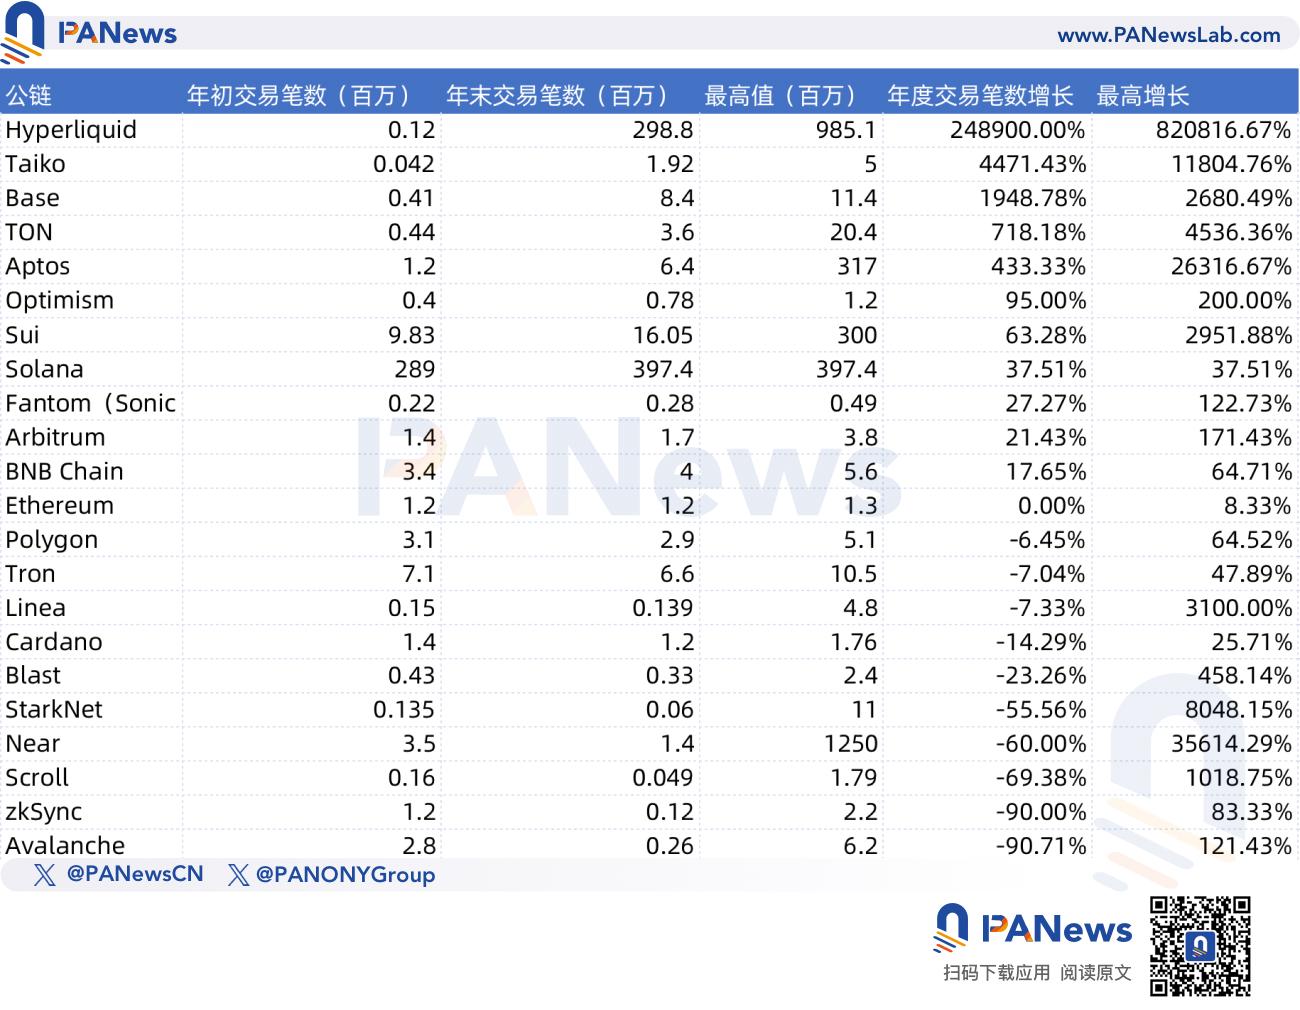
In terms of daily transaction counts, Hyperliquid once again became the public chain with the largest growth, with transaction counts increasing by approximately 248900% throughout the year. Taiko saw a growth of 4471.43%, and Base's transaction counts increased by 1948.78%, all exceeding 10 times. The Avalanche (C-Chain) network experienced the most severe decline in transaction counts, dropping from 2.8 million at the beginning of the year to 260,000, a decrease of 90.71%. However, this decline was primarily due to an abnormal fluctuation in transaction counts at the beginning of the year; excluding this anomaly, Avalanche's daily average transaction counts remained stable at several hundred thousand per day without significant fluctuations.
Additionally, zkSync's decline also reached 90%, and in comparison, zkSync's drop was quite noticeable, as the number of on-chain transactions rapidly fell from millions to just over a hundred thousand per day after the airdrop ended.
Token Price Performance: Mixed Results, HYPE Takes the Lead
While some rejoice, others lament; in terms of token performance, half of the tokens rose and half fell throughout the year. Hyperliquid's token performed the best, with an increase of approximately 1272.30% over the year, peaking at 1648.00%. It became the only public chain token to exceed a 10-fold increase. However, it should be noted that Hyperliquid's token HYPE was only issued at the end of November, which gives it a certain advantage in terms of growth compared to other public chains. Nevertheless, there were also other public chain tokens issued throughout the year, many of which did not see significant increases, and some even experienced declines.
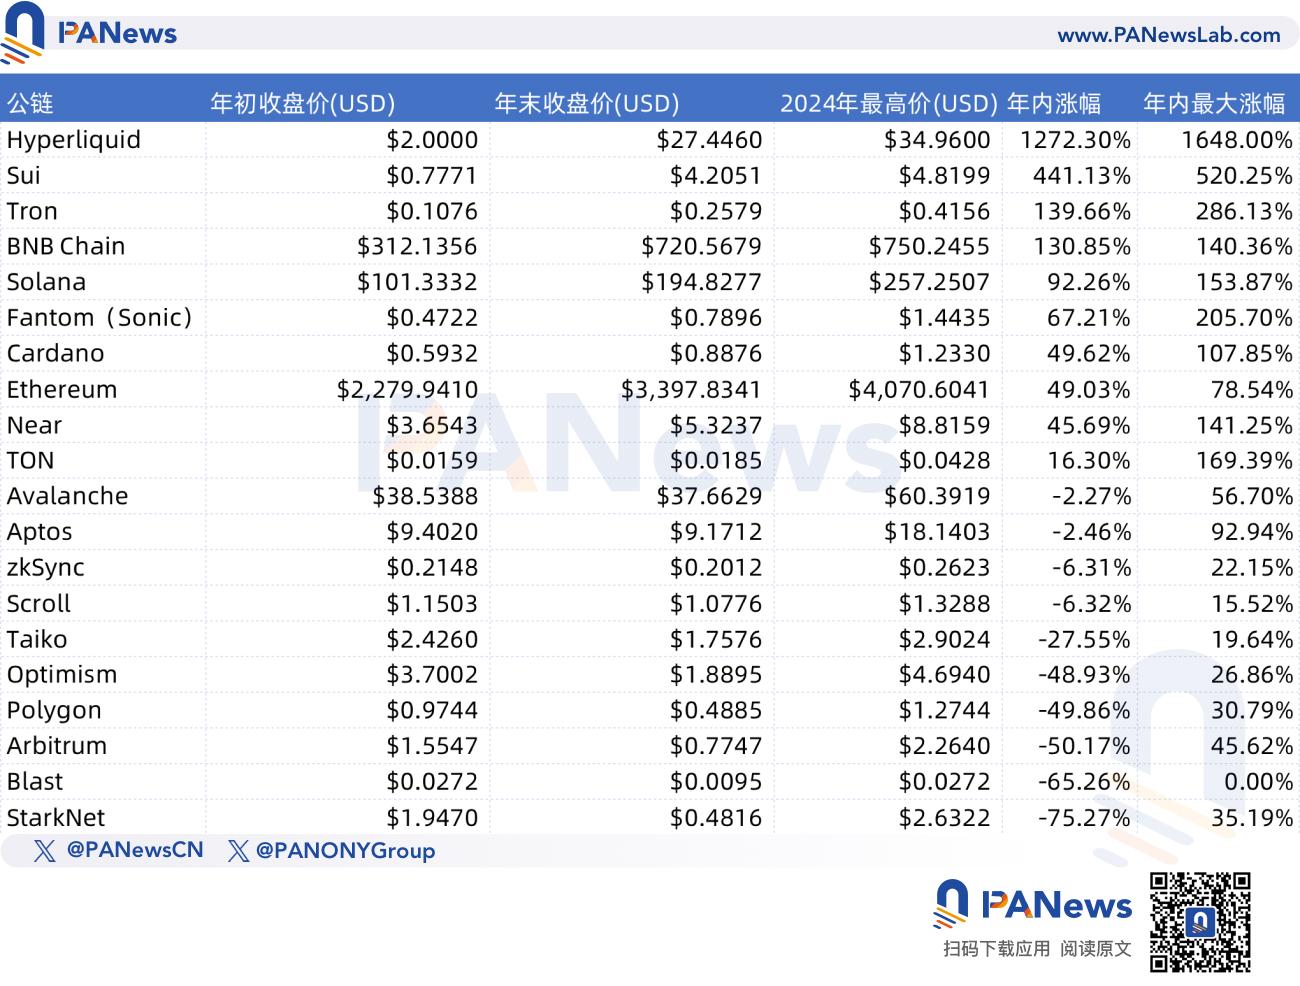
Additionally, other public chains with good token performance include Sui, TON, Tron, and BNB Chain, all of which saw their token prices increase by over 1 time. Solana had high market enthusiasm this year, but in fact, compared to January 1, 2024, its token SOL's price only increased by 92.26%.
Compared to the beginning of the year, 10 public chains saw varying degrees of decline in their token prices. Excluding the two chains that had not issued tokens, Base and Linea, this proportion is exactly 50%. Among the declining tokens, StarkNet and Blast saw the largest drops, reaching 75% and 65%, respectively.
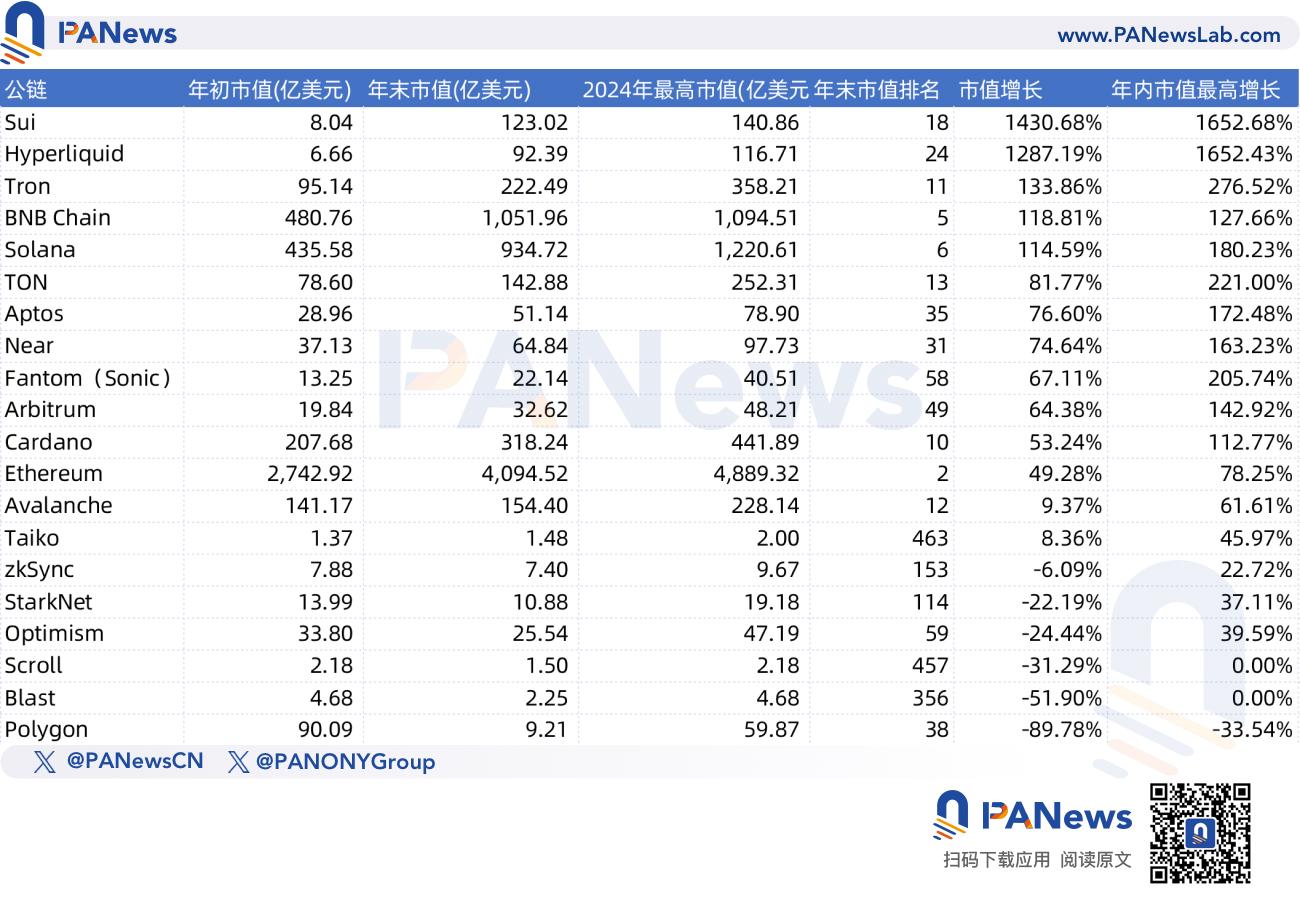
In terms of market capitalization, Ethereum still holds the top position among public chains, with a market cap of approximately $274.2 billion at the beginning of the year, rising to $409.4 billion by the end of the year, marking a growth of about 49.28%. BNB's market cap consistently ranks second, with a slightly higher increase than SOL.
Ethereum's Stability, Solana's Full Throttle
In addition to horizontal comparisons, the development of the following public chains may need to be highlighted separately, described in one sentence as half fireworks, half tranquility.
Solana is an indispensable public chain in 2024. Throughout the year, Solana's data changes have been remarkable, completely emerging from the shadow of FTX's collapse. It not only made significant breakthroughs in scale but also showed momentum to rival Ethereum. Over the past year, Solana has led the MEME trend, becoming the public chain with the most users due to the popularity of MEME.
At the beginning of the year, Solana's TVL ranked fourth, rising to second by the end of the year. Its daily active user count ranked eighth at the beginning of the year, but by the end of the year, it became the public chain with the highest daily active users.
Ethereum, as the elder brother of public chains, seems to have remained calm amidst the excitement of 2024. Many of its data points at the end of the year are not significantly different from those at the beginning of the year, with daily active users increasing by 9% and daily transaction counts remaining nearly flat throughout the year. Only the TVL saw a growth of 127%, and if we exclude the 49% increase in ETH's price itself, this data does not seem to show much real change. The stagnation of TVL in terms of currency value is also a reason for the lackluster performance of the token price.
The main reason for this change may stem from the diversion caused by Layer 2. For Ethereum, whether it can maintain this stable state in the new year or experience more fluctuations may require more innovative content to lead the way.
Sui and Hyperliquid: The Competition Between Rising Stars and Supernovae?
Hyperliquid is undoubtedly the supernova of the public chain space this year, surprising the market with its performance, ranking first in almost all metrics of growth, such as daily active growth, transaction count growth, TVL growth (second place), and token price growth. However, some objective factors need to be considered regarding Hyperliquid's rapid rise: first, it has the shortest birth time, making it the youngest among the analyzed public chains. Second, while the growth rate is high, in terms of overall scale, it still lags far behind public chains like Ethereum or Solana. Especially in terms of active user numbers, Hyperliquid currently has only 286,500 total users, which is still less than Solana's daily active count at the beginning of the year. Other metrics, such as TVL, are approximately $1.7 billion, which is one-fifth of Solana's.
However, Hyperliquid is already approaching Solana in terms of daily transaction counts, ranking second. In terms of market capitalization, it lags behind several public chains that performed far worse this year. From this perspective, Hyperliquid still has immense development potential in 2025, but this growth may require stronger and sustained data support.
Sui is considered a major competitor to Solana in the future, and based on data performance, the Sui network has also shown impressive results this year. Its TVL increased nearly sevenfold, daily active users grew by 33.5 times, and the highest single-day transaction count exceeded 300 million. The token price is also among the highest increases for public chains, rising approximately 441.13% over the year, with the maximum increase surpassing 520.25%. In terms of growth rate, Sui has already outpaced Solana in certain areas in 2024, but it now faces another challenge from projects like Hyperliquid and Aptos catching up. Whether the Sui ecosystem can explode in 2025 may require finding some new breakout points.
In addition to the aforementioned representative public chains, other chains are also unwilling to remain stagnant in 2024. Some are transforming towards AI, represented by Near, while others are upgrading their brand by launching new public chains, such as Fantom rebranding to Sonic. Furthermore, in the Layer 2 space, 2024 has been one of the hottest narratives for public chains. This year, several star Layer 2 projects issued airdrops but generally performed poorly on-chain. The best performer has been Base, a Layer 2 that currently has no token plans. Additionally, Taiko is another Layer 2 with low market enthusiasm but decent on-chain performance; however, its overall data volume is still not large, and its future development remains to be seen.
Finally, when comparing the relationships between the various data points of these 22 public chains, it can be observed that the tokens with the largest increases in 2024 are generally from the public chains with the best growth in active users. From this perspective, perhaps the most important indicator for the development of public chains is still the user base. For investors, how to assess the future expectations of a project may also be hidden beneath these simple data points.
免责声明:本文章仅代表作者个人观点,不代表本平台的立场和观点。本文章仅供信息分享,不构成对任何人的任何投资建议。用户与作者之间的任何争议,与本平台无关。如网页中刊载的文章或图片涉及侵权,请提供相关的权利证明和身份证明发送邮件到support@aicoin.com,本平台相关工作人员将会进行核查。


