Pionex: Latest Bitcoin Market Analysis on 1.1
Article Published on 2025.1.1—03:00
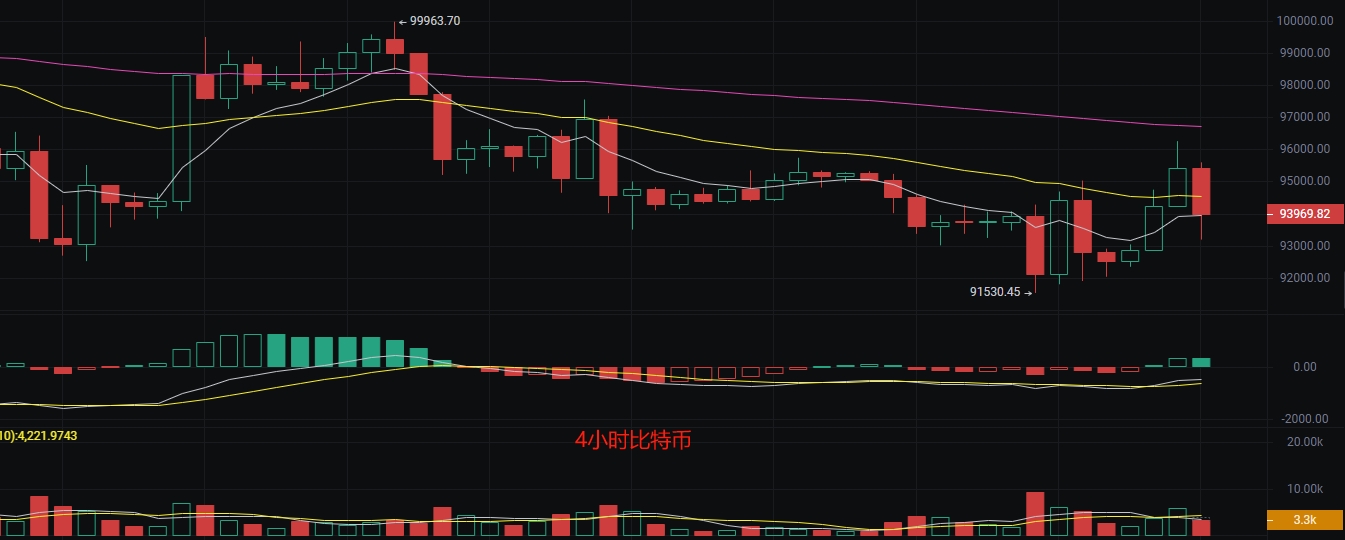
The current price of Bitcoin is 94,000. In yesterday's article, I mentioned entering the market at around 91,700. Such real-time data is rarely disclosed in articles, but this wave of market movement is too obvious. Although I had my doubts, I still shared it, and ultimately, I took profits at 95,500, gaining a space of 3,900 points. How much did you earn? Before this article was published, I chose a short target at 96,000, first looking to see if it can reach 93,000. If it breaks the pressure level of 95,000, I will also consider exiting.

Currently, the K-line pattern in the market is fluctuating between 94,000 and 96,000, forming a consolidation pattern. This is a good opportunity for capturing swings. The market shows strong selling pressure and support, while the technical indicator MACD is gradually shortening, which may indicate a weakening of bearish strength, with a trend of short-term bullish momentum. The relative strength index (RSI) does not show any significant overbought or oversold signals. The trend indicator EMA has support and pressure from EMA30 and EMA120 below, and the peak trading volume is accompanied by significant price fluctuations, indicating intense market sentiment. Therefore, I will not hold short positions for too long; after testing the bottom, I will consider going long.
Today's Predicted Levels
- Long Entry: 93,000, add at 92,000, stop at 91,500, target 95,500
- Short Entry: 95,000, add at 96,000, stop at 96,500, target 93,500
Pionex: Latest Ethereum Market Analysis on 1.1
Article Published on 2025.1.1—03:00
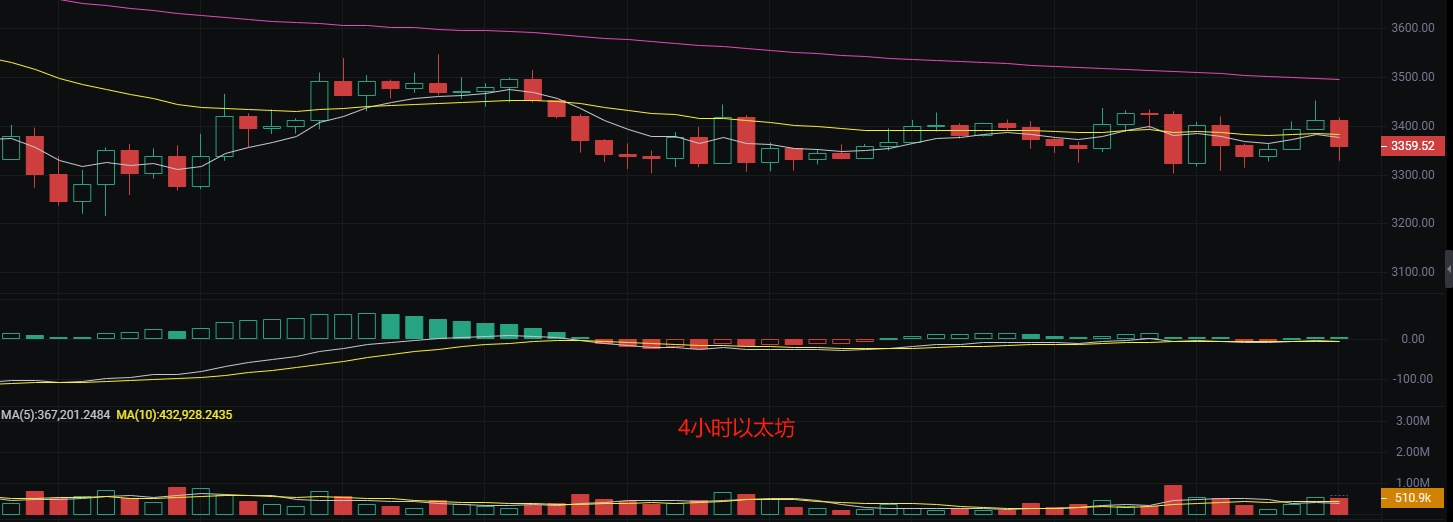
The current price of Ethereum is 3,360. In yesterday's article, I mentioned entering the market at the support level of 3,300, and I took profits at 3,420. I had a short position set at 3,450, which was unexpectedly triggered. Currently, I am holding to see if the support at 3,300 can hold. The overall trend in the market indicates that the range is still continuing. Prior to this, I have successfully captured swings seven times, yielding substantial profits.

Ethereum's current K-line pattern is fluctuating around 3,400, showing multiple upper and lower shadows, indicating significant market divergence. The previous high of 3,452 and the low of 3,302 have formed a short-term consolidation range, which is a good position for swing trading. The technical indicator MACD shows a weakening of bearish strength, potentially turning bullish. The RSI14 has not entered the overbought or oversold zones, so we need to pay attention to subsequent changes. The trend indicator EMA has a suppressive effect from the short-term moving averages, but the long-term trend remains bullish. My strategy is to take short positions in the short term and long positions in the long term, focusing on accumulating long positions on pullbacks, with shorts as a supplement.
Today's Latest Level References
- Long Entry: 3,300, add at 3,250, stop at 3,200, target 3,400
- Short Entry: 3,400, add at 3,450, stop at 3,500, target 3,300
The above analysis is based on market data and trend analysis and does not constitute investment advice. It is for reference only. Over the past ten years, I have continuously explored and experienced hundreds of different digital assets. Throughout this process, I have witnessed the brilliance of bull markets and the gloom of bear markets, accumulating countless valuable experiences and profound lessons. As a female trader striving in this challenging field, I feel a responsibility to share my insights, hoping to help others with dreams find their place in this unpredictable market and embark on their own successful journey.

The content of this article is time-sensitive and for reference only; risks are borne by the reader.
免责声明:本文章仅代表作者个人观点,不代表本平台的立场和观点。本文章仅供信息分享,不构成对任何人的任何投资建议。用户与作者之间的任何争议,与本平台无关。如网页中刊载的文章或图片涉及侵权,请提供相关的权利证明和身份证明发送邮件到support@aicoin.com,本平台相关工作人员将会进行核查。


