On the last day of 2024, everyone is looking forward to welcoming 2025 with renewed energy, but it seems that Bitcoin does not share this sentiment. According to AICoin chart data, we will conduct a technical analysis of Bitcoin's market.
Long-term Analysis
Pattern Judgment:
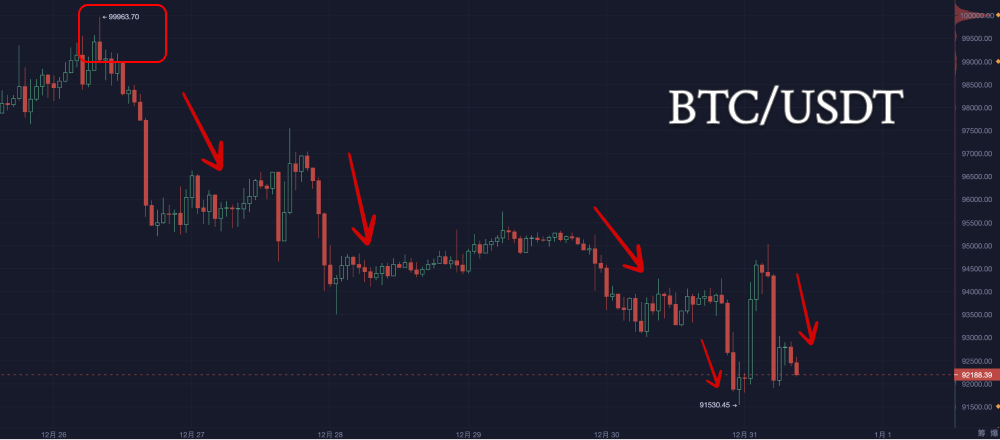
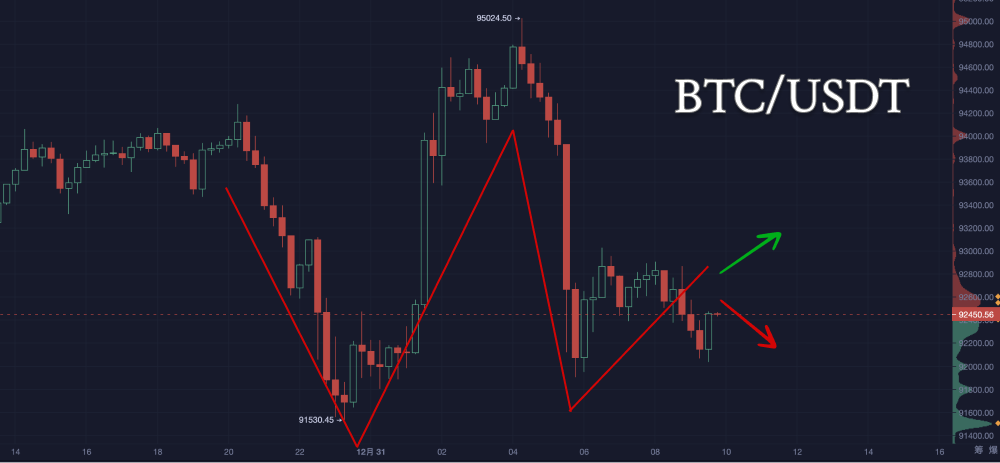
Top Reversal Trend: A significant high point appeared at 99963.70, followed by a sharp decline in price, indicating the formation of a top reversal trend.
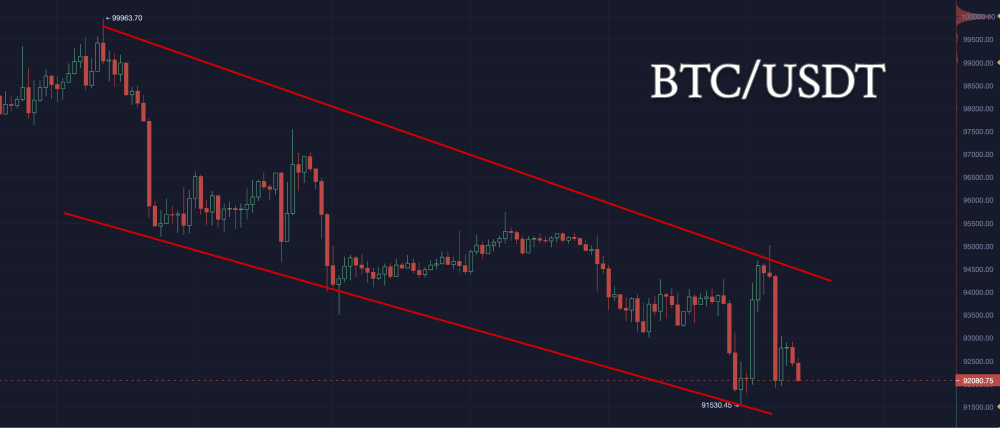
Descending Channel: The price is fluctuating within a descending channel, showing downward pressure.
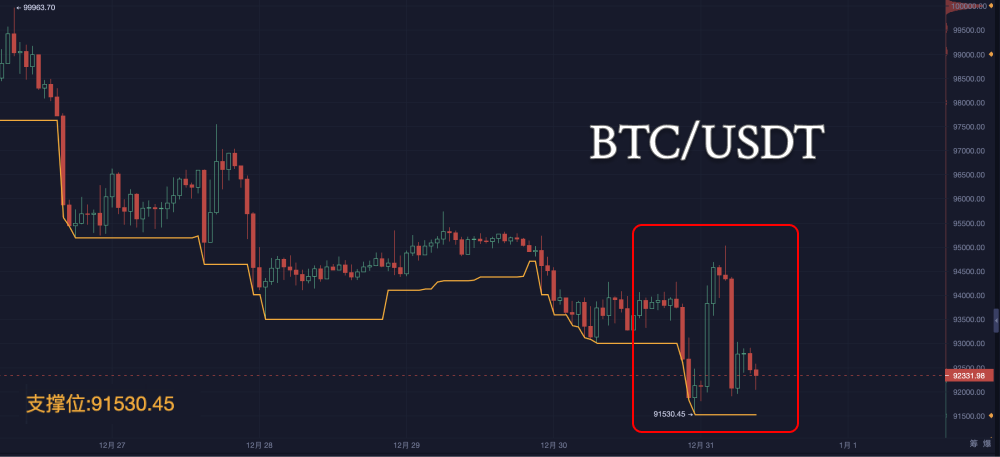
Support Area: The price has repeatedly stopped falling near 91530.45, forming a long-term key support level.
Volume and Trend Relationship:
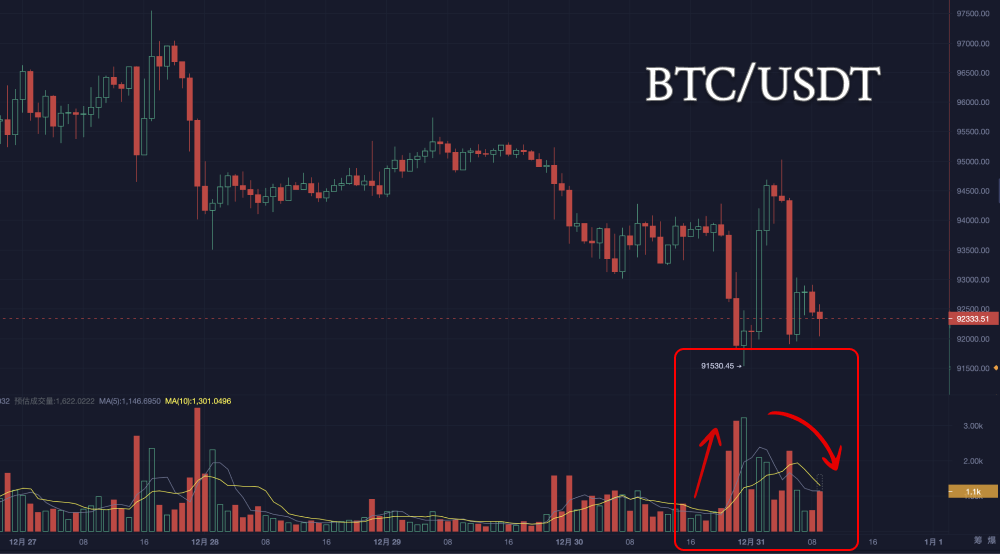
When near the support level of 91530, the trading volume increased, indicating bulls attempting to resist.
During the decline, the volume increased, while it decreased during rebounds, indicating that bears dominate the market.
Short-term Analysis
Pattern Judgment:
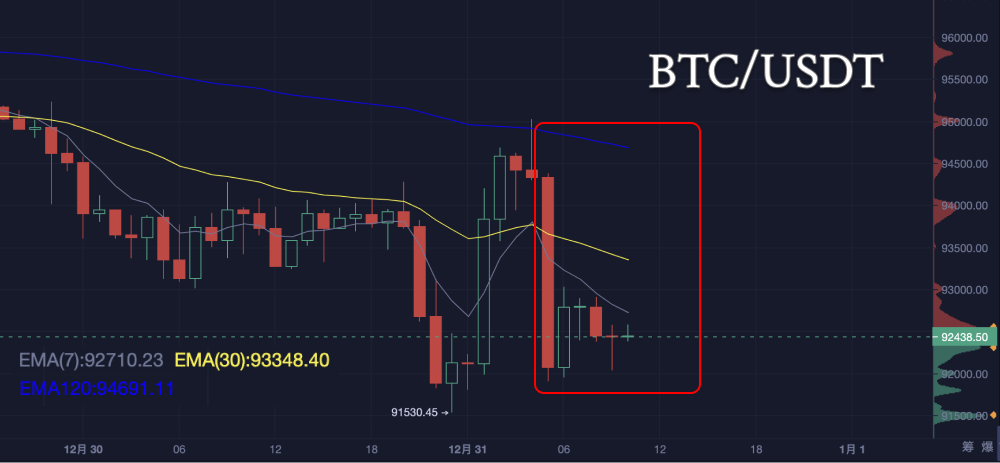
Double Bottom Pattern Emerging: In the short term, the price has tested the 91530 support twice without breaking it, forming a short-term double bottom pattern.
Alternating Bullish and Bearish Fluctuations: In the range of 92417.67 to 93000, the K-line alternates between bullish and bearish, indicating intense short-term market competition.
Recently, the price has fluctuated significantly, with multiple instances of sharp rises and falls. The recent K-lines show long lower shadows, indicating some buying support at lower levels.
Resistance and Support Levels:
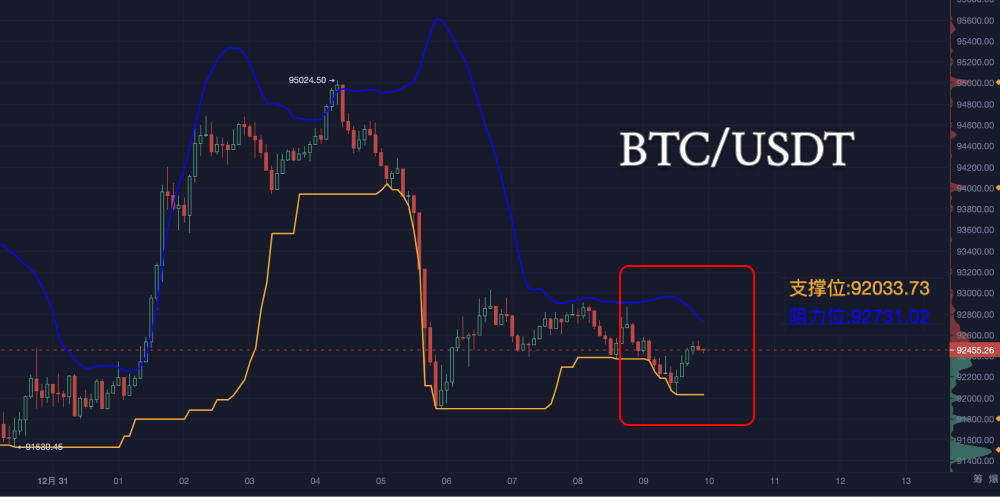
Resistance Level: 92731.02 is a key resistance for short-term upward movement; breaking through may test the 93000 level.
Support Level: 92000 is an important short-term support; if broken, it may trigger further declines below 91000.
Technical Indicator Analysis:
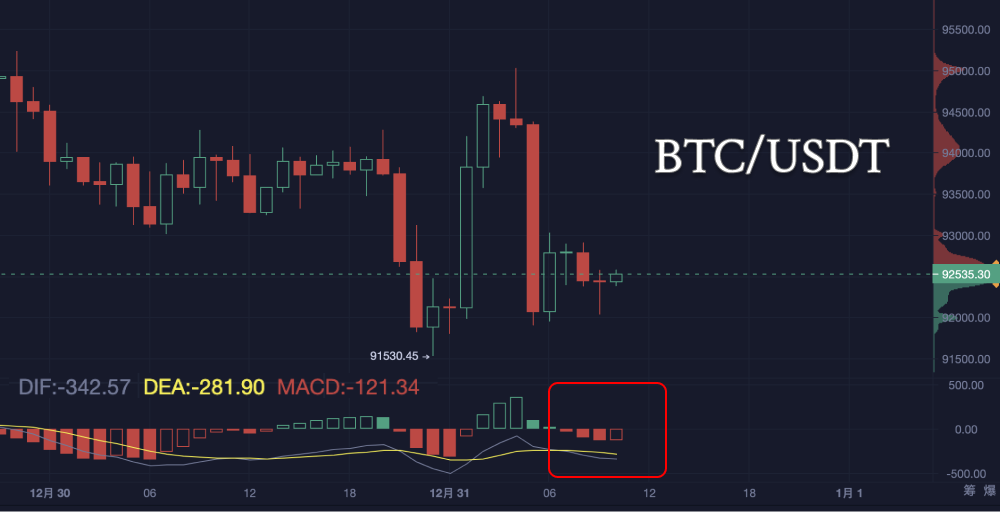
MACD: The current MACD is in the negative zone, but the DIF and DEA are gradually converging, indicating a potential golden cross, which may lead to a rebound in the short term.
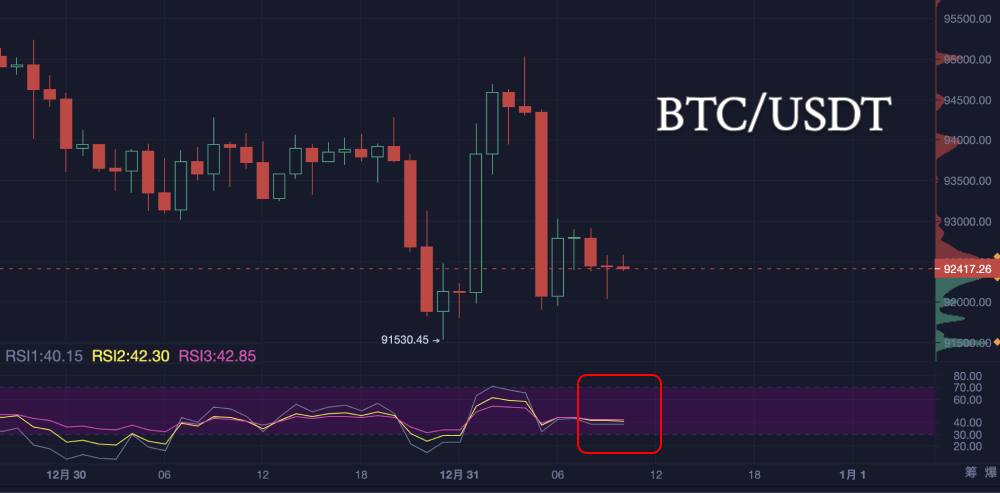
RSI: The RSI is currently around 42, not entering the oversold zone, indicating a neutral market sentiment.
EMA: The price is currently below EMA7 (92696.3) and far below EMA30 (93319.6) and EMA120 (94655.5), indicating that the overall trend remains bearish.
Today's Trend Prediction
Short-term Fluctuations:
If the price breaks through 92417.67 in the morning, the short-term target will be 93000; if the bulls continue to exert strength, it may test 93500.
If it fails to break through 92417.67, the price may again pull back to around 91530.
Key Levels:
91530: A critical point for support strength; breaking below may accelerate the decline.
92731.02: A short-term resistance level for upward movement; breaking through may lead to a rebound phase.
Risk Warning:
If the price repeatedly fails to break through 92731.02, be cautious of downward risks.
After breaking 93500, market sentiment may turn bullish, suggesting a flexible adjustment of strategies.
Trading Strategy Suggestions
Short-term Trading:
After breaking 92731.02, consider taking a small long position with a target of 93000, setting a stop loss below 92000.
If it breaks below 91530, consider a short position with a target of 91000, setting a stop loss above 91800.
Medium to Long-term Trading:
If the price breaks through 93500 with increased volume, consider establishing a medium-term long position.
If the rebound is weak and breaks below 91530 again, it is advisable to wait and confirm new support.
The above content is for reference only and does not constitute investment advice.
AICoin Official Website: www.aicoin.com
Telegram: t.me/aicoincn
Twitter: x.com/AICoincom
Email: support@aicoin.com
Group Chat: Customer Service Yingying、Customer Service KK
免责声明:本文章仅代表作者个人观点,不代表本平台的立场和观点。本文章仅供信息分享,不构成对任何人的任何投资建议。用户与作者之间的任何争议,与本平台无关。如网页中刊载的文章或图片涉及侵权,请提供相关的权利证明和身份证明发送邮件到support@aicoin.com,本平台相关工作人员将会进行核查。


