Pionex: Bitcoin 12.31 Latest Market Analysis
Article Published on 2024.12.31—01:00
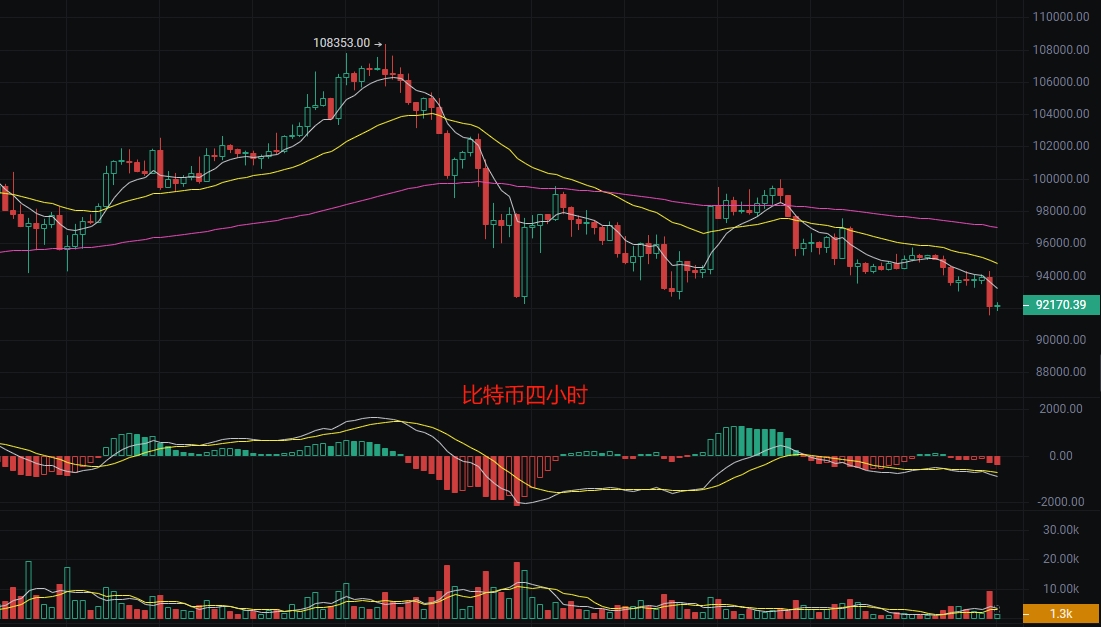
The current price of Bitcoin is 92,000. The bears have finally arrived as expected. I did not catch this wave of bearishness; I usually choose to wait for opportunities in a market of chasing highs and cutting losses. This wave of bottoming out is our opportunity. Entering long at 91,700 made me a bit hesitant, so I chose to defend at 90,500. If it breaks below 90,000, I will choose to exit.

Looking at the current market, the K-line pattern shows a trend of oscillating downward, with two consecutive days of long lower shadows, indicating some support below. Since the support at 91,500 is effective, there is no need to hesitate. The technical indicator MACD shows that bearish strength is dominant, but the recent K-line histogram has shortened, so I judge that a rebound may occur. The Relative Strength Index (RSI) also indicates a technical rebound demand. The trend indicator EMA shows an overall bearish trend, and a short-term bearish situation is set, so the bullish target should focus on whether the pressure around 95,000 is strong enough.
Today's Point Forecast
- Long Entry: 91,500, Add Long: 90,500, Stop Loss: 89,500, Target: 94,500
- Short Entry: 94,500, Add Short: 95,500, Stop Loss: 96,000, Target: 92,000
Pionex: 12.31 Ethereum Latest Market Analysis
Article Published on 2024.12.31—01:00
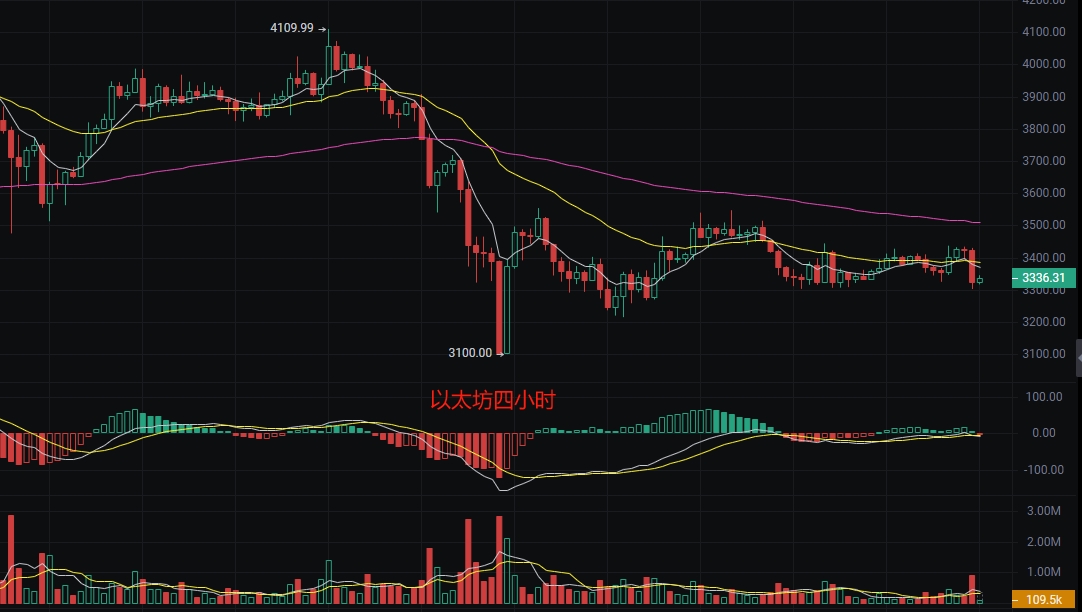
The current price of Ethereum is 3,340. I entered at 3,300, but it is still uncertain whether I can take profits later. For now, I can only choose to hold patiently. Currently, the K-line pattern is fluctuating within the range of 3,300 to 3,400, showing an overall oscillating trend. The market has strong selling pressure and support, so I chose to enter long at the support point.

The technical indicator MACD histogram shows certain signs of rebound, and there may be a short-term pullback. Additionally, the RSI has not entered the overbought or oversold zones, and the trend is not obvious. The trend indicator EMA indicates that the medium to long-term trend is still downward, and the overall trend leans towards oscillation, suggesting a range-bound market. This is a suitable time for swing trading, maintaining the strategy of shorting at highs and longing at lows.
Today's Latest Point Reference
- Long Entry: 3,300, Add Long: 3,250, Stop Loss: 3,200, Target: 3,400
- Short Entry: 3,400, Add Short: 3,450, Stop Loss: 3,500, Target: 3,300
The above analysis is based on market data and trend analysis and does not constitute investment advice. It is for reference only. Over the past ten years, I have continuously explored and experienced hundreds of different digital assets. Throughout this process, I have witnessed the brilliance of bull markets and the gloom of bear markets, accumulating countless valuable experiences and profound lessons along the way. As a female trader striving in this challenging field, I feel a responsibility to share my insights, hoping to help others with dreams find their place in this unpredictable market and embark on their own successful journey.

The content of this article is time-sensitive and for reference only; risks are borne by the reader.
免责声明:本文章仅代表作者个人观点,不代表本平台的立场和观点。本文章仅供信息分享,不构成对任何人的任何投资建议。用户与作者之间的任何争议,与本平台无关。如网页中刊载的文章或图片涉及侵权,请提供相关的权利证明和身份证明发送邮件到support@aicoin.com,本平台相关工作人员将会进行核查。


