On the last Monday of 2024, how will Bitcoin face the new year?
Based on AICoin data charts, the following analysis will be conducted from both long-term and short-term perspectives, incorporating pattern theory and technical indicators.
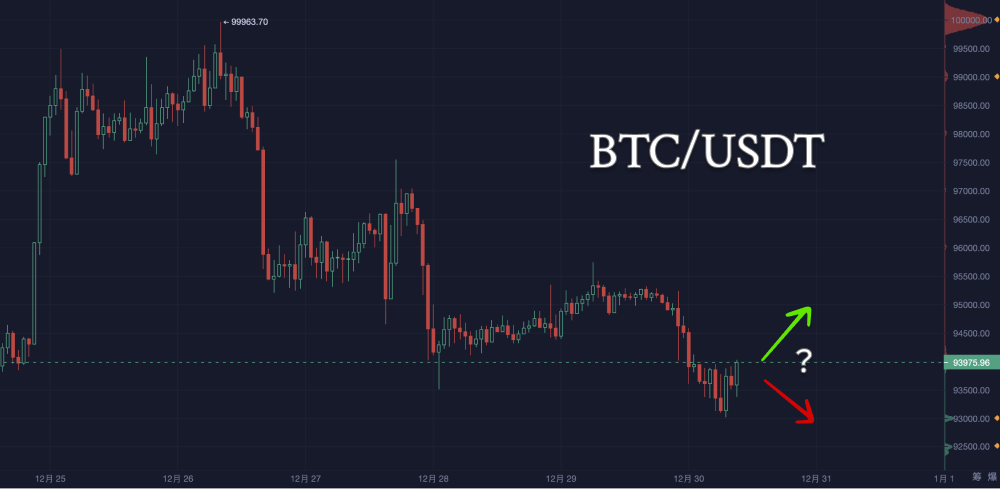
1. Long-term Analysis
Trend Analysis
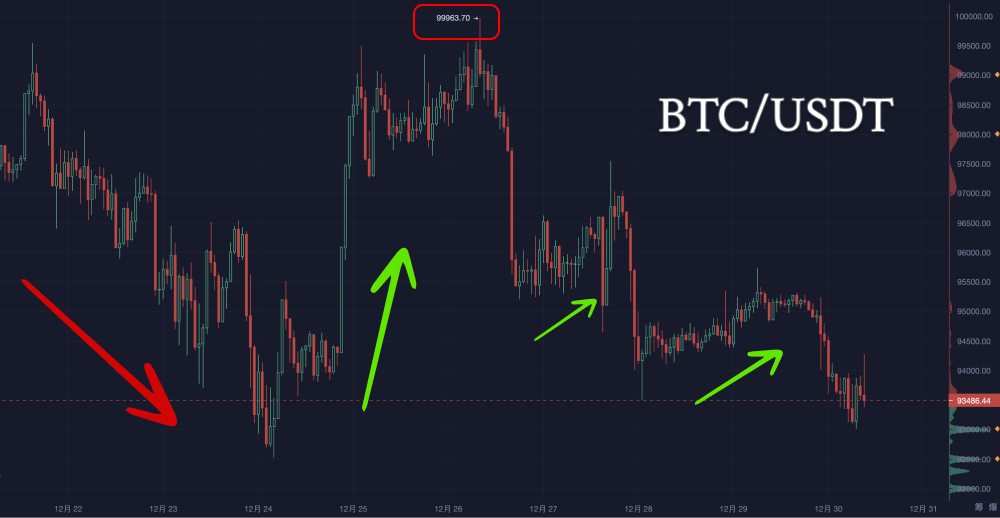
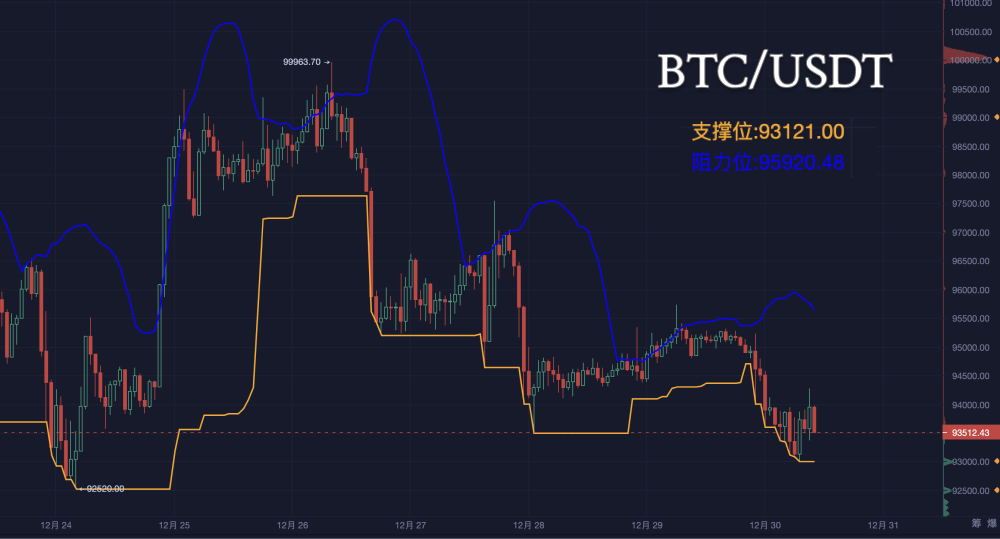
Since December 22, the price has shown an overall downward trend.
Despite several rebounds during this period (such as on December 24, December 26, and December 27), these rebounds failed to break through previous highs, indicating that bears still dominate.
Pattern Analysis
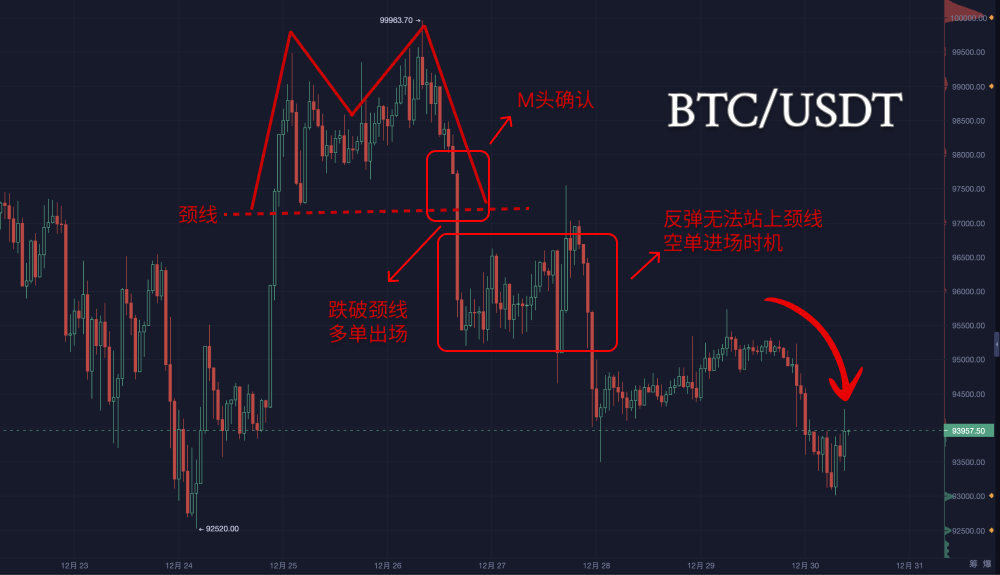
M Head Pattern (Double Top Pattern)
- Between December 25 and December 27, the price peaked twice around 100,000 before retreating, forming a clear double top structure.
- Neckline position: Around 95,000, the price broke below this level on December 27, confirming the formation.
- Subsequent trend: After the pattern completion, the price continued to decline, consistent with the typical downward characteristics following an M head pattern.
Descending Channel
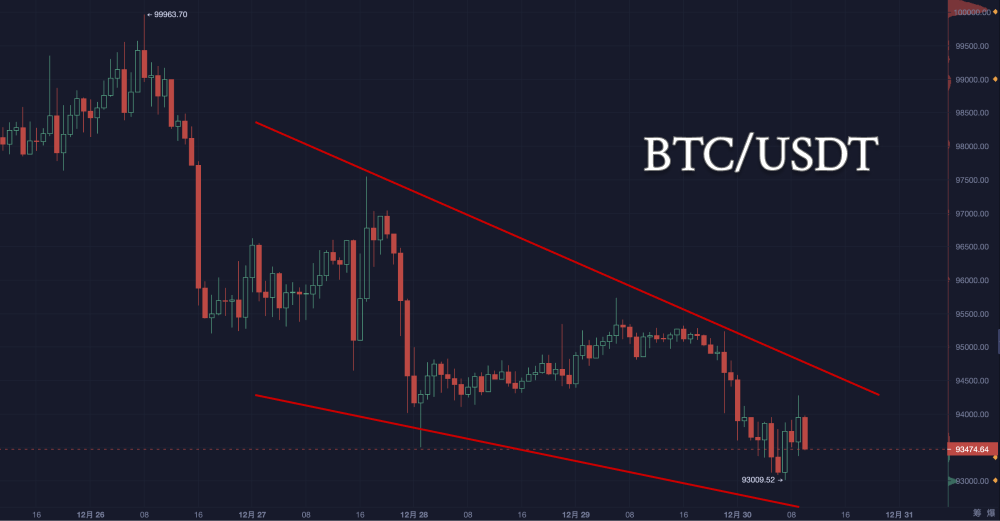
- Since December 27, the price has been within a gradually lowering high and low channel.
- Upper resistance line: Each rebound has failed to break through the upper edge of the channel, indicating significant bearish pressure.
- Lower support line: The current price is close to the lower edge of the channel, which may provide temporary support.
Long-term Support and Resistance
- Important support: 93,000: A key short-term support level; if broken, it will further test 92,500.
- Important resistance: 96,000: If a rebound occurs, this will be a significant resistance level; a breakthrough could lead to 97,500.
2. Short-term Analysis
Candlestick Pattern
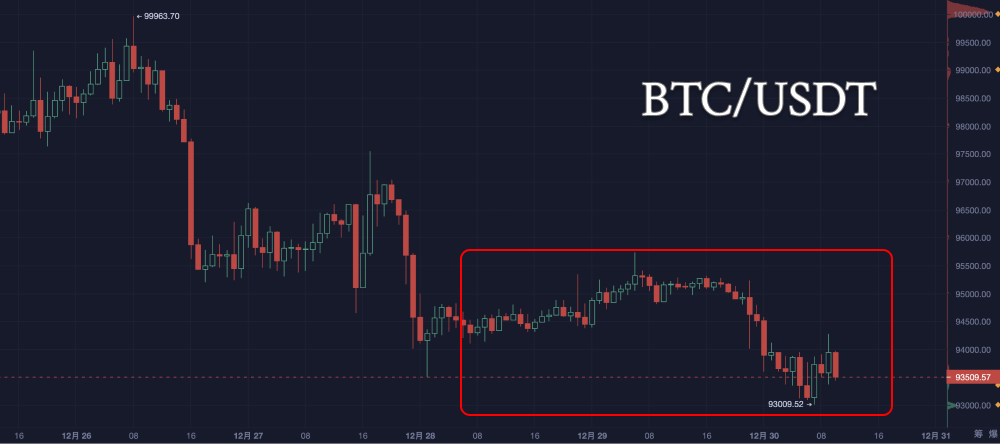
- Downtrend - rebound - further decline: Recently (from December 28 to 30), the price has experienced another round of decline, forming a low-level consolidation pattern.
- The current candlestick is relatively short, indicating increased market wait-and-see sentiment, with both bulls and bears temporarily balanced.
Volume Analysis
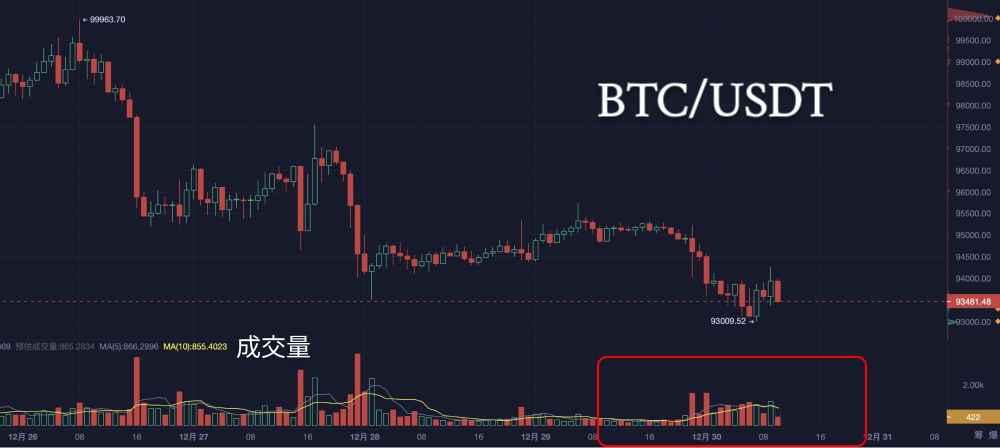
- The volume histogram shows: The decline has been accompanied by increased volume, indicating market funds recognize the bearish direction.
- During the current low-level consolidation, volume is gradually decreasing, suggesting rising wait-and-see sentiment.
Technical Indicators
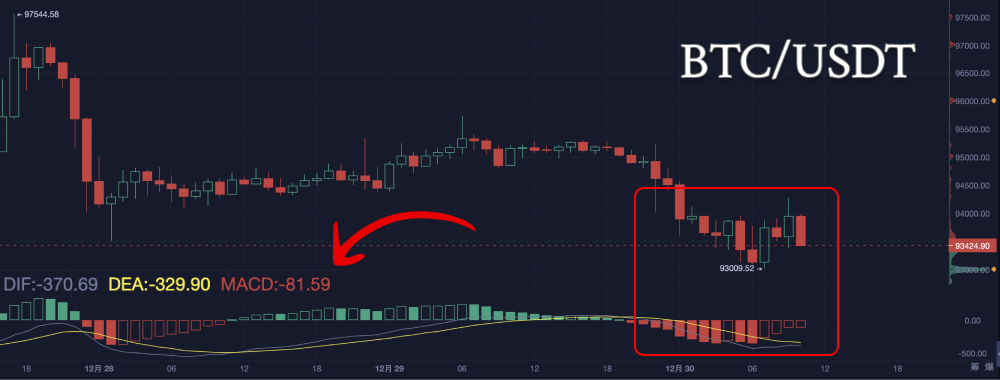
MACD: The hourly MACD is below the zero line, with both DIF and DEA diverging downwards, indicating dominant bearish strength. The daily MACD is also below the zero line, with DIF and DEA continuing to decline, further confirming the bearish trend.
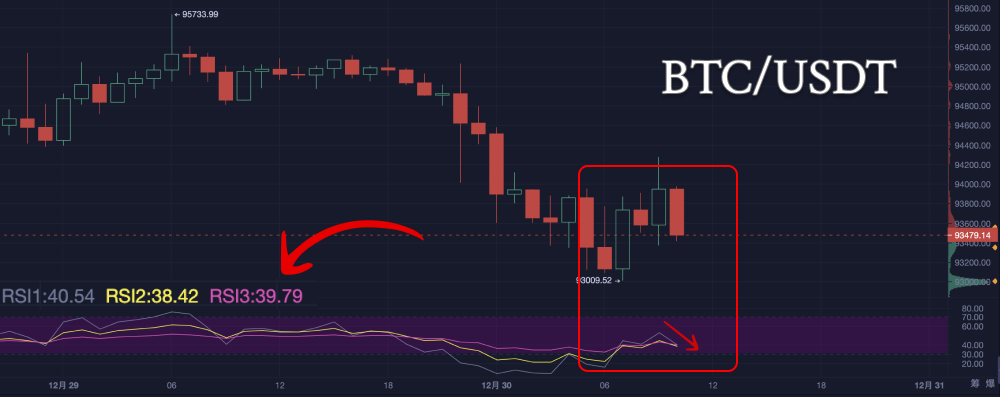
RSI: The hourly RSI hovers between 30-40, approaching the oversold area, but no significant rebound signs are observed. The daily RSI is around 40, also indicating a weak state.
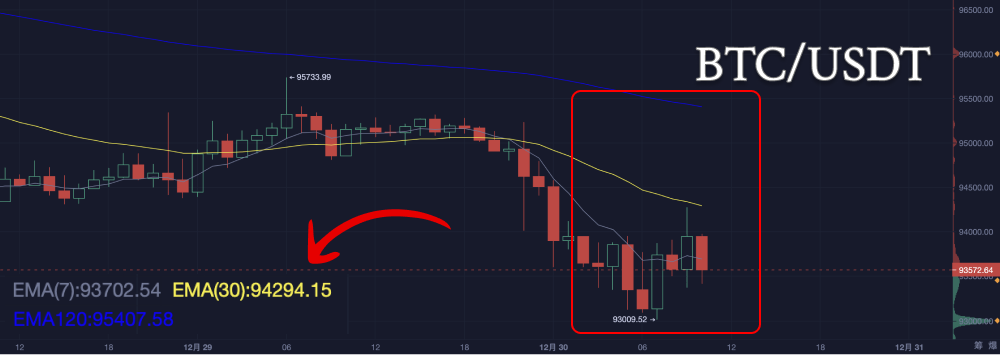
EMA: The hourly EMA7, EMA30, and EMA120 are all in a bearish arrangement, with short-term moving averages below long-term moving averages, indicating that the current market remains bearish. The daily EMA also shows a bearish arrangement.
3. Today's Trend Prediction
Combining long-term and short-term analyses, today's trend may have two main scenarios:
Scenario 1: Continued Decline (Higher Probability)
- Trigger Condition: If the price breaks below 93,500 (key support level).
- Downward Target: Short-term: 92,500 (previous important low). Long-term: 91,000 (lower support area).
- Accompanying Features: Volume may increase. The candlestick may close as a small bearish candle with a long lower shadow.
Scenario 2: Technical Rebound (Lower Probability)
- Trigger Condition: If the price rises to 94,000 and breaks through 94,500.
- Rebound Target: Short-term: 95,500 (top of the consolidation range). Long-term: 97,000 (stronger resistance).
- Accompanying Features: Volume may moderately increase. The candlestick may close as a long bullish candle or a doji.
4. Comprehensive Suggestions
Bearish Strategy:
- If the price breaks below 93,500, consider following the trend with a short position, setting a profit target at 92,500.
- Set a stop-loss above 94,000 to control risk.
Bullish Strategy:
- If the price rebounds and breaks through 95,000, consider a light long position, setting a profit target at 96,500.
- Set a stop-loss below 93,800 to protect capital.
Risk Warning:
- Be aware of the possibility of false breakouts, especially in a low-volume environment.
- Closely monitor changes in market sentiment and external macro factors (such as economic data or policy trends).
In summary, the recent candlestick trend remains bearish, and it is recommended to observe the breakthrough of key support and resistance levels, then choose the entry direction based on volume and technical indicators.
The above content is for reference only and does not constitute investment advice.
If you have any questions, you can contact us through the following official channels:
AICoin Official Website: www.aicoin.com
Telegram: t.me/aicoincn
Twitter: x.com/AICoincom
Email: support@aicoin.com
Group Chat: Customer Service Yingying, Customer Service KK
免责声明:本文章仅代表作者个人观点,不代表本平台的立场和观点。本文章仅供信息分享,不构成对任何人的任何投资建议。用户与作者之间的任何争议,与本平台无关。如网页中刊载的文章或图片涉及侵权,请提供相关的权利证明和身份证明发送邮件到support@aicoin.com,本平台相关工作人员将会进行核查。


