In 2024, the net inflow of gold ETFs reached $454 million, while Bitcoin ETFs saw a net inflow of $36.8 billion, which is 81 times that of gold ETFs. Recently, since the 19th, Bitcoin ETFs have shown a predominance of outflows, while Ethereum ETFs have continued to see inflows since November 22, except for minor outflows on December 18 and 19, with positive inflows at other times.
El Salvador's Bitcoin holdings have surpassed 6,000 coins, with a mid-term goal to continue increasing by 20,000 coins. BlackRock and Fidelity purchased over 100,000 ETH this week.
Today, instead of discussing market fluctuations, we will focus on predicting market trends, timing for bottom-fishing opportunities, and key turning points.

Bitcoin
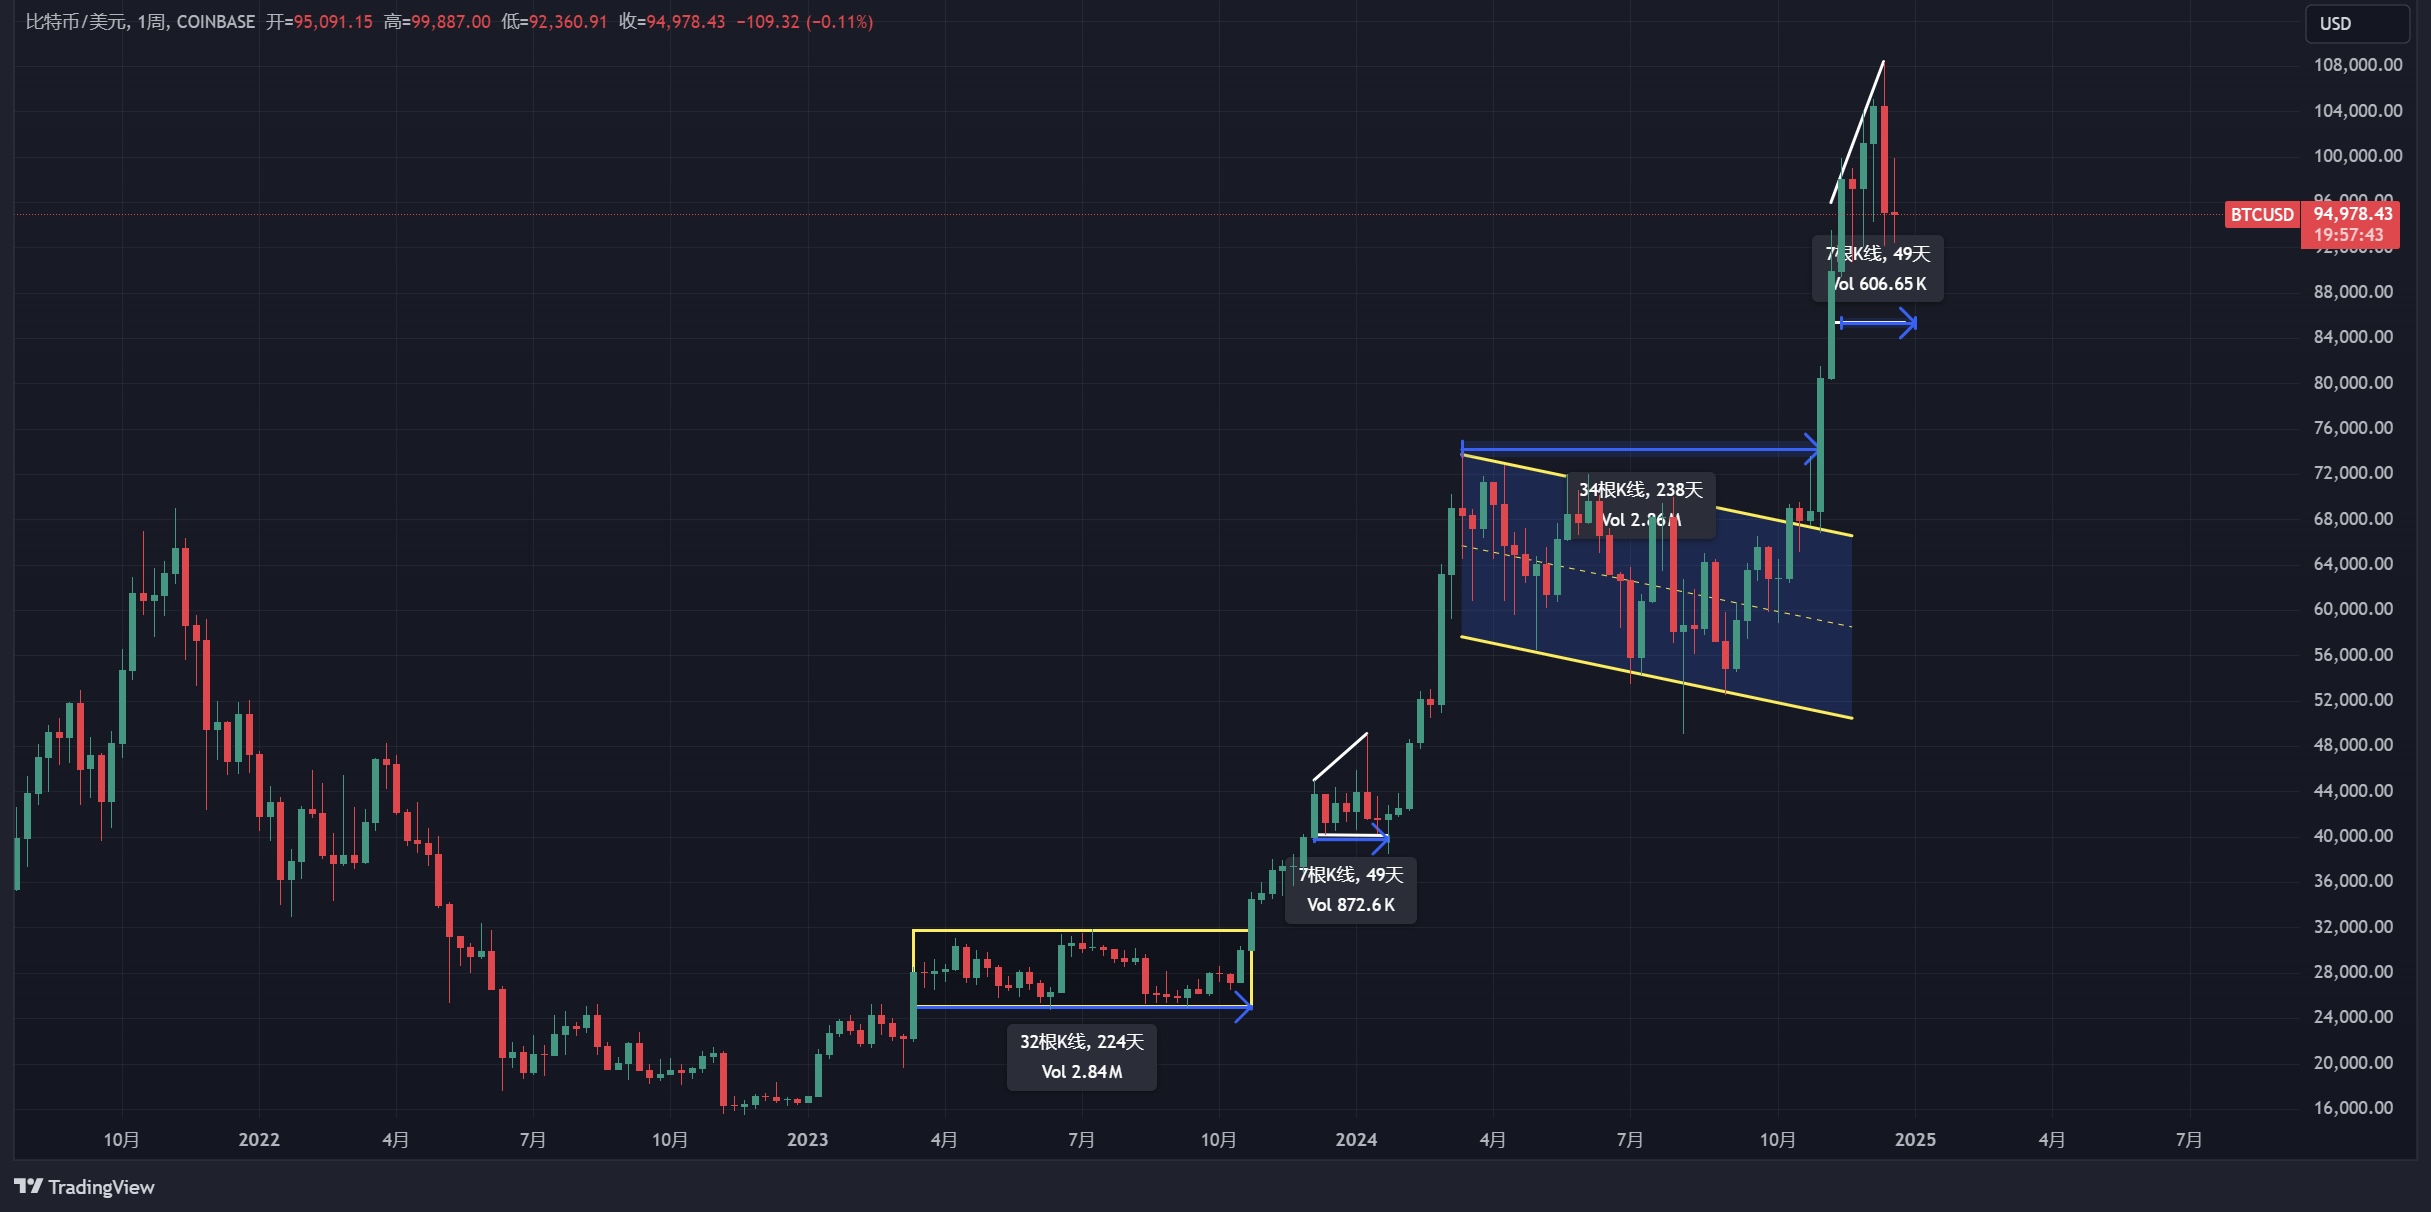
A month ago, after Bitcoin broke through 74,000, we have consistently referenced the surge to 49,000 in 2023, and we accurately pointed out the turning point for the market decline.
First, the price increase from 24,900 to 49,000 and from 52,500 to 108,353 is approximately a doubling.
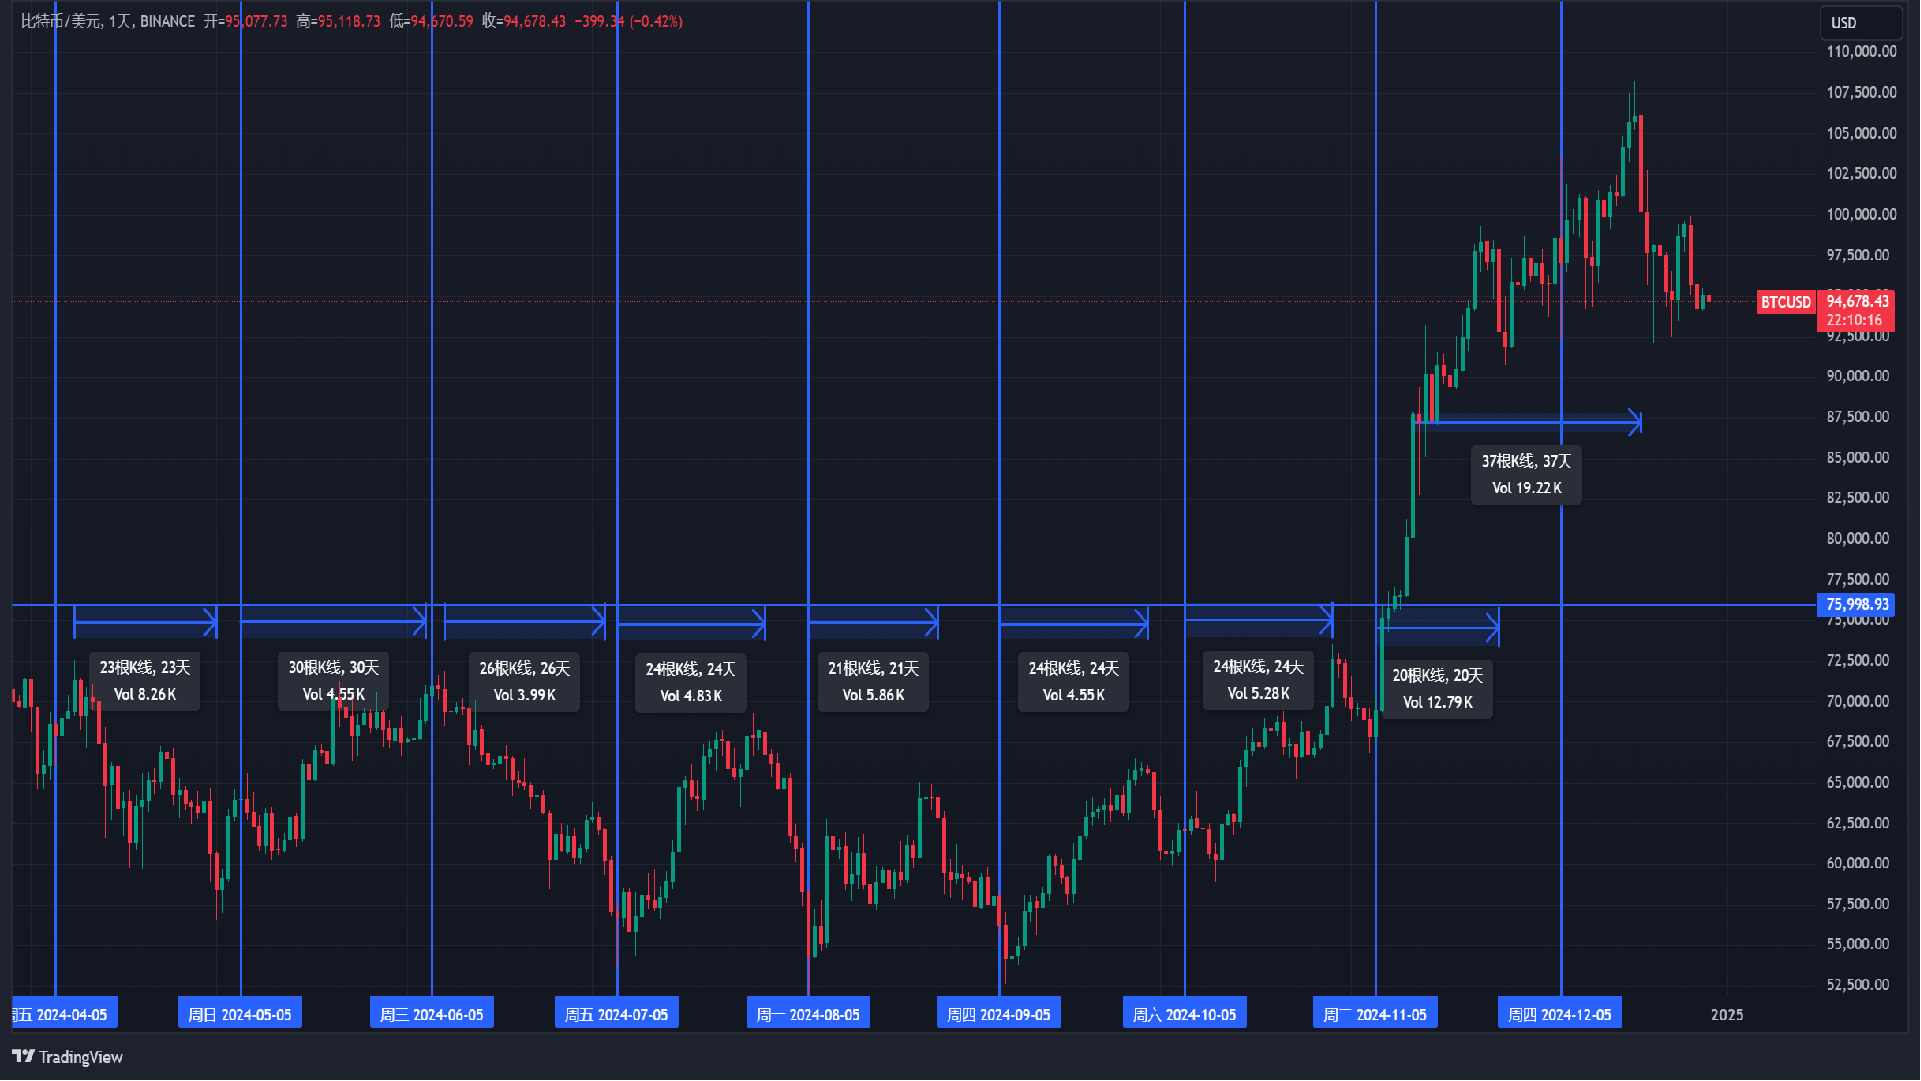
In terms of patterns: After a 224-day consolidation in the range of 24,900—31,800, it broke out; the 49,000—74,000 range saw a flag pattern consolidation for 238 days. After breaking through 40,000 in 2023, it formed a broadening triangle, and after breaking through 90,000 in 2024, it also formed a broadening triangle, which typically lasts around 35 days.

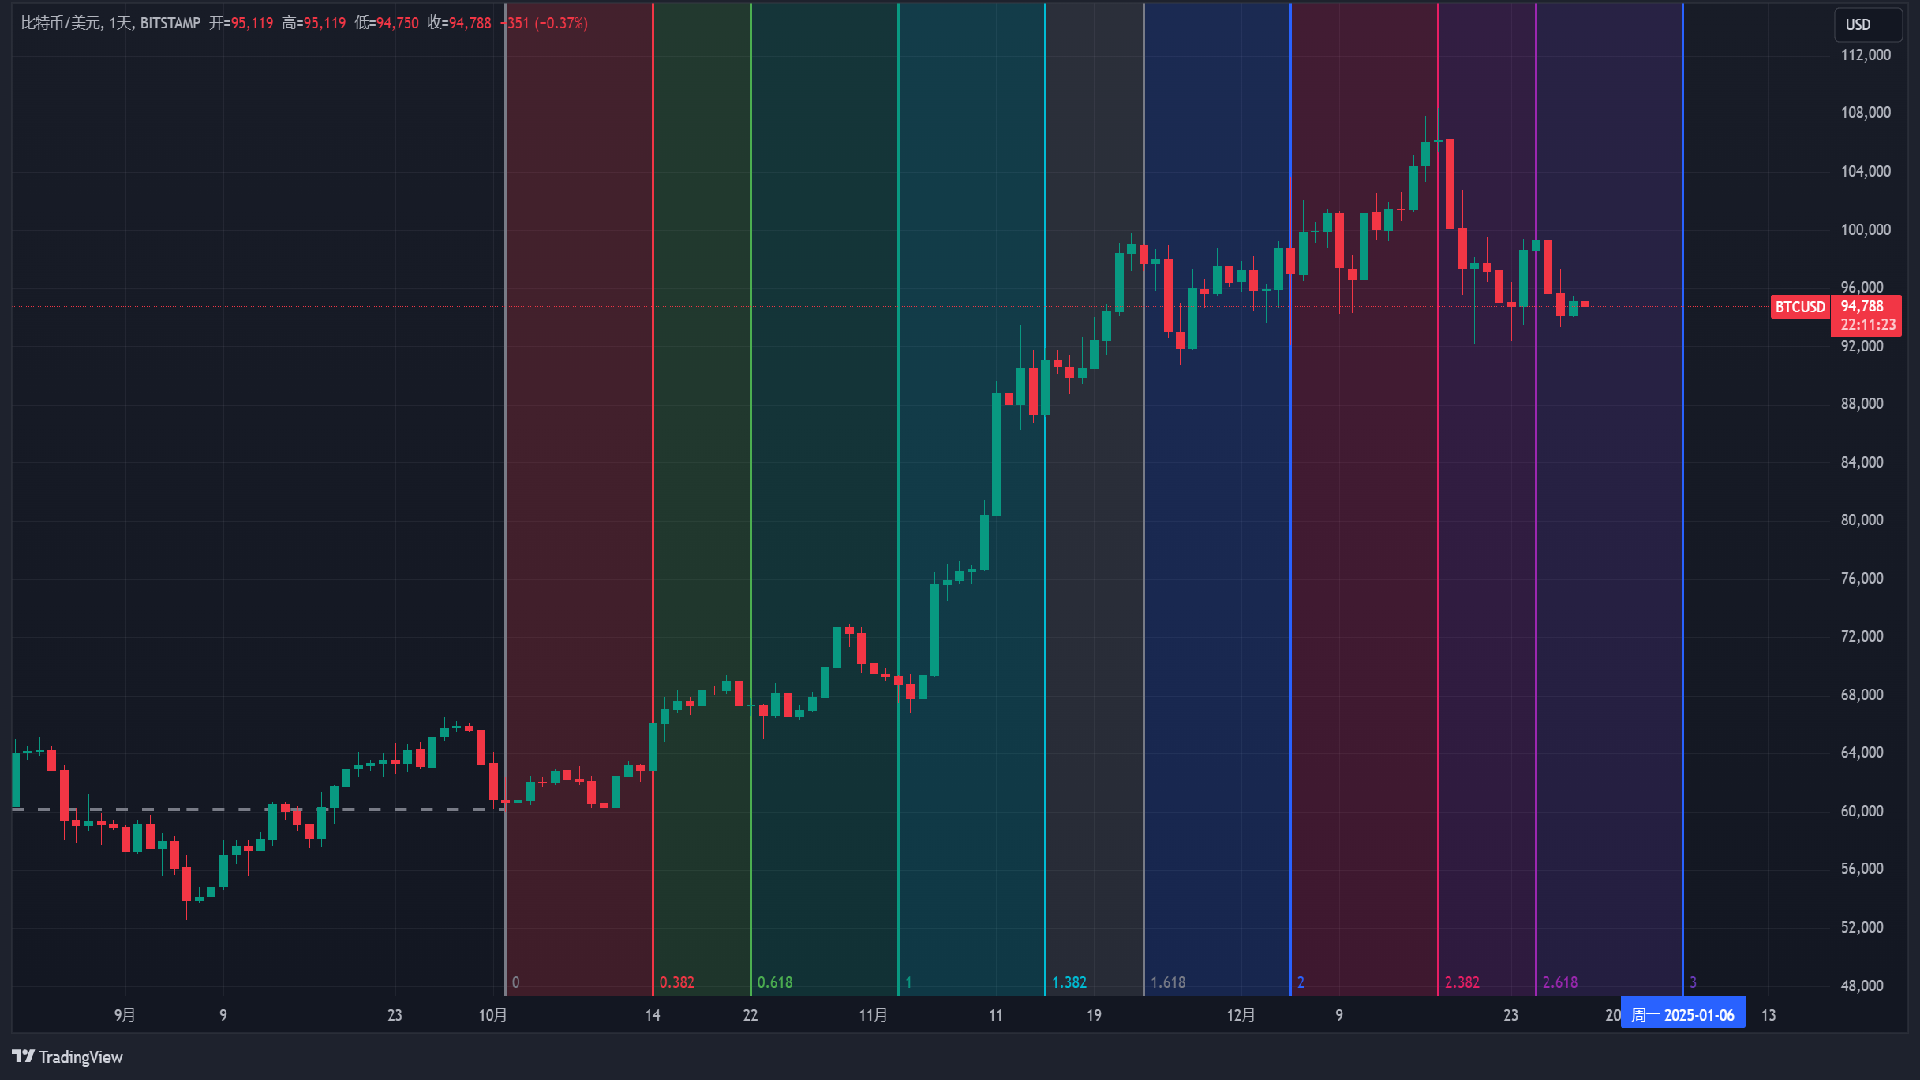
In terms of timing: Previously, we mentioned that after more than 7 months of consolidation, the beginning of each month is likely to see a turning point, so the probability of a turning point in the first week of next month is relatively high.
Support: Resistance:

Ethereum
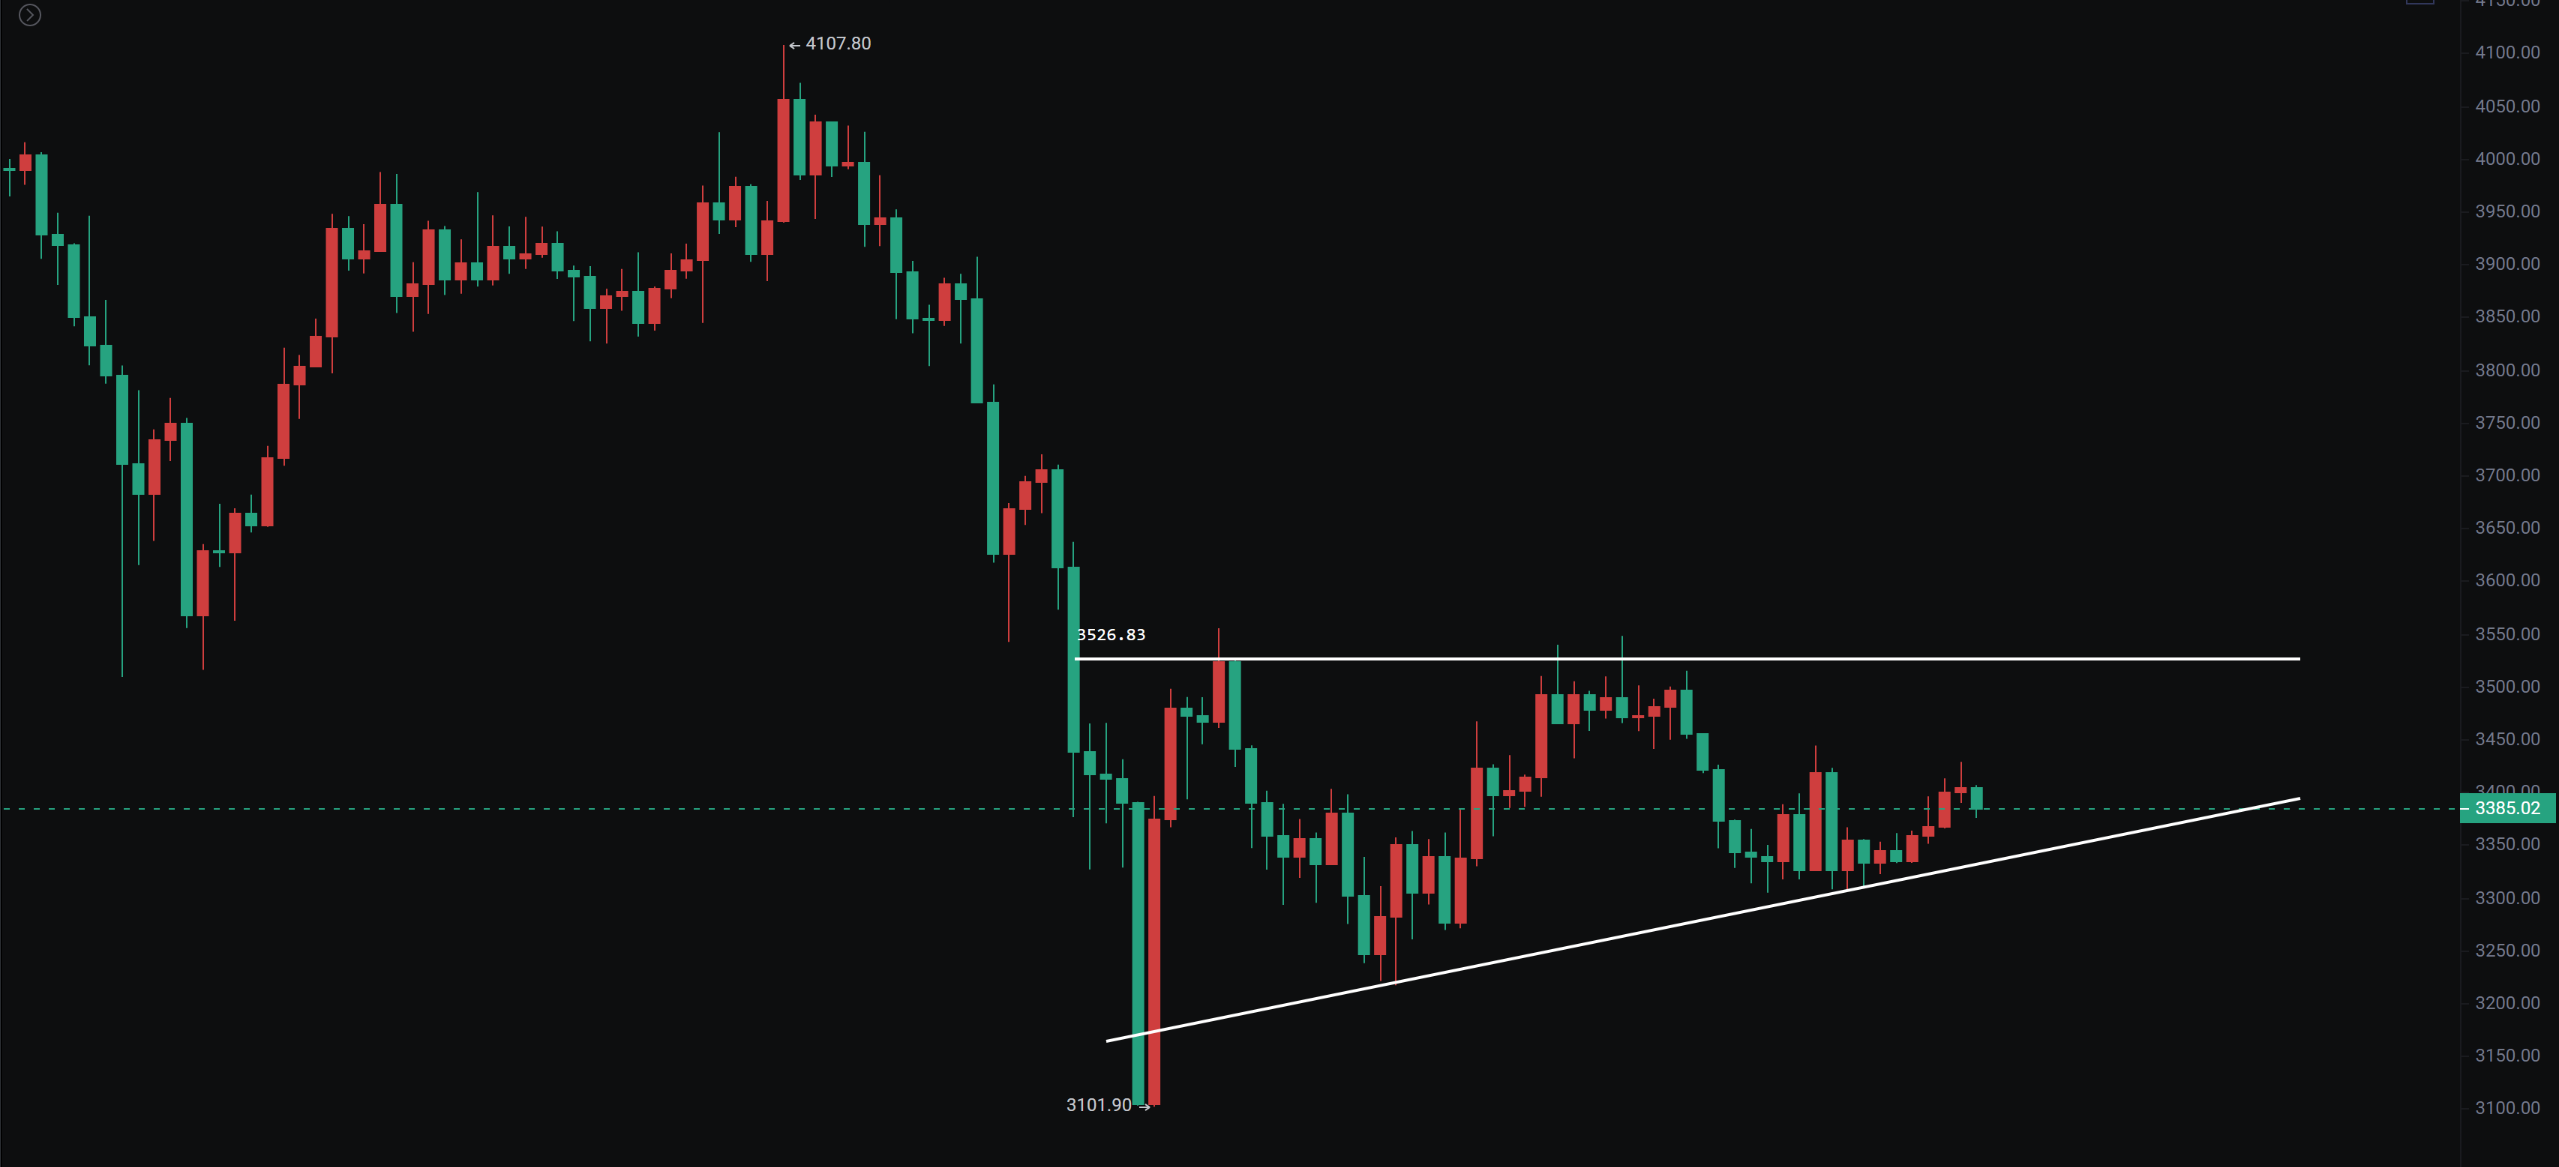
First, after a large bearish candle, this week closed with a doji, which is not a strong performance. The daily line shows support around 3,300, while short-term resistance is at 3,444. The 4-hour chart has formed a triangular structure after a spike, so we need to pay attention to the possibility of a second test before rebounding.
Support: Resistance:

If you like my views, please like, comment, and share. Let's navigate through the bull and bear markets together!!!
This article is time-sensitive and for reference only, with real-time updates.
Focusing on K-line technical research, sharing global investment opportunities. Public account: Trading Prince Fusu

免责声明:本文章仅代表作者个人观点,不代表本平台的立场和观点。本文章仅供信息分享,不构成对任何人的任何投资建议。用户与作者之间的任何争议,与本平台无关。如网页中刊载的文章或图片涉及侵权,请提供相关的权利证明和身份证明发送邮件到support@aicoin.com,本平台相关工作人员将会进行核查。


