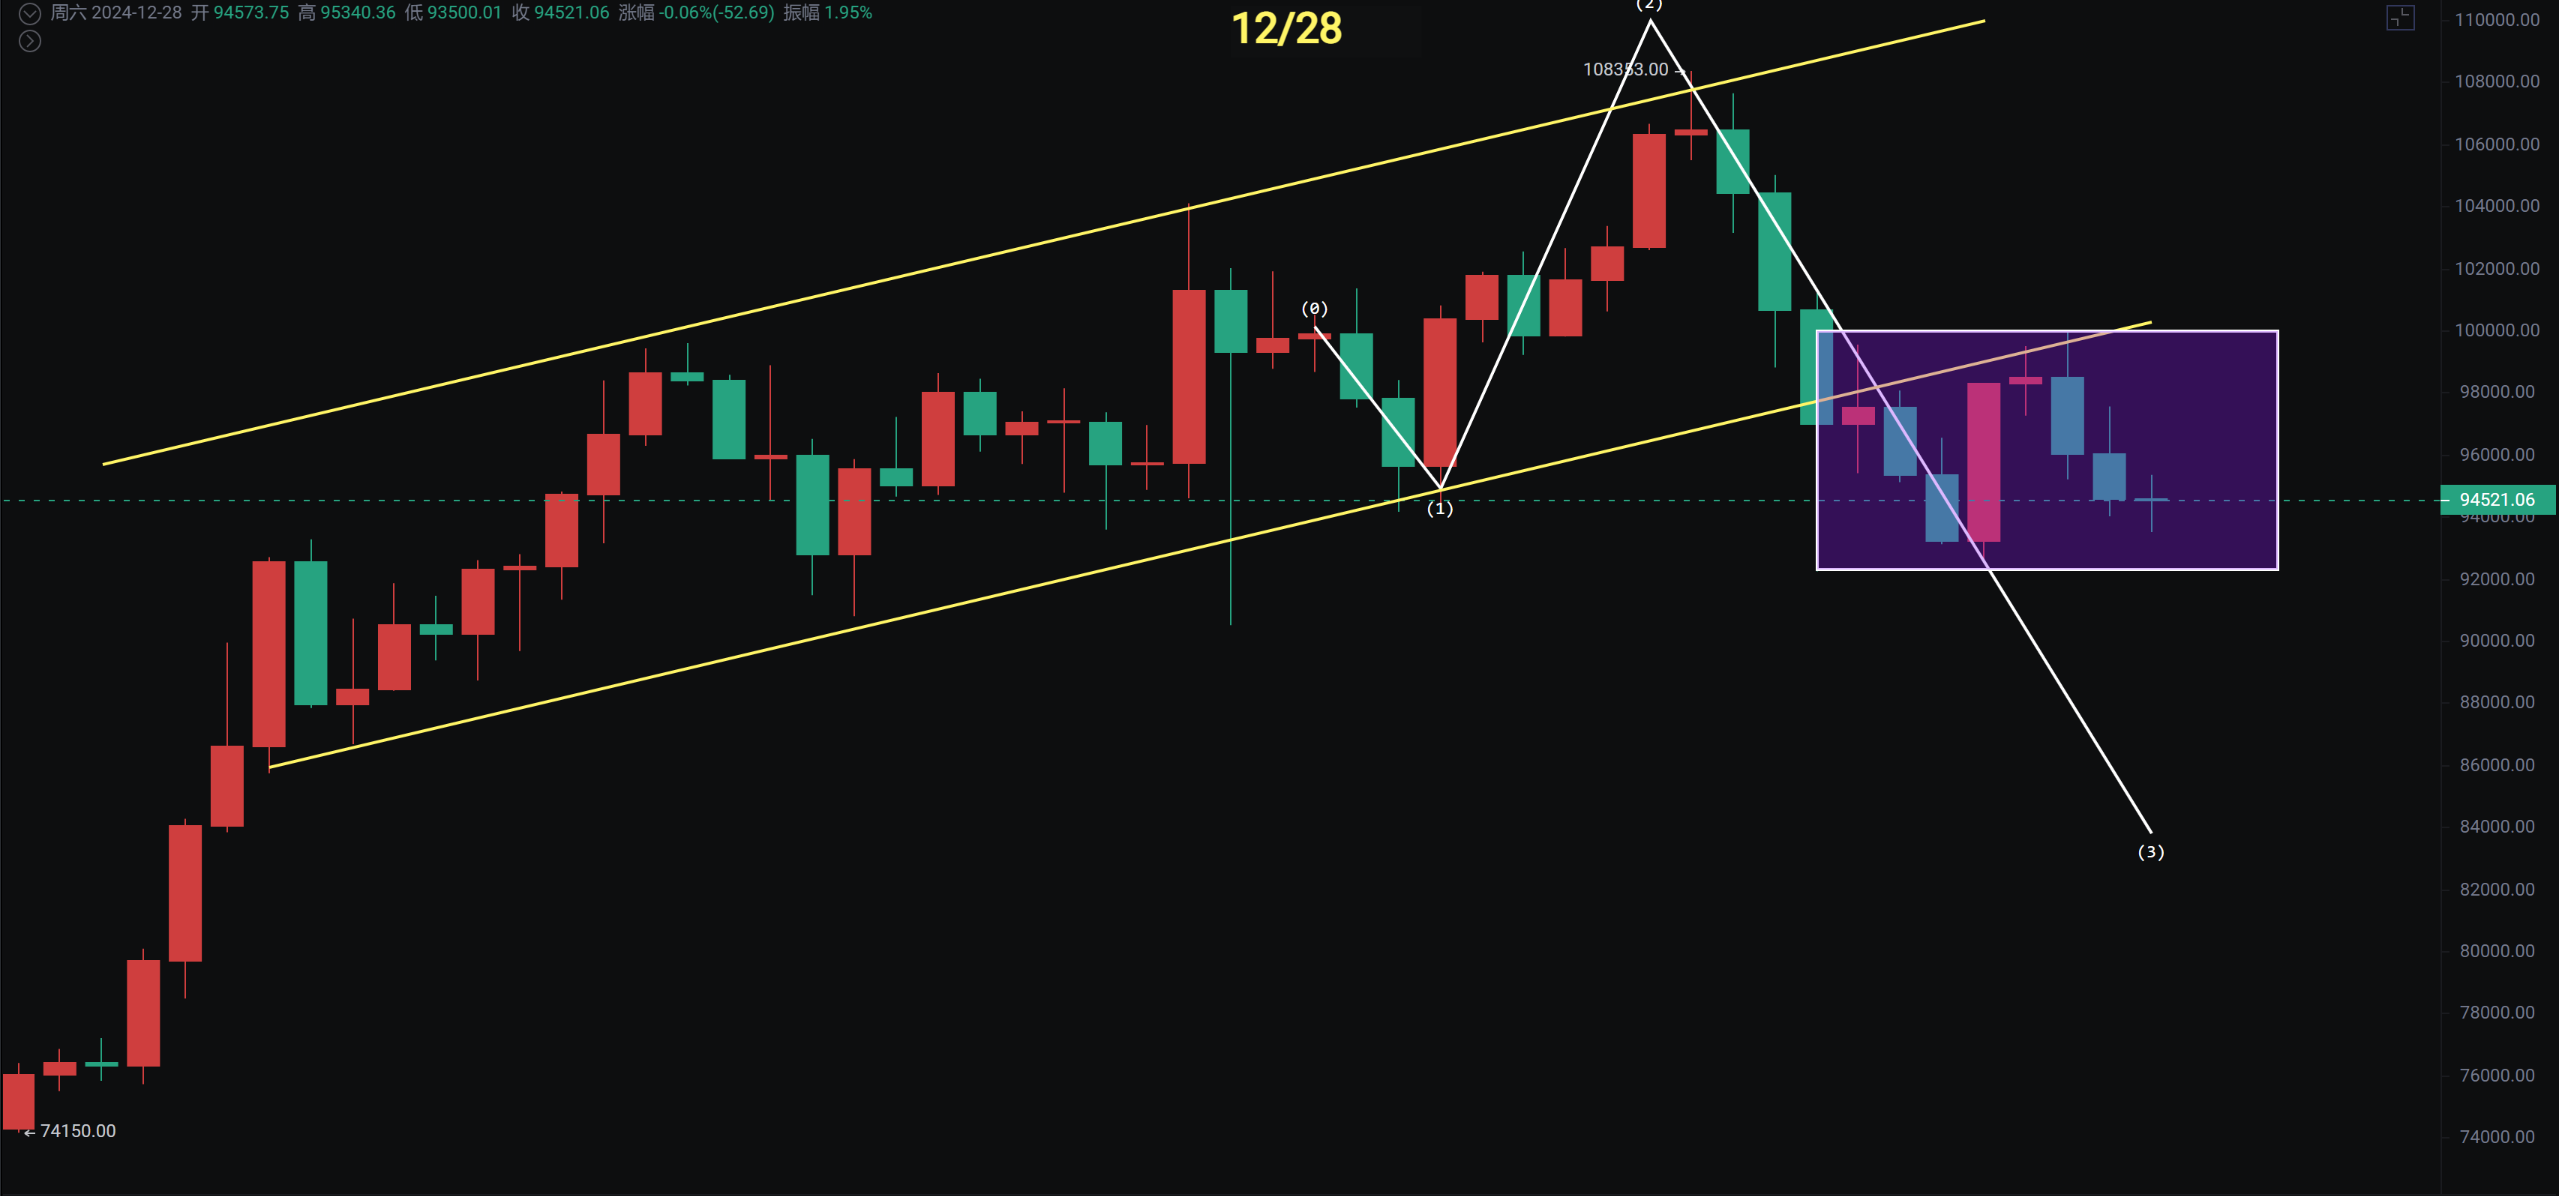
The large coin's long-term yearly, quarterly, and monthly cycles are about to close. As of the publication date, the yearly line has increased by 123%, the quarterly line has broken through and fluctuated around 74,000, setting a historical high with a 49% increase, and the monthly line has formed a doji star, which generally indicates a continuation of the upward trend. After a correction, it is expected to continue rising. Tomorrow's weekly close is also likely to form a doji star, which typically indicates a continuation of the downward trend. The key here is to watch the support at the 92,232 line; if it holds, there is a chance for a short-term rebound. Instead of guessing, it is better to follow the market's natural movements. Those who built positions on the left side around 94,000 are still holding, and there are still staggered buy orders set at 90,000—85,000.
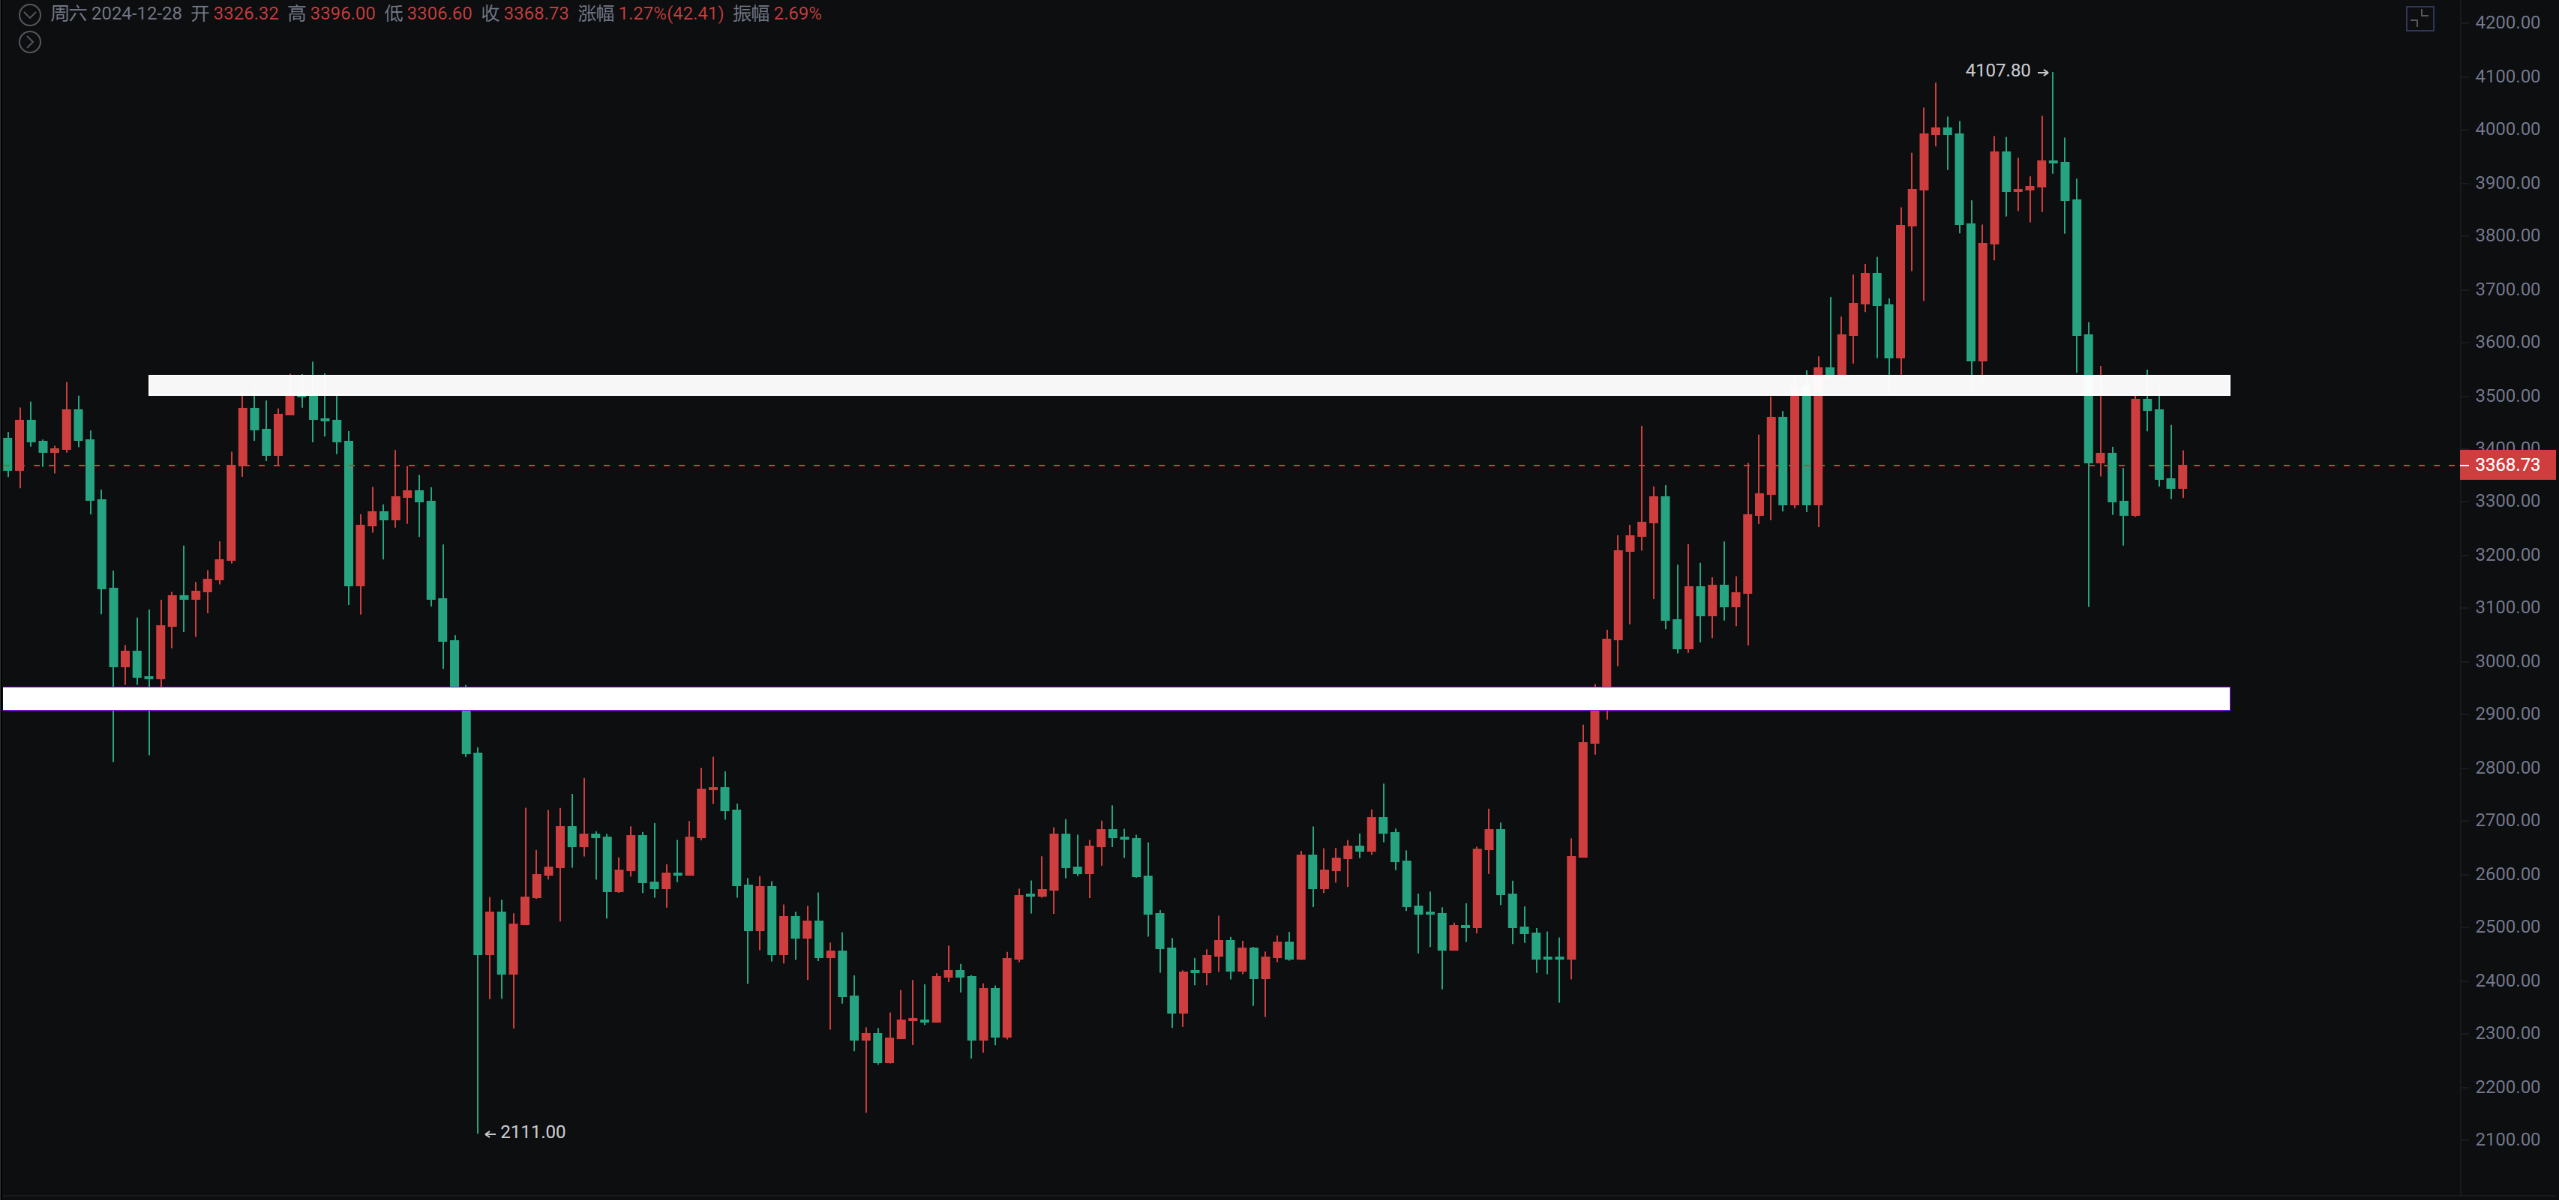
Although Ethereum's yearly line is not as strong as the large coin's, it has still increased by 46%. The quarterly line has shown an engulfing pattern with three attempts to break through around 4,000 facing resistance, and further attempts for a fourth or fifth breakthrough cannot be ruled out. The monthly and weekly doji stars are both continuation patterns, and it is recommended to buy in batches during declines while waiting for the Spring Festival market.
Large Coin
After a second rebound on the daily line, it continues to decline, testing the support at the 92,322 line again. If this level holds, there will be a short-term rebound, but the key pressure still lies in whether it can break through 97,500—100,000. The 4-hour chart still shows a fluctuating market after the decline, so patiently wait for opportunities to increase positions in the medium to long term.
The 4-hour chart formed a double bearish candle with a bullish candle in between yesterday, and the bottom still looks at the 92,232 spike support. In my personal view, even if it breaks below, there is at most a 3,000—5,000 point decline space left.
Support: Pressure:

Ethereum
The daily line has broken below 3,500 and formed an M-top; if the rebound does not recover, it cannot be ruled out that it will test the spike bottom support again. The SRSI has entered the overbought zone, and with support below, it can be bought in batches.
Support: Pressure:

If you like my views, please like, comment, and share. Let's navigate through the bull and bear markets together!!!
The article is time-sensitive and for reference only, with real-time updates.
Focusing on K-line technical research, sharing global investment opportunities. Public account: Trading Prince Fusu

免责声明:本文章仅代表作者个人观点,不代表本平台的立场和观点。本文章仅供信息分享,不构成对任何人的任何投资建议。用户与作者之间的任何争议,与本平台无关。如网页中刊载的文章或图片涉及侵权,请提供相关的权利证明和身份证明发送邮件到support@aicoin.com,本平台相关工作人员将会进行核查。


