Conveying the Way of Trading, Enjoying a Wise Life.

Today, let's talk about the price trend of Ethereum. On the daily chart, Ethereum is currently at the position of $3,290, which is where a dense trading area formed on November 25, 2024. After breaking through this level, it confirmed with a pullback. Subsequently, Ethereum reached a new high. When it first pulled back to this level, it encountered strong resistance or support, followed by a strong rebound, which rebounded to $3,550, the neckline of this double top structure. At this position, $3,550 also has very strong resistance.
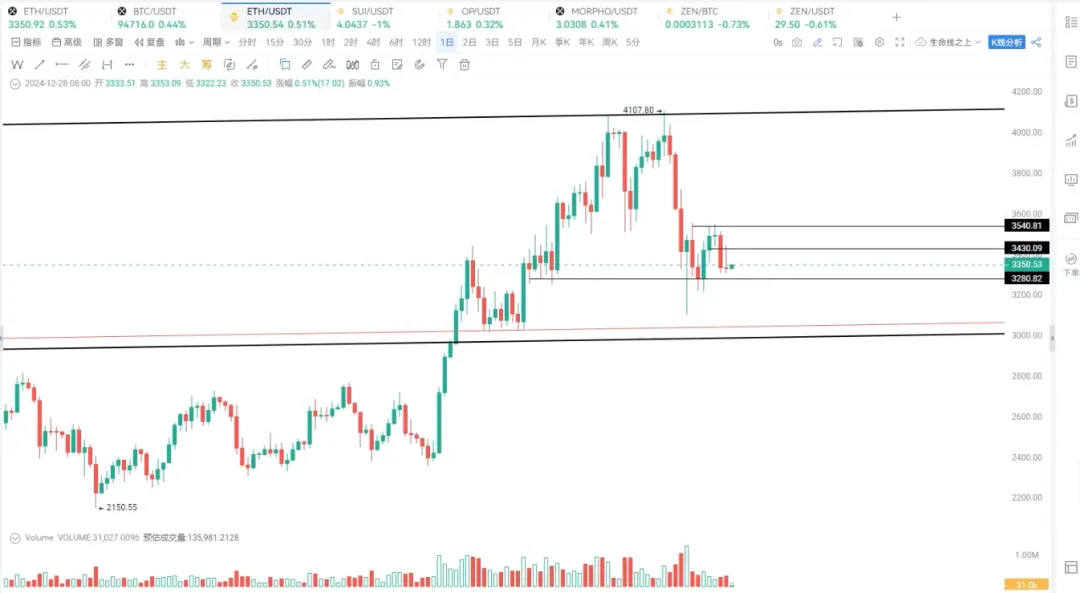
Therefore, Ethereum later showed a doji star and long bearish candles, which is due to the strong pressure at the neckline around $3,550. However, facing the support below, we note that this level has been tested twice, and yesterday and the day before, it once again approached the $3,280 level. Yesterday, it formed a doji star with a very long upper shadow. If such a special candlestick pattern appears at an important support level, it indicates that there is some buying interest at this level, but the selling pressure above is also extremely severe.
Thus, Ethereum's recent trend should consolidate around the $3,280 - $3,550 oscillation area, and short-term traders can engage in buying high and selling low. If it can break through $3,550, it will initiate a new upward trend; conversely, if it breaks down below $3,280, it will continue to test the larger support at $3,000. Therefore, breaking down is also a buy, and breaking up can also be a short-term trade, so the strategy is to buy high and sell low around $3,550 and $3,280.

On the 4-hour chart, we find that Ethereum has formed a double bottom structure, with the right bottom being slightly higher than the left bottom, and the neckline at $3,550. So, whether the right bottom is being formed is something we need to consider. From the current perspective, it is very likely that it is forming a bottom. Therefore, from the 4-hour level, the upward pressure for Ethereum, besides $3,550, is also at $3,430.

Returning to the 1-hour level, Ethereum shows a nested pattern, not only forming a larger double bottom structure at the right bottom position but also being near the right bottom position at the 1-hour level. Thus, at this point, there are two right bottoms, regardless of the larger or smaller cycles, the $3,280 level will become a very important support for Ethereum. Looking at the previous downward tests on the hourly level, Ethereum shows a tendency to form a right bottom. Therefore, its important stop-loss level is $3,304; if it breaks the previous low, it can be declared that this right bottom has ended. Otherwise, Ethereum may continue to rebound upwards. So, $3,430 is our first important target for trading, along with $3,550.
That concludes our discussion on Ethereum's price trend today. I hope this is helpful to everyone, and see you next time.
For more information, you can contact our assistant and join the VIP group.
免责声明:本文章仅代表作者个人观点,不代表本平台的立场和观点。本文章仅供信息分享,不构成对任何人的任何投资建议。用户与作者之间的任何争议,与本平台无关。如网页中刊载的文章或图片涉及侵权,请提供相关的权利证明和身份证明发送邮件到support@aicoin.com,本平台相关工作人员将会进行核查。