Crypto Market Analysis: 12.25 Long Bullish Breakout, Focus on Bitcoin's Upward Trend! Ethereum Technical Signals Indicate Bulls Gaining Momentum! Latest Market Analysis
Crypto Market Analysis: Latest Bitcoin Market Analysis on 12.25
Article Published on 2024.12.25—01:30
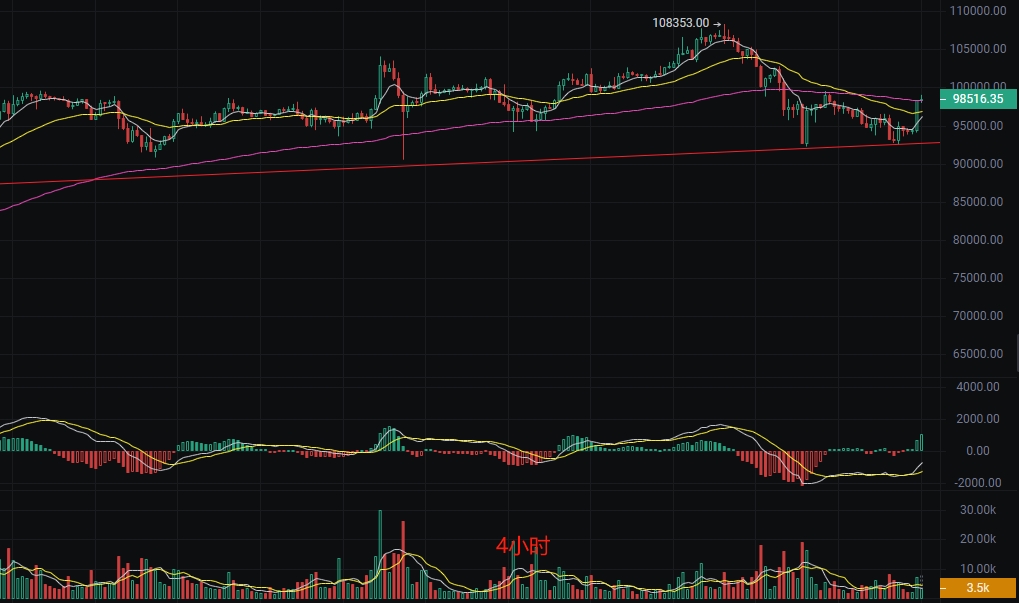
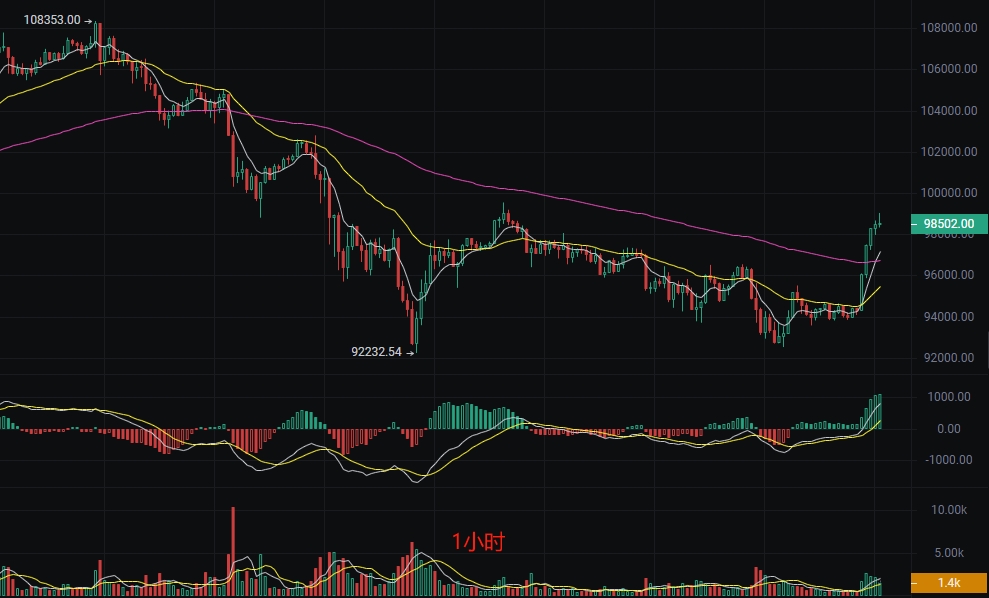
Current Bitcoin price is 98,800, clearly starting to challenge the 100,000 mark. After breaking through 95,000, the bulls are making a comeback. The only regret is that the bulls at 93,000 took profits at 96,000, leaving only a small position held, which is better than nothing. Let's see if this wave of bulls can break through 100,000 and set a new historical high; we look forward to it together.

As usual, let's analyze the price trend. Currently, the K-line pattern shows a clear upward trend, especially with the price rapidly rising from 94,400 to 98,800. The daily line has formed a long bullish candle, breaking the bearish trend and turning bullish. The technical indicator MACD in the 4-hour cycle shows that the DIF line has crossed above the DEA line, and the MACD histogram has turned from negative to positive, indicating a bullish signal.

The current Relative Strength Index (RSI) is 57.9, positioned in a neutral to high range, not yet in the overbought zone but close. We need to pay attention to whether it will continue to rise or pull back. The trend indicator EMA shows that the short-term EMA7 has crossed above the medium and long-term EMA30 and EMA120, presenting a bullish arrangement, supporting the upward trend. Trading volume has significantly increased, enhancing market activity, with bulls dominating. Overall, the strategy is shifting; we should follow the main force and primarily take long positions, with short positions as a supplement.
Today's Point Prediction
Long Entry at 97,000, add at 96,000, stop at 95,500, target 100,000
Short Entry at 100,000, add at 101,500, stop at 102,000, target 99,000
Crypto Market Analysis: Latest Ethereum Market Analysis on 12.25
Article Published on 2024.12.24—01:30
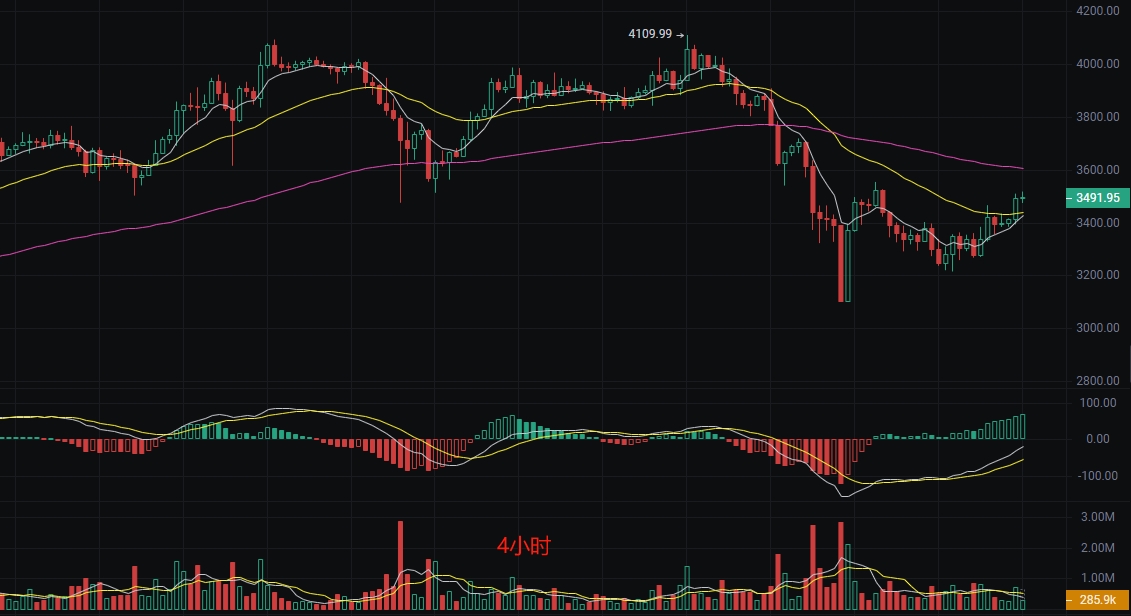
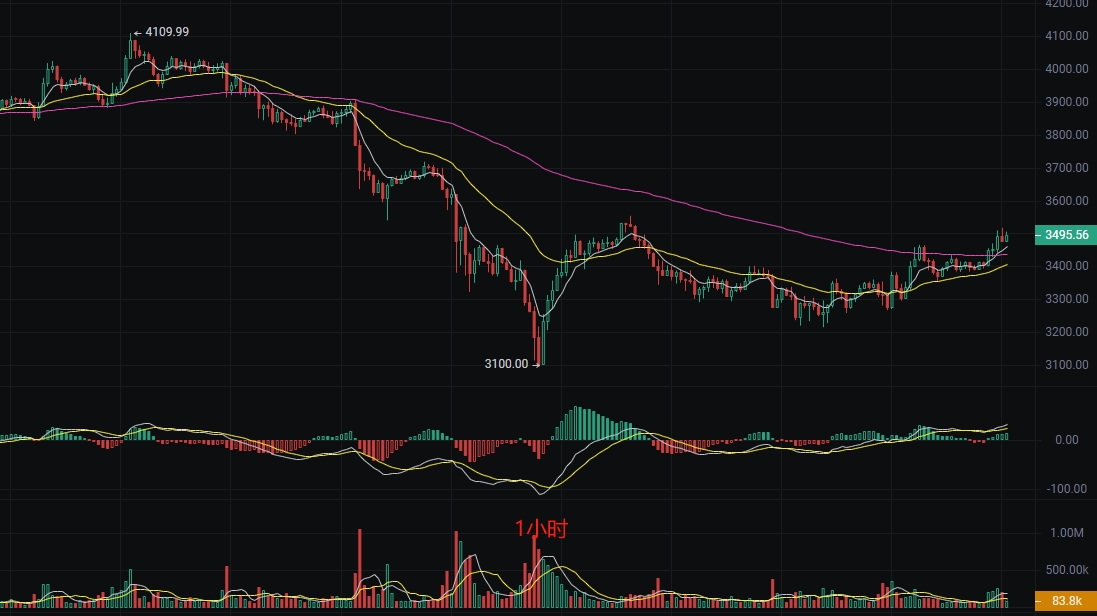
Current Ethereum price is 3,505. Before publishing, I did not enter the market for Ethereum, as I was waiting for a suitable pullback point. I originally wanted to consider shorting after the bulls showed clear resistance, but up until the time of writing, the bulls have not finished their upward stretch and are showing determination to challenge the significant resistance level of 3,600. At this moment, it is evident that a short-term bullish trend is emerging. However, rationality tells me to wait until this rapid rise ends before entering the market; for now, I will just wait.

Looking at the K-line on the order book, there was a clear rebound between the 23rd and 24th, forming a long bullish candle. I noticed that the bullish strength has increased, with the K-line continuously closing bullish in the 4-hour cycle, breaking through the previous high near 3,500, indicating that a short-term upward trend has been established. The technical indicator MACD currently shows both DIF and DEA as negative, but the MACD histogram has turned from green to red, indicating that bearish momentum is weakening, so I judge that the bulls are starting to gain strength.

The Relative Strength Index (RSI) 14 is close to the overbought zone but has not entered the extreme area, still having room for further upward movement. The trend indicator EMA shows that the price has stabilized above EMA7 and is approaching EMA30, with short-term moving averages showing a bullish arrangement. I believe this wave of the main force will help support the price to continue rising, coupled with increased trading volume and market activity, with clear capital inflow. We have reason to believe that the bullish trend has begun to gain momentum, or that the trading volume momentum is already present, and after a pullback, there will be a concentrated breakout. Therefore, my suggestion is to wait for the next small pullback to enter long positions primarily, with short positions as a supplement.
Today's Latest Point Reference
Long Entry at 3,400, add at 3,350, stop at 3,000, target 3,600
Short Entry at 3,600, add at 3,650, stop at 3,700, target 3,500
The above analysis is based on market data and order book trend analysis and does not constitute investment advice. For reference only. Over the past ten years, I have continuously explored and experienced hundreds of different digital assets. Throughout this process, I have experienced the brilliance of bull markets and the gloom of bear markets, accumulating countless valuable experiences and profound lessons. As a female trader striving in this challenging field, I feel a responsibility to share my insights and hope to help others with dreams find their place in this unpredictable market and embark on their own successful journey.

The content of this article is time-sensitive and for reference only; risks are borne by the reader.
免责声明:本文章仅代表作者个人观点,不代表本平台的立场和观点。本文章仅供信息分享,不构成对任何人的任何投资建议。用户与作者之间的任何争议,与本平台无关。如网页中刊载的文章或图片涉及侵权,请提供相关的权利证明和身份证明发送邮件到support@aicoin.com,本平台相关工作人员将会进行核查。


