Trading Philosophy: Look for trends in the long term, find entry points in the short term;
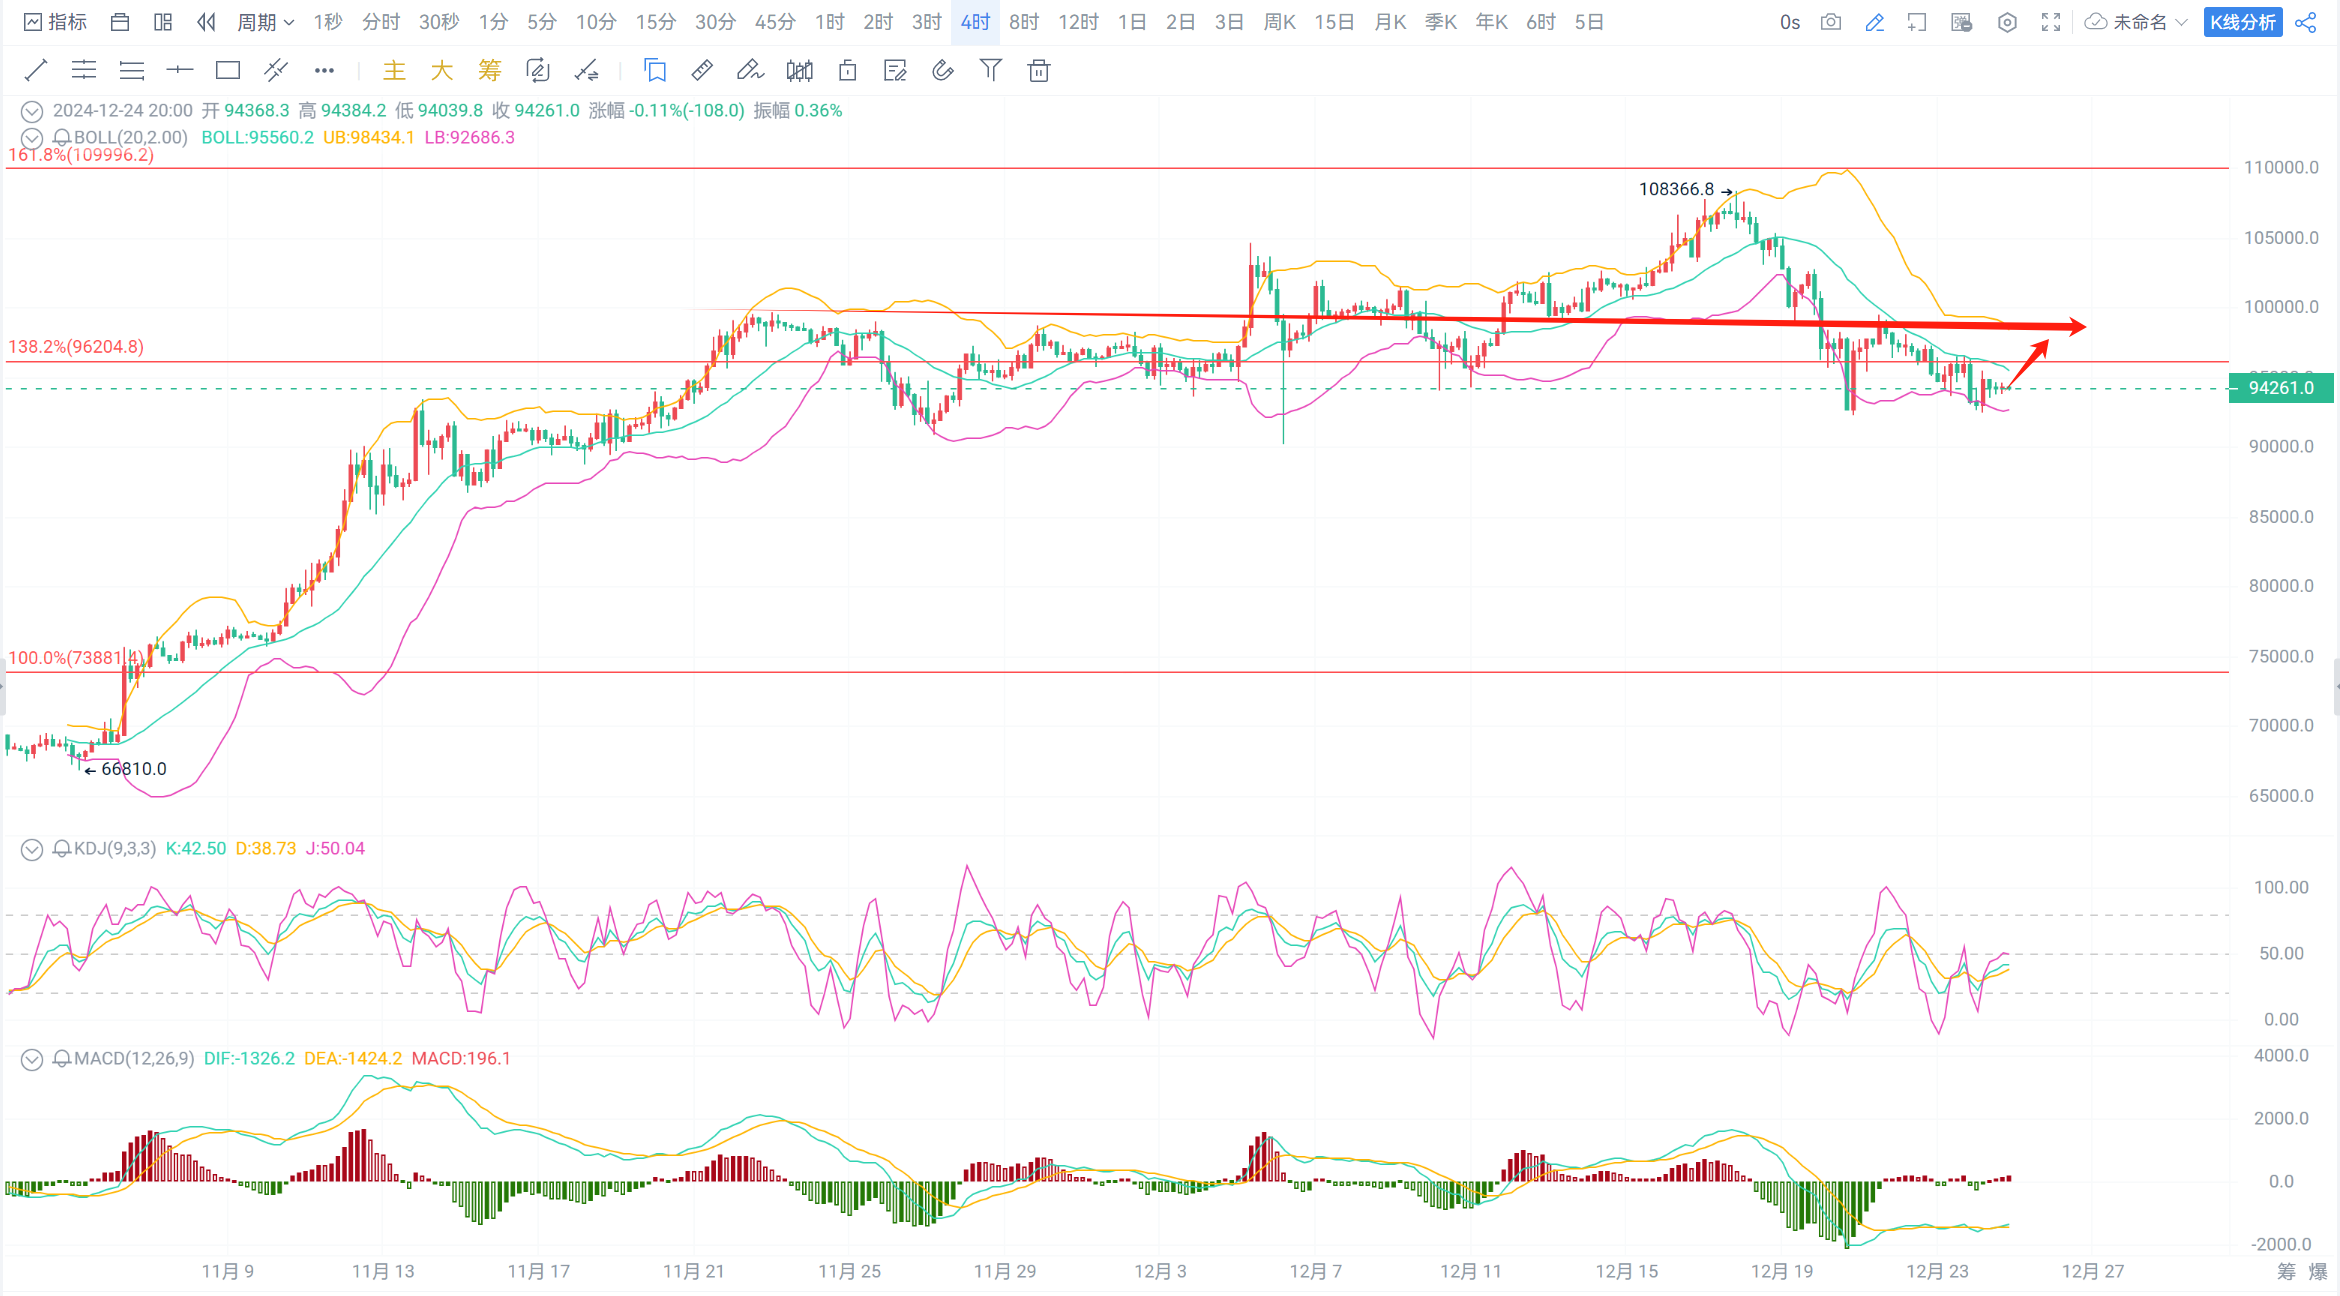
Technical Analysis: For Bitcoin, the daily chart continues to close with a bearish candle, the Bollinger Bands are starting to slightly open, the MACD moving average continues to move downward, bearish volume continues to increase, and the KDJ line continues to move downward. On the 4-hour chart, the Bollinger Bands are starting to close, the price is consistently below the middle band, the rebound has not managed to break above the middle band, the MACD moving average is starting to move upward, bullish volume continues to increase slightly, and the KDJ line is starting to move upward;
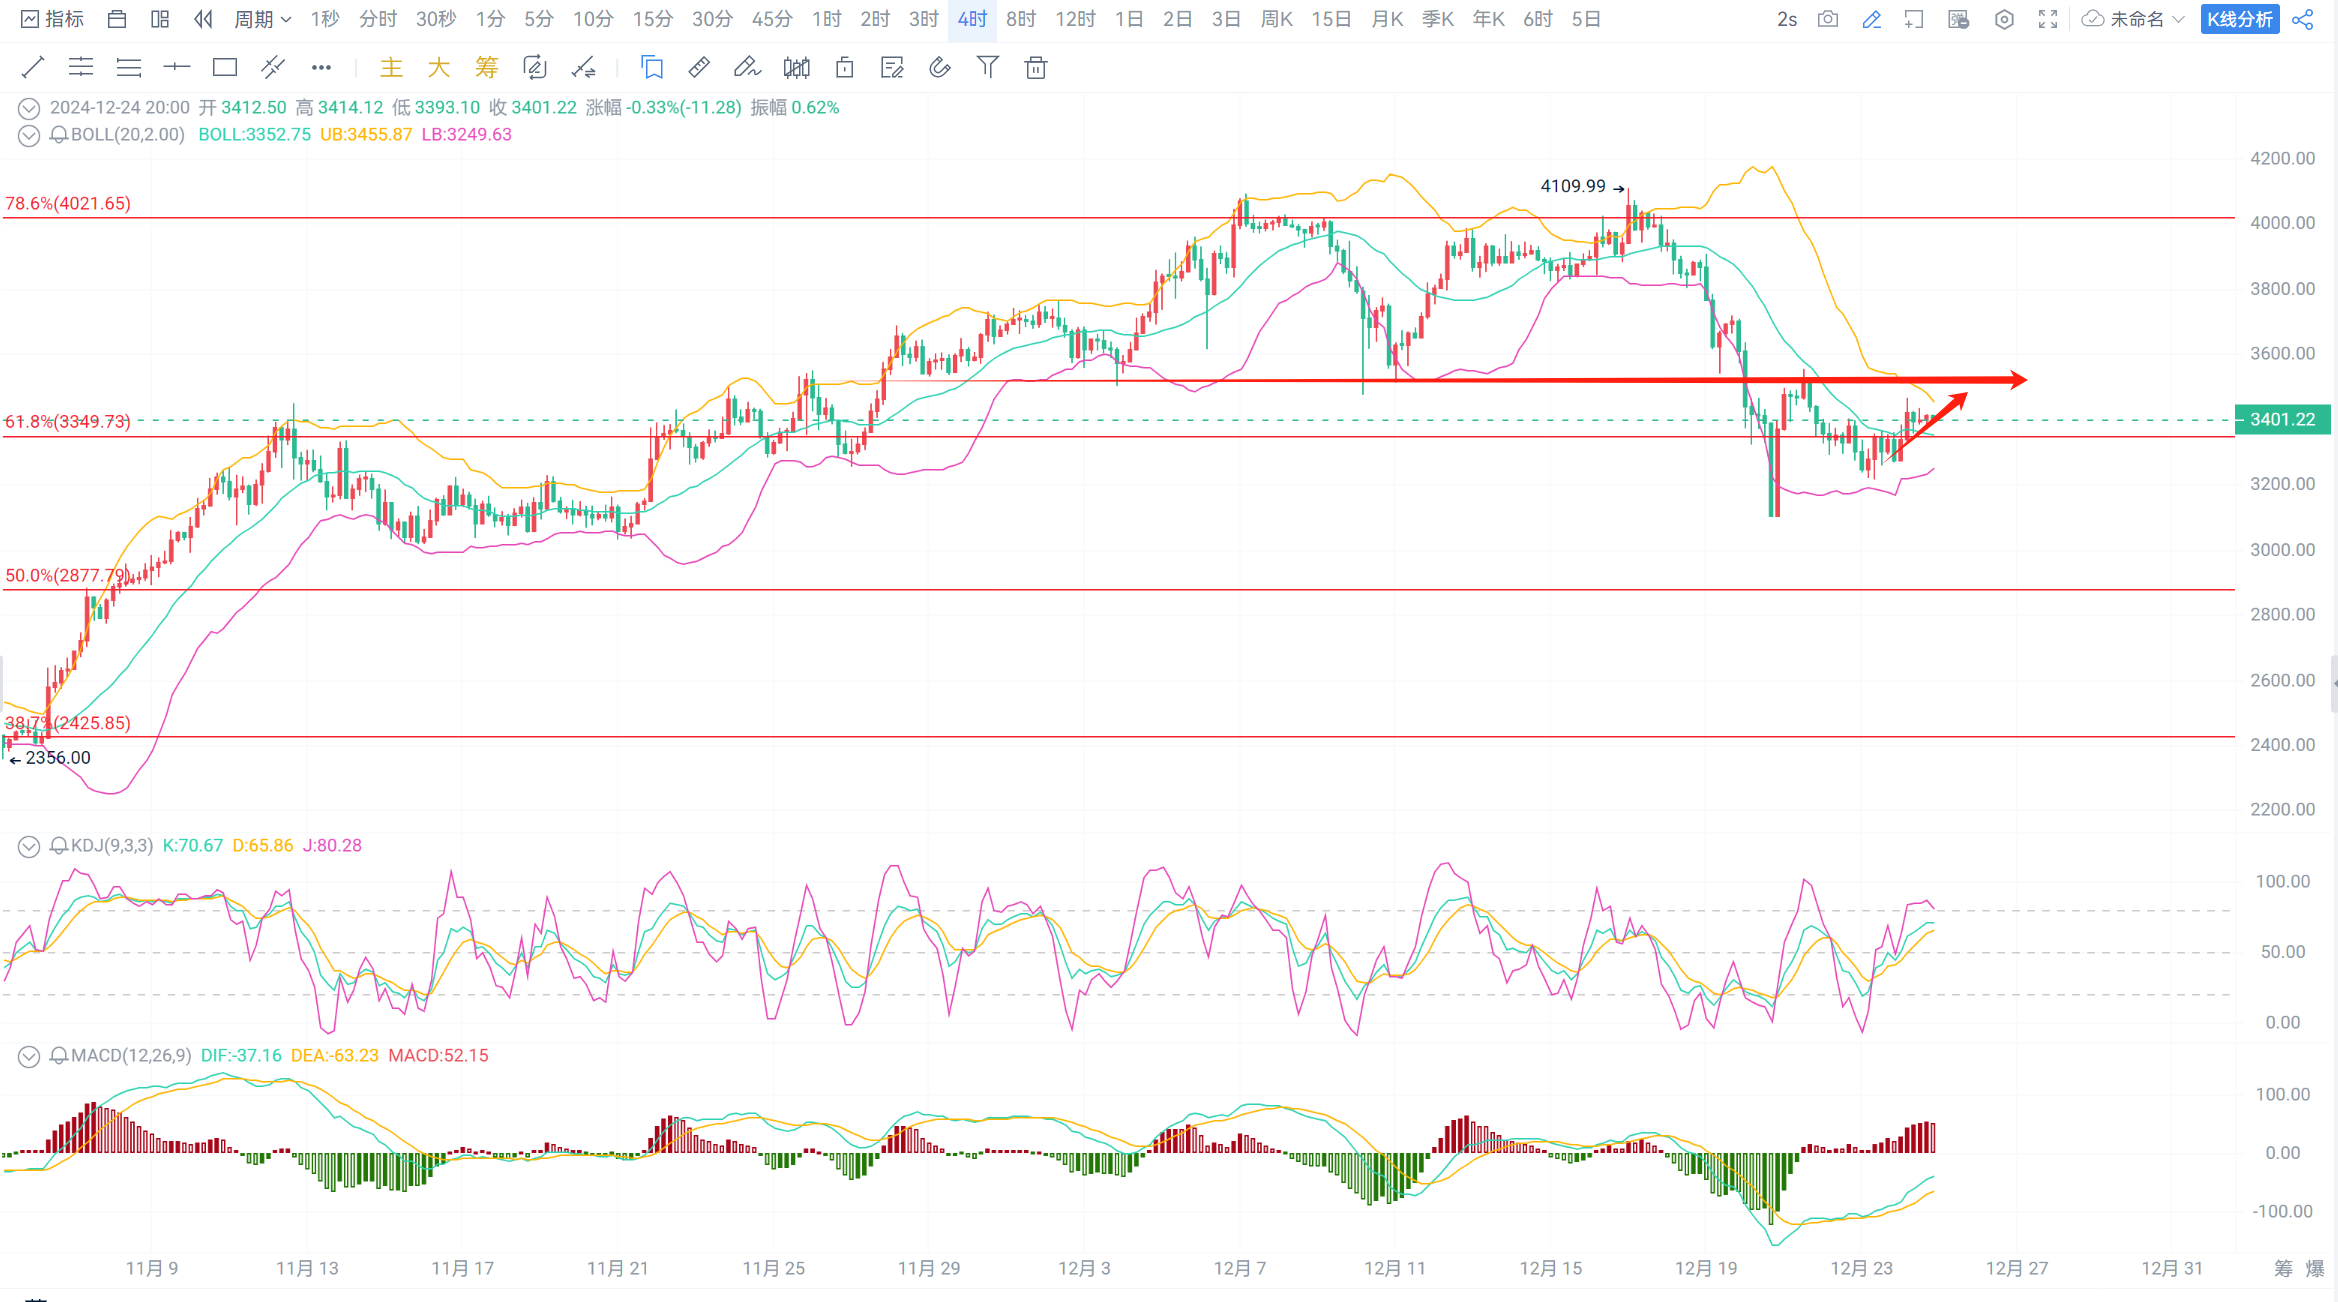
For Ethereum, the daily chart continues to close with a bullish candle, the Bollinger Bands continue to open downward, the MACD moving average continues to move downward, bearish volume continues to increase, and the KDJ line is moving steadily. On the 4-hour chart, the Bollinger Bands are starting to close, the MACD moving average is moving upward, bullish volume is increasing, and the KDJ line is moving upward;
In summary, the overall market is in a downward trend adjustment phase, and it is expected that there will be some degree of recovery in the subsequent market. Unfortunately, the aggressive long positions set up yesterday were swept before the market started to rise. Currently, the market is fluctuating, and it is recommended to continue to buy low!
Operation Suggestion: Aggressively buy!
Buy Bitcoin in the 93500-94000 range, target 95500-96500, stop loss at 93000;
Buy Ethereum in the 3320-3350 range, target 3400-3500, stop loss at 3280;
The strategy is time-sensitive, please refer to private real-time guidance for specifics!

免责声明:本文章仅代表作者个人观点,不代表本平台的立场和观点。本文章仅供信息分享,不构成对任何人的任何投资建议。用户与作者之间的任何争议,与本平台无关。如网页中刊载的文章或图片涉及侵权,请提供相关的权利证明和身份证明发送邮件到support@aicoin.com,本平台相关工作人员将会进行核查。


