Trading Philosophy: Look at the trend in the long term, find entry points in the short term;
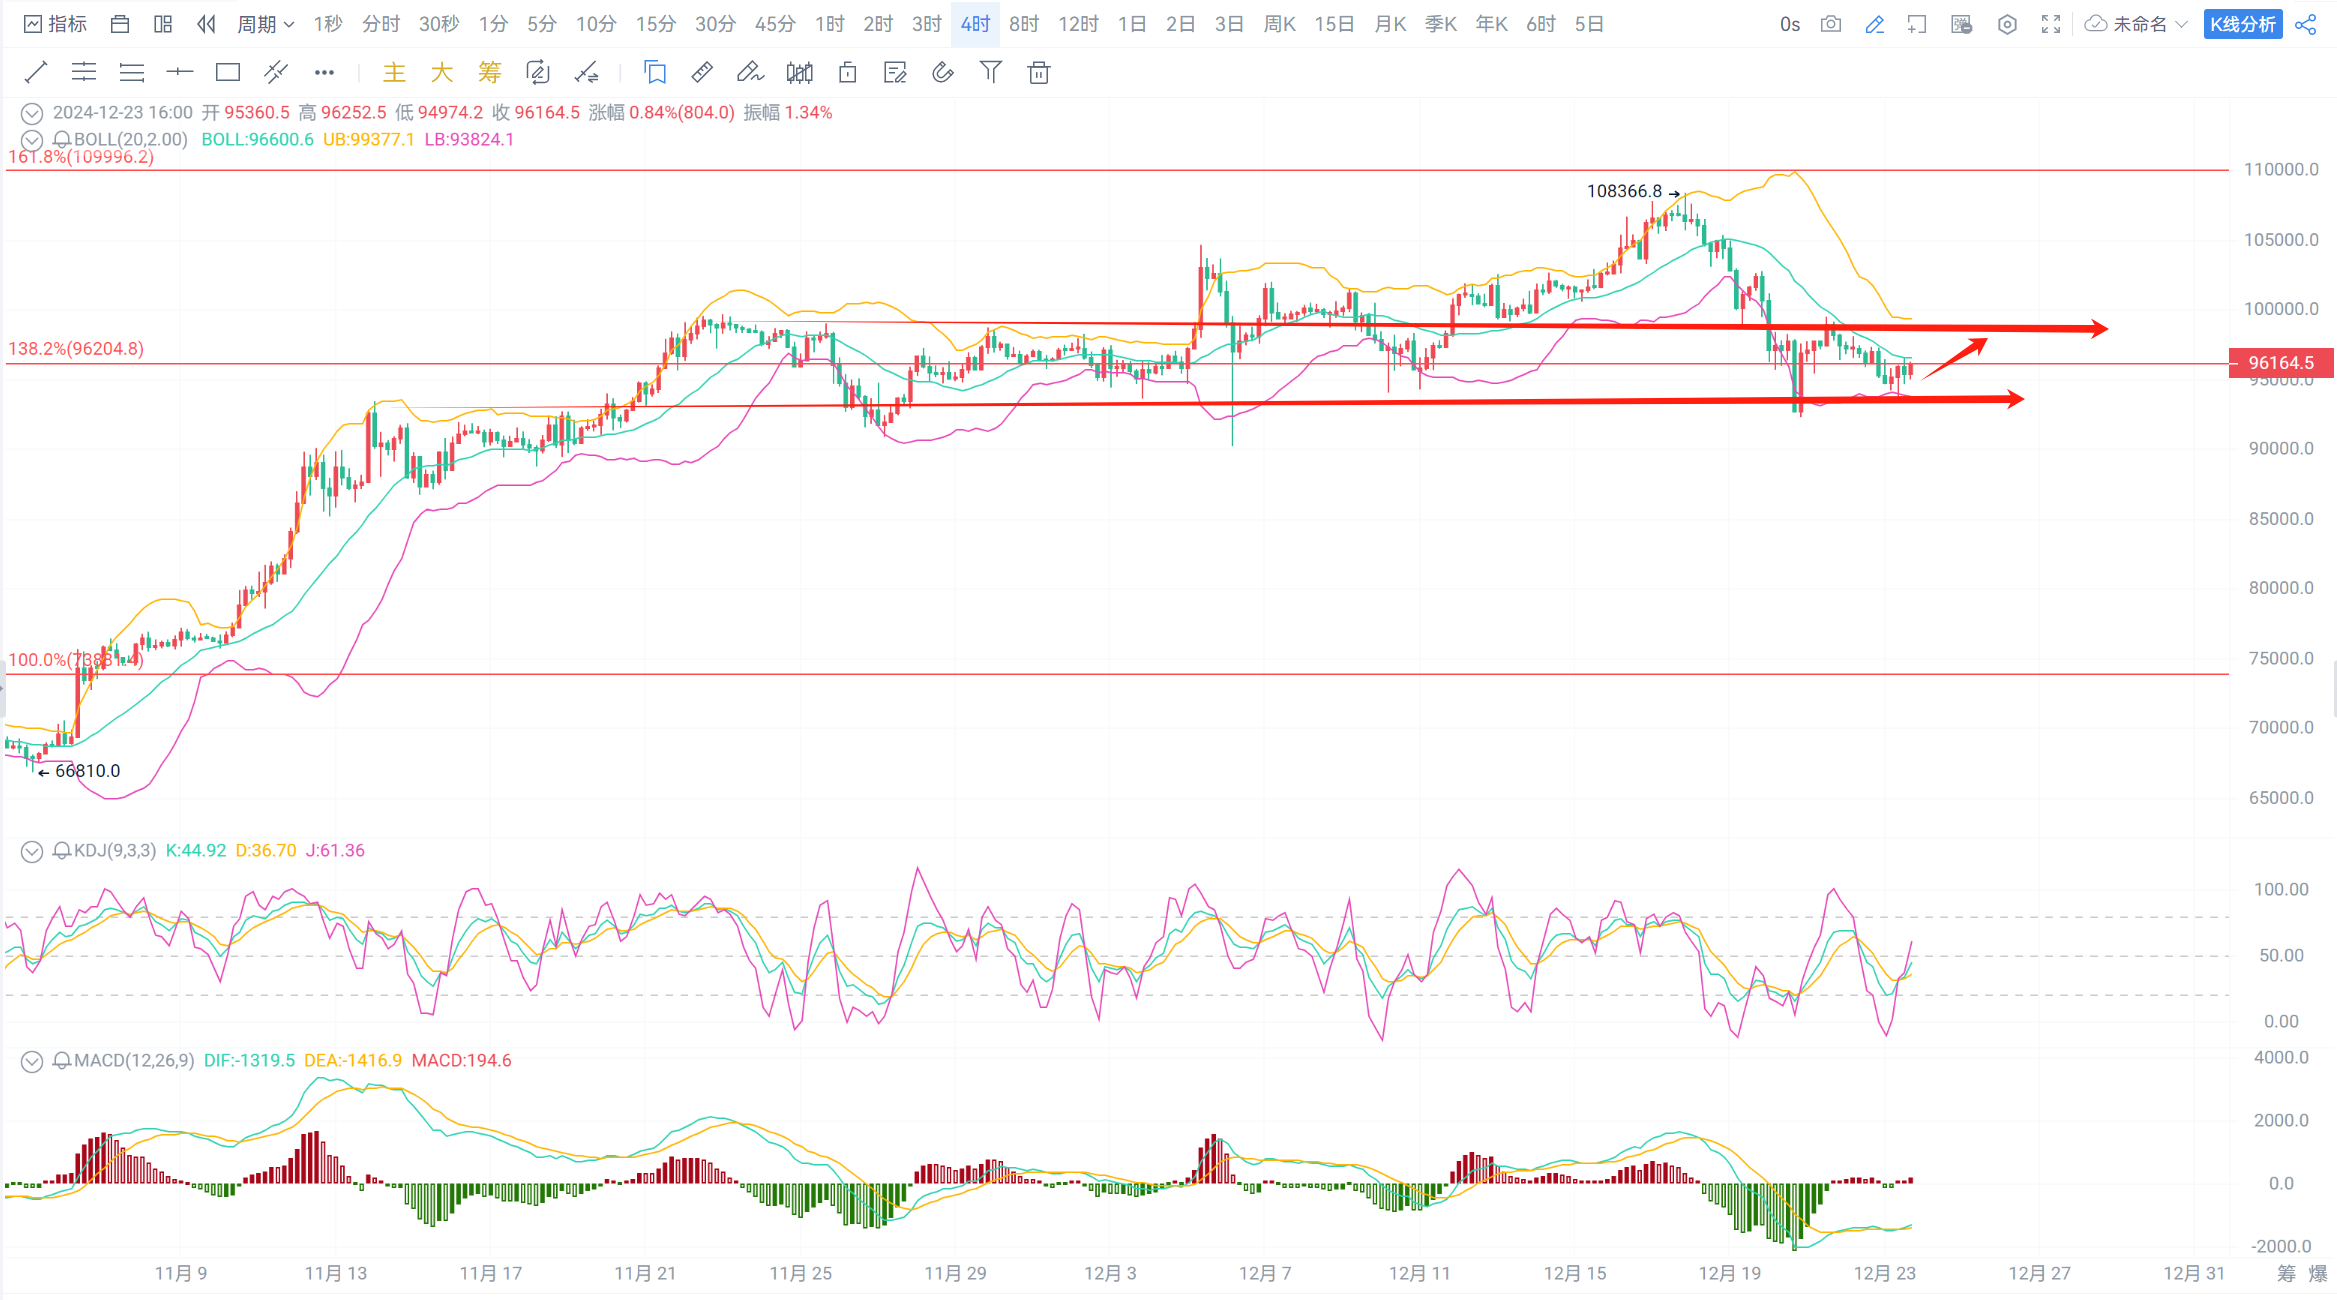
Technical Analysis: In terms of Bitcoin, the weekly chart shows a bearish candle, the Bollinger Bands continue to open upwards, the MACD moving averages are running flat, bullish volume continues to decrease, and the KDJ line is moving downwards. On the daily chart, it continues to show a bearish trend, the Bollinger Bands are starting to run flat, the MACD moving averages continue to move downwards, bearish volume continues to increase, and the KDJ line continues to move downwards. On the 4-hour chart, the Bollinger Bands are starting to run flat, the price is consistently below the middle band, the MACD moving averages are starting to move upwards, bullish volume continues to slightly increase, and the KDJ line is starting to move upwards;
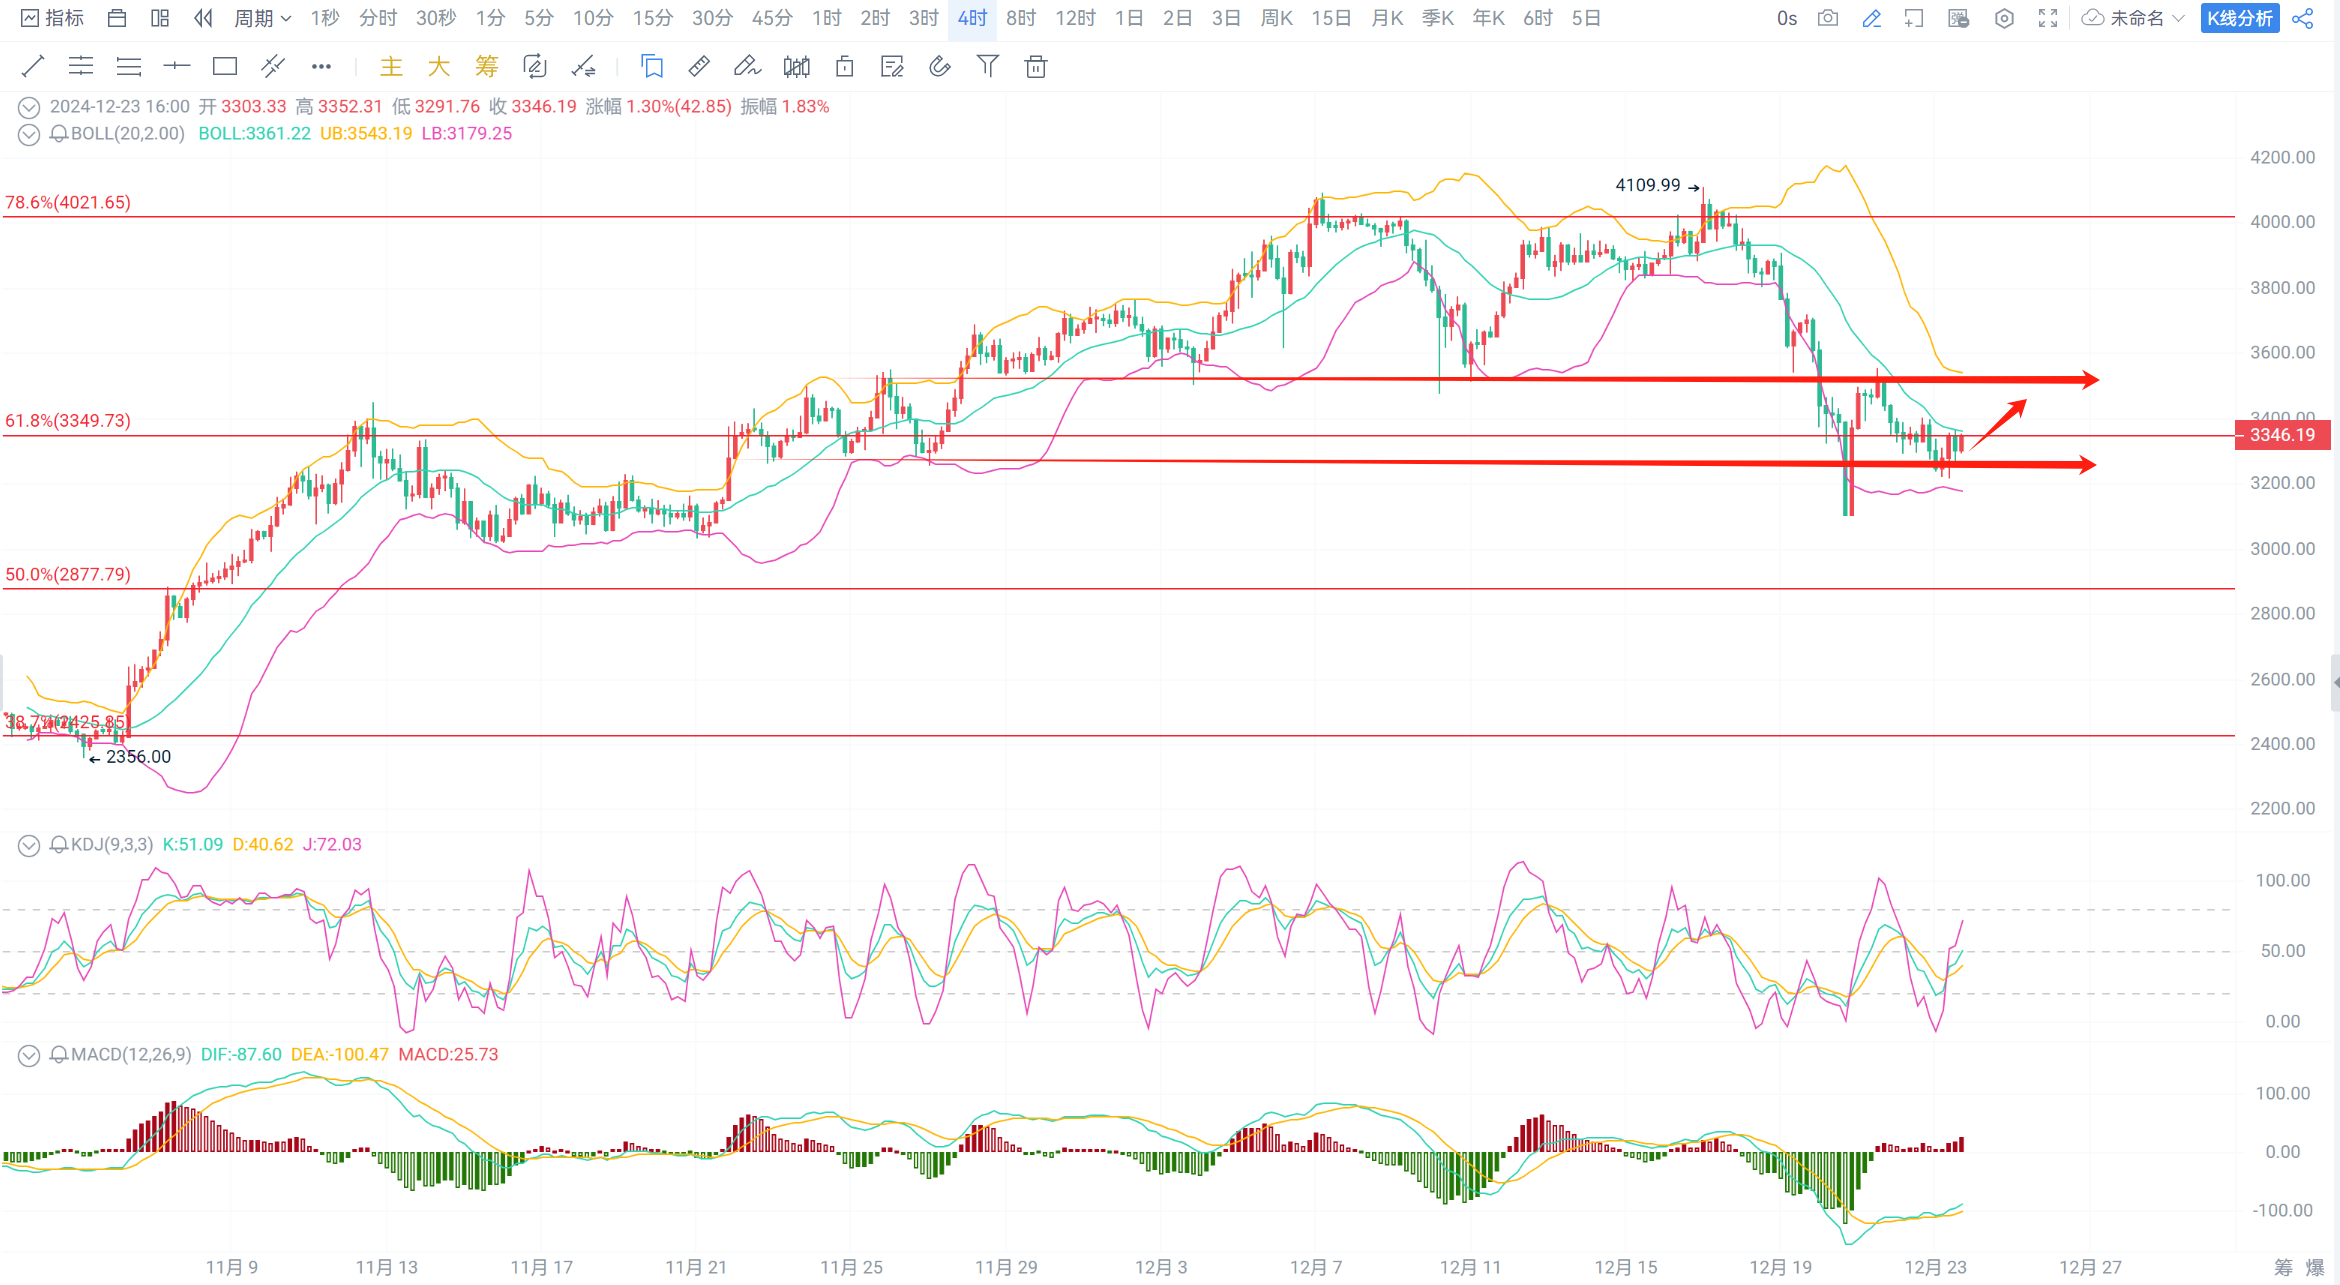
In terms of Ethereum, the weekly chart shows a large bearish candle, the Bollinger Bands continue to open upwards, the MACD moving averages are moving upwards, bullish volume continues to decrease, and the KDJ line is moving downwards. On the daily chart, it continues to show a bearish trend, the Bollinger Bands continue to open downwards, the MACD moving averages continue to move downwards, bearish volume continues to increase, and the KDJ line is moving downwards. On the 4-hour chart, the Bollinger Bands are starting to run flat, the MACD moving averages are moving upwards, bullish volume is increasing, and the KDJ line is moving upwards;
In summary, the overall market is in a downtrend. The short position in Bitcoin set up in the early morning successfully took profit, while Ethereum did not get filled. The current market is experiencing a rebound after a second dip, and it is expected that there will be some degree of recovery in the subsequent market, so aggressive trading can be considered!
Trading Advice: Aggressively go long!
Currently, go long in the Bitcoin range of 95700-96200, with a target of 97500-98500 and a stop loss at 95000;
Currently, go long in the Ethereum range of 3310-3340, with a target of 3400-3500 and a stop loss at 3280;
The strategy is time-sensitive, please refer to private real-time guidance for specifics!

免责声明:本文章仅代表作者个人观点,不代表本平台的立场和观点。本文章仅供信息分享,不构成对任何人的任何投资建议。用户与作者之间的任何争议,与本平台无关。如网页中刊载的文章或图片涉及侵权,请提供相关的权利证明和身份证明发送邮件到support@aicoin.com,本平台相关工作人员将会进行核查。


