I accidentally came across the "Top Escape Guide" written in 2022. Back then, I was just an enthusiastic data nerd, and looking back now, I should say that I completely didn't understand trends. This was my last long article unrelated to trends. Today, I read it carefully again, and aside from some naivety, there are indeed some data points that are helpful for escaping the peak.
Let's organize this (today we'll sort out the first part and update gradually):
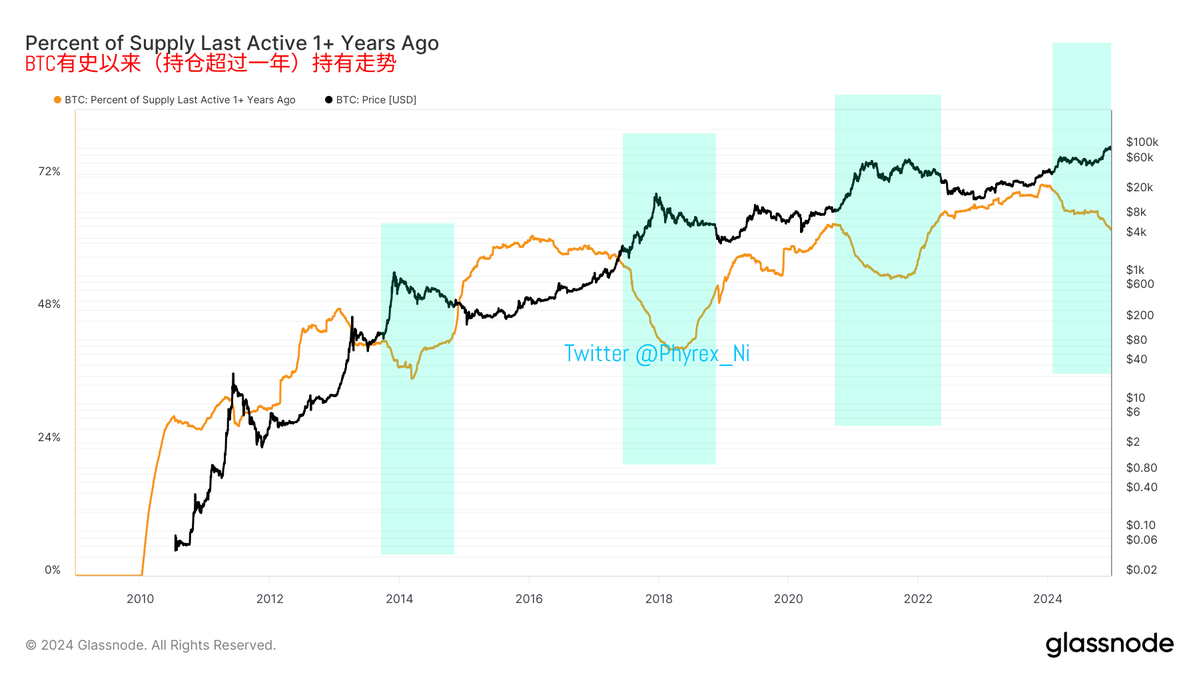
- The trend of long-term holders with positions exceeding one year.
This data is the only one that has not been falsified so far, and I still believe it is the most valuable reference data for escaping the peak. There are almost no exceptions, of course, I mean within "my" personal data system. I am just an ordinary person, and there may be many data points I am unaware of, so we won't argue about that. There may indeed be more effective data that I don't understand, but that will not be discussed here.
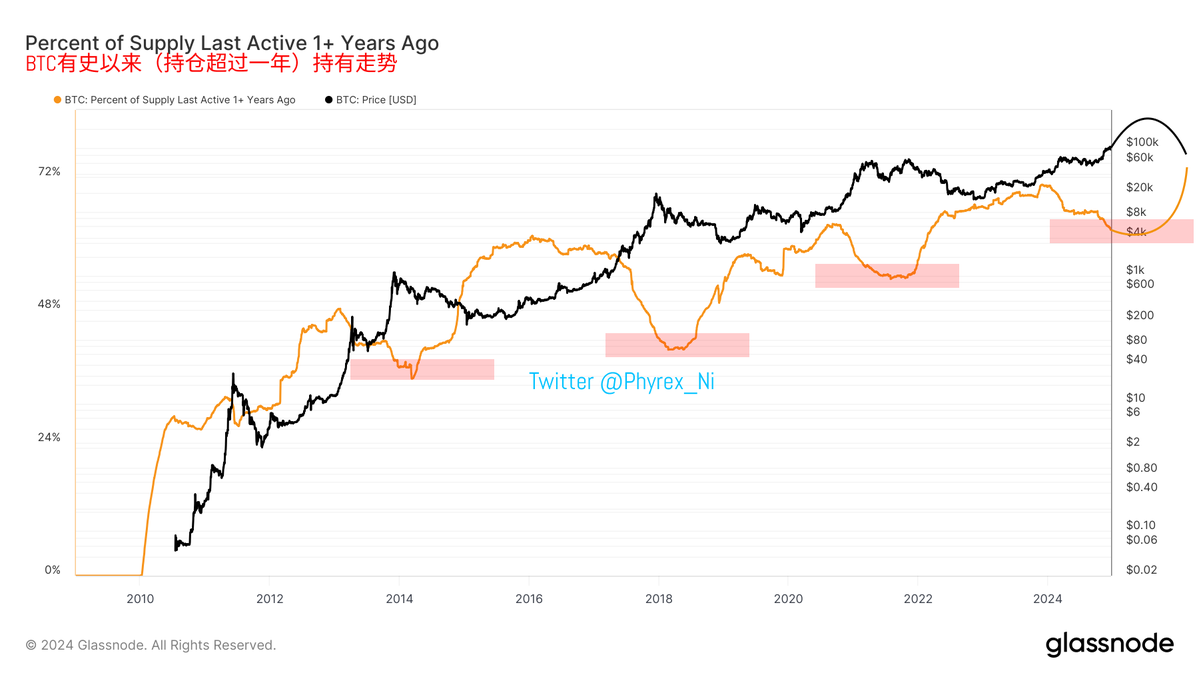
From the data, we can see that the four green intervals correspond to the peaks after each halving. The fourth one is the current cycle, which is clearly not yet complete. From the previous three cycles, we can see that when long-term holders with positions exceeding one year reduce their holdings to the bottom, it often corresponds to the peak price of #Bitcoin. I know many friends will say that the peak is when people sell, and that's true. Still, we are looking at the results, not arguing.
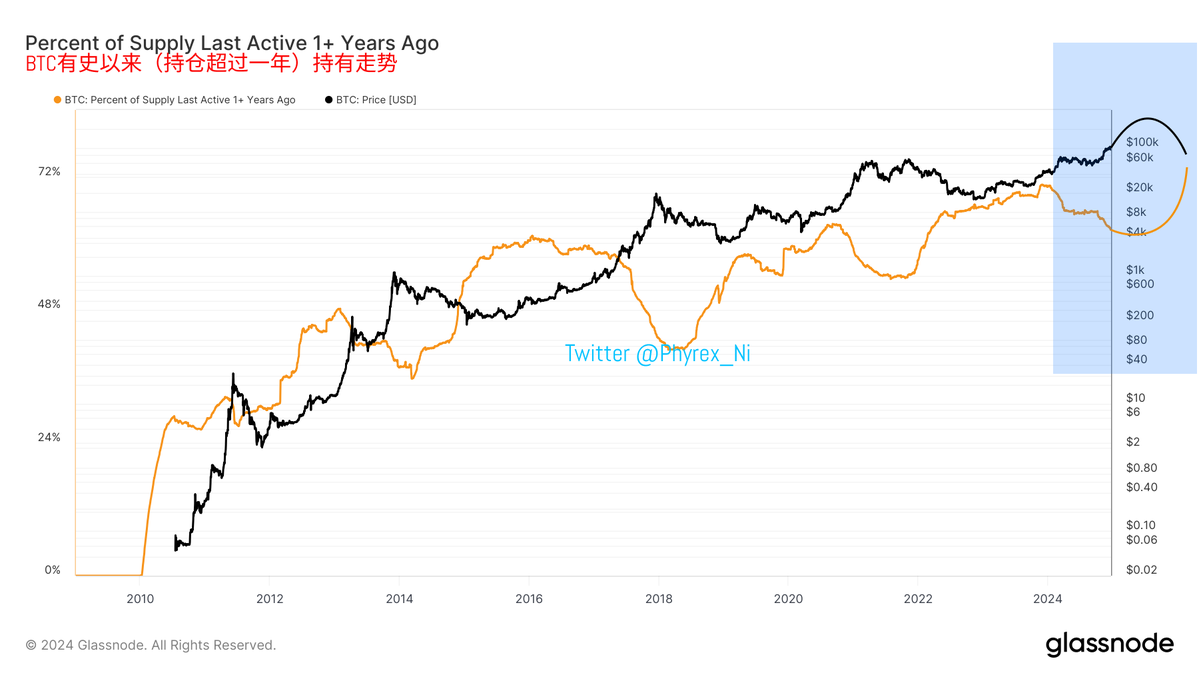
Whether it is the price high prompting long-term holders to exit or the exit of long-term holders leading to a price peak, they correspond one-to-one. I roughly sketched what I think the general trend looks like; please forgive my complete lack of talent in drawing. I drew a rough schematic of the trend, which has no corresponding relationship with the price. From a cyclical perspective, we should now be entering the 20% to 30% stage of the bull market cycle, with about 30% left to the peak.
Moreover, even when it comes to escaping the peak, it should correspond to a long-term holder's "rounded bottom" position, rather than a one-time event. Of course, this does not mean selling at the highest point, but rather within the highest range. For example, if $110,000 is the highest point, the rounded top should correspond to between $100,000 and $110,000.
So from this perspective, the bull market is likely to last for about another 3 months before starting to decline. Although it is still a bull market, it is already at the end of the bull market.
Of course, all these data points are merely theoretical and cannot provide the most direct results. Whether these data can even be applied in the current cycle is also a question mark, as this cycle is very different. Firstly, it is the first halving cycle coinciding with monetary tightening. Secondly, it is the first halving cycle with a large influx of off-exchange funds through spot ETFs, and it is also a cycle where the U.S. stock market ($MSTR) and #BTC are mutually influencing each other.
More importantly, the biggest uncertainty in this cycle is the potential re-election of Trump. From the president to the vice president, from the SEC chair to the CFTC chair, including the heads of the White House and the Economic Advisory Council, all are individuals who are friendly to cryptocurrency and have a thorough understanding of it. Moreover, the Republican Party has already begun to promote the development of cryptocurrency in the U.S. even before being elected. Therefore, the theoretical approach to data may not be 100% applicable; it is more important to focus on trends, macroeconomic conditions, and economic movements.
This post is sponsored by @ApeXProtocolCN | Dex With ApeX
免责声明:本文章仅代表作者个人观点,不代表本平台的立场和观点。本文章仅供信息分享,不构成对任何人的任何投资建议。用户与作者之间的任何争议,与本平台无关。如网页中刊载的文章或图片涉及侵权,请提供相关的权利证明和身份证明发送邮件到support@aicoin.com,本平台相关工作人员将会进行核查。


