Trading Philosophy: Look for trends in the long term, find entry points in the short term;
Technical Analysis: For Bitcoin, the daily chart continues to close with a bearish candle, the Bollinger Bands are starting to run flat, the MACD moving average continues to trend downward, bearish volume continues to increase, and the KDJ line continues to trend downward. On the 4-hour chart, the Bollinger Bands continue to narrow down, the price is consistently running below the middle band, the MACD moving average is gently trending upward, bullish volume is slightly increasing, and the KDJ line is diverging downward;
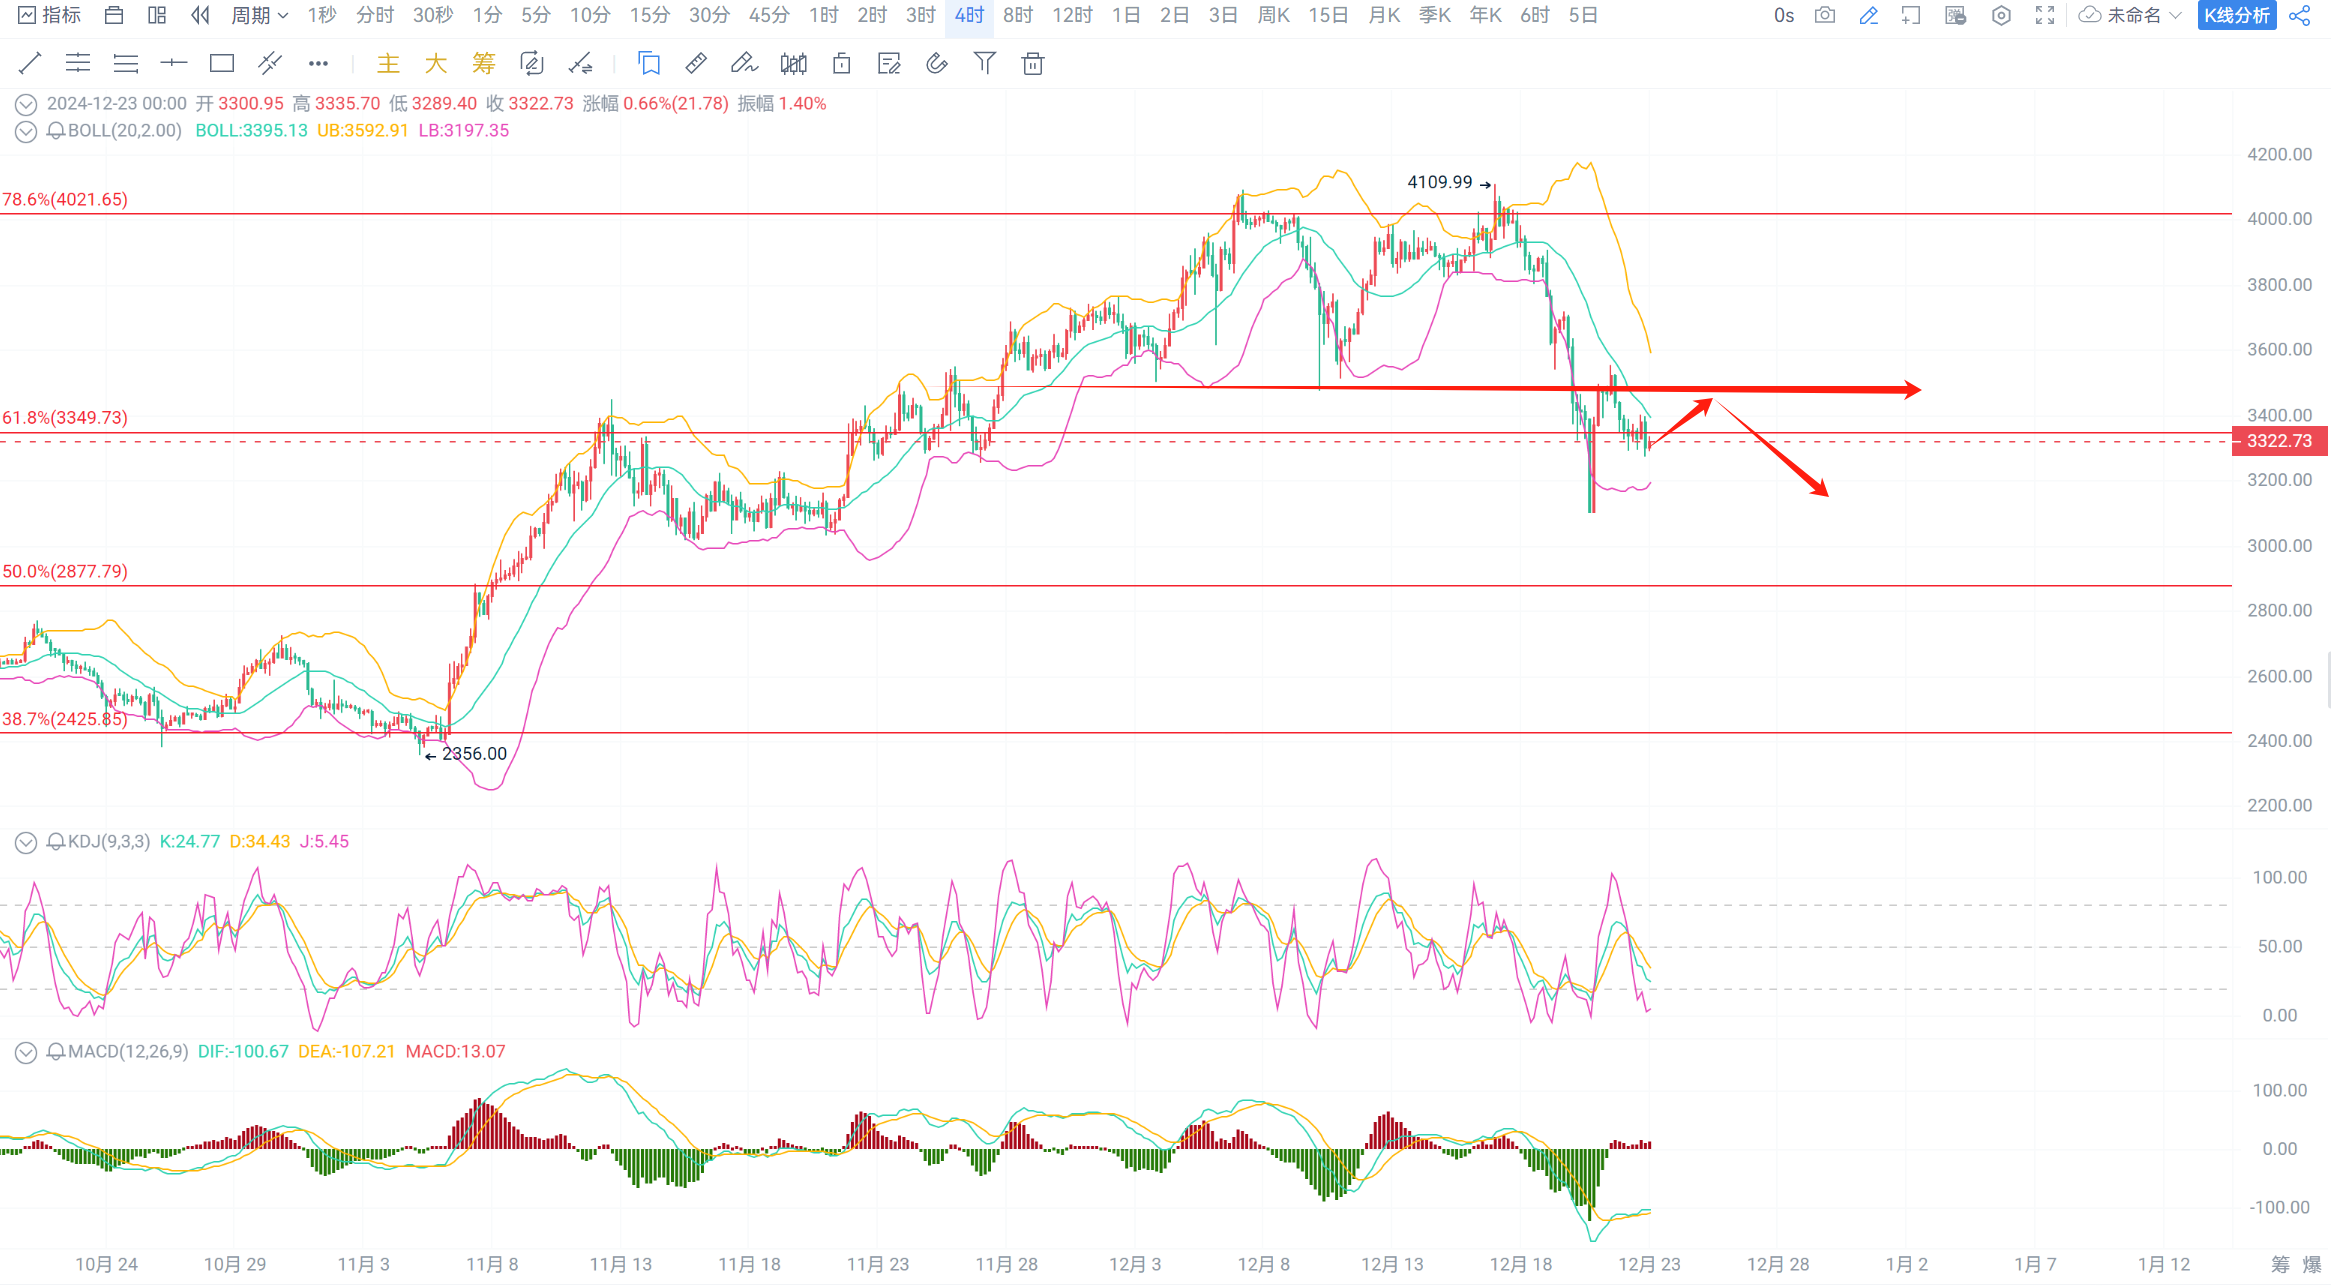
For Ethereum, the daily chart continues to close with a bearish candle, the Bollinger Bands continue to open downward, the MACD moving average continues to trend downward, bearish volume continues to increase, and the KDJ line is trending downward. On the 4-hour chart, the Bollinger Bands continue to narrow down, the MACD moving average is gently trending upward, bullish volume is increasing, and the KDJ line is diverging downward;

In summary, since the Federal Reserve's interest rate announcement, the market has been in a downward trend, and the rebounds have been relatively weak. It is advisable to maintain a cautious approach and focus on short positions!
Operational Suggestions: Short at high levels!
Short Bitcoin in the 96500-97000 range, with a target of 95500-93000 and a stop loss at 98000;
Short Ethereum in the 3380-3410 range, with a target of 3300-3200 and a stop loss at 3450;
The strategy is time-sensitive, and specific guidance should be based on real-time private advice!

免责声明:本文章仅代表作者个人观点,不代表本平台的立场和观点。本文章仅供信息分享,不构成对任何人的任何投资建议。用户与作者之间的任何争议,与本平台无关。如网页中刊载的文章或图片涉及侵权,请提供相关的权利证明和身份证明发送邮件到support@aicoin.com,本平台相关工作人员将会进行核查。


