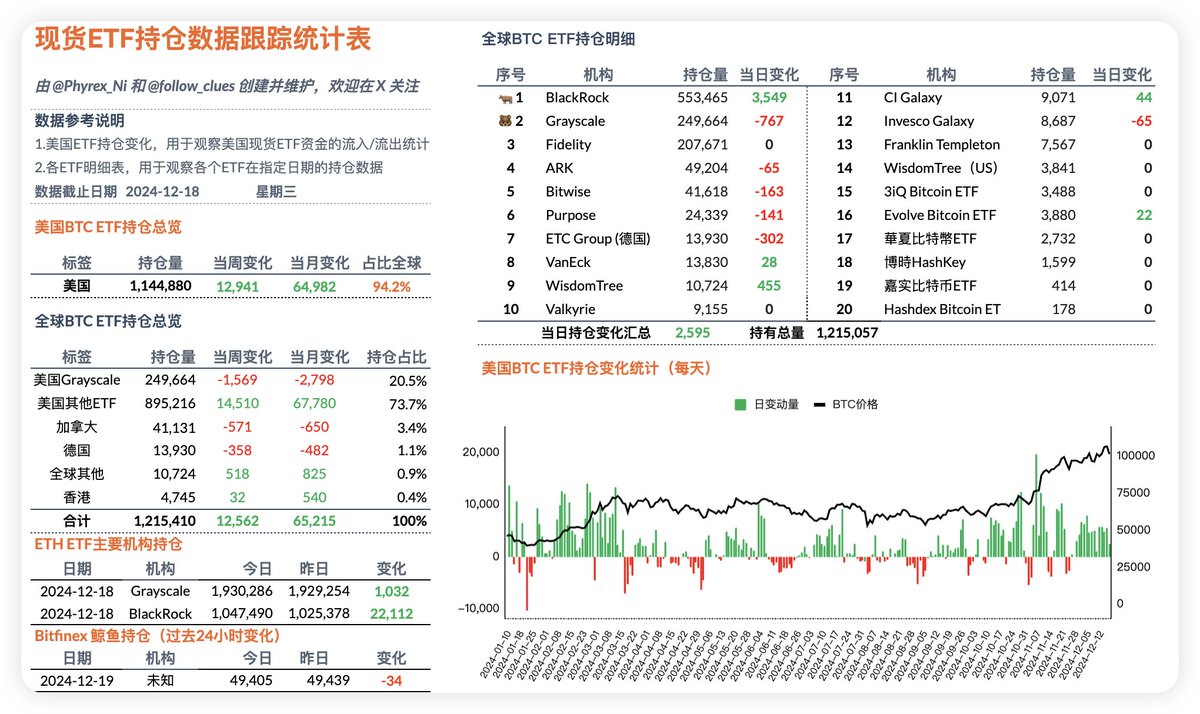
The data for BTC is similar to that of ETH, and there is still a discrepancy between the funding data and what is published on the official website. It seems that tonight's data will likely look bad, but yesterday's data was quite good. BlackRock continues to lead the main buying power for BTC, and Grayscale's Mini ETF also saw net inflows, although it can be considered negligible. The largest selling pressure comes from Grayscale's GBTC, which is only about 800 BTC, still not a lot. In the past 24 hours, the twelve ETFs in the U.S. have seen a net inflow of 2,516 BTC.
Some friends who do not delve deeply into the content often ask why the net inflow data shows BTC prices falling. Let me explain again: first, the amount from the ETF is really not enough compared to the BTC traded on exchanges. Secondly, ETF buying and selling do not necessarily require market purchases or sales when settled in coin terms; as long as the quantities match, it is fine.
In simpler terms, AP can completely sell its existing BTC when users buy in and buy the users' selling pressure when they sell. This is also a reason for the potential inverse effect on prices. Additionally, AP's buying and selling do not necessarily occur only in the secondary market; OTC transactions are also possible, given the T+1 settlement cycle.
Therefore, ETF data can at most be seen as a tracking of U.S. investor sentiment and does not represent price changes. Although it may seem convoluted, this is the reality.
The data has been updated, address: https://docs.google.com/spreadsheets/d/1N8YIm1ZzDN197hMAlkuvH3BgFb8es0x1y4AJLCbDPbc/edit?usp=sharing
This tweet is sponsored by @ApeXProtocolCN | Dex With ApeX
免责声明:本文章仅代表作者个人观点,不代表本平台的立场和观点。本文章仅供信息分享,不构成对任何人的任何投资建议。用户与作者之间的任何争议,与本平台无关。如网页中刊载的文章或图片涉及侵权,请提供相关的权利证明和身份证明发送邮件到support@aicoin.com,本平台相关工作人员将会进行核查。


