On December 12 at 16:00, the AICoin editor conducted a graphic and text sharing session on the topic of [TD, BOLL, and other indicator mixing strategies]. Below is a summary of the live content.
In the last live session, a friend mentioned wanting to see the usage of the TD and BOLL indicators, so this time the editor will first discuss these two indicators.
1. TD+BOLL
The TD indicator, also known as the magical nine turns, is a reversal indicator.
Green TD9 indicates overbought, which is a sell signal; red TD9 indicates oversold, which is a buy signal.
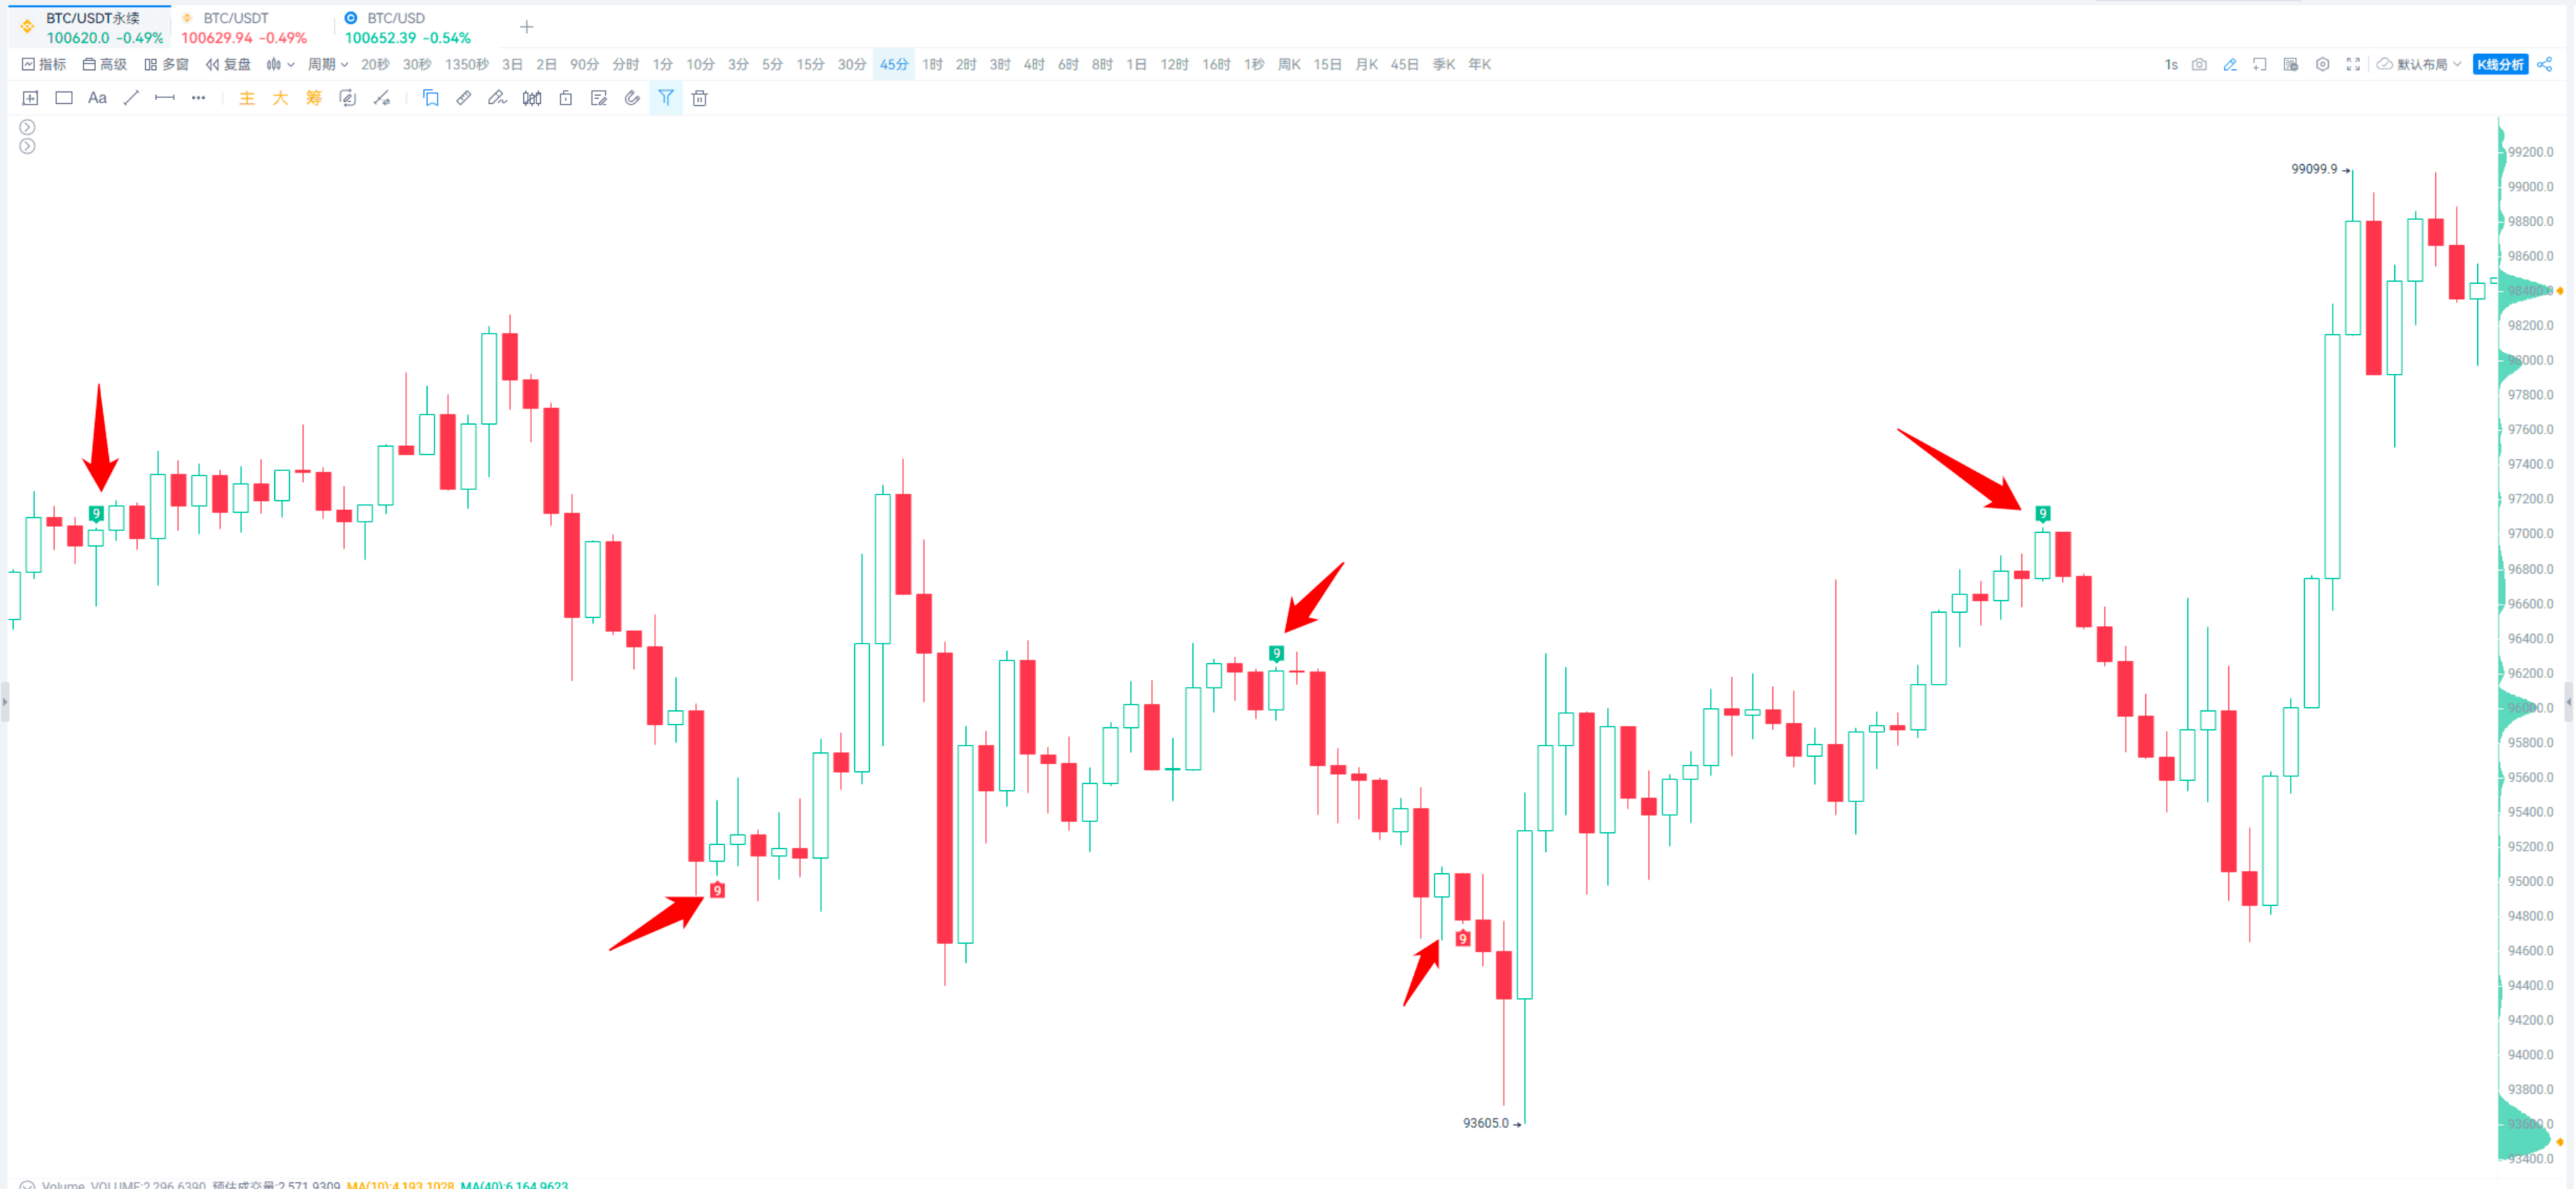
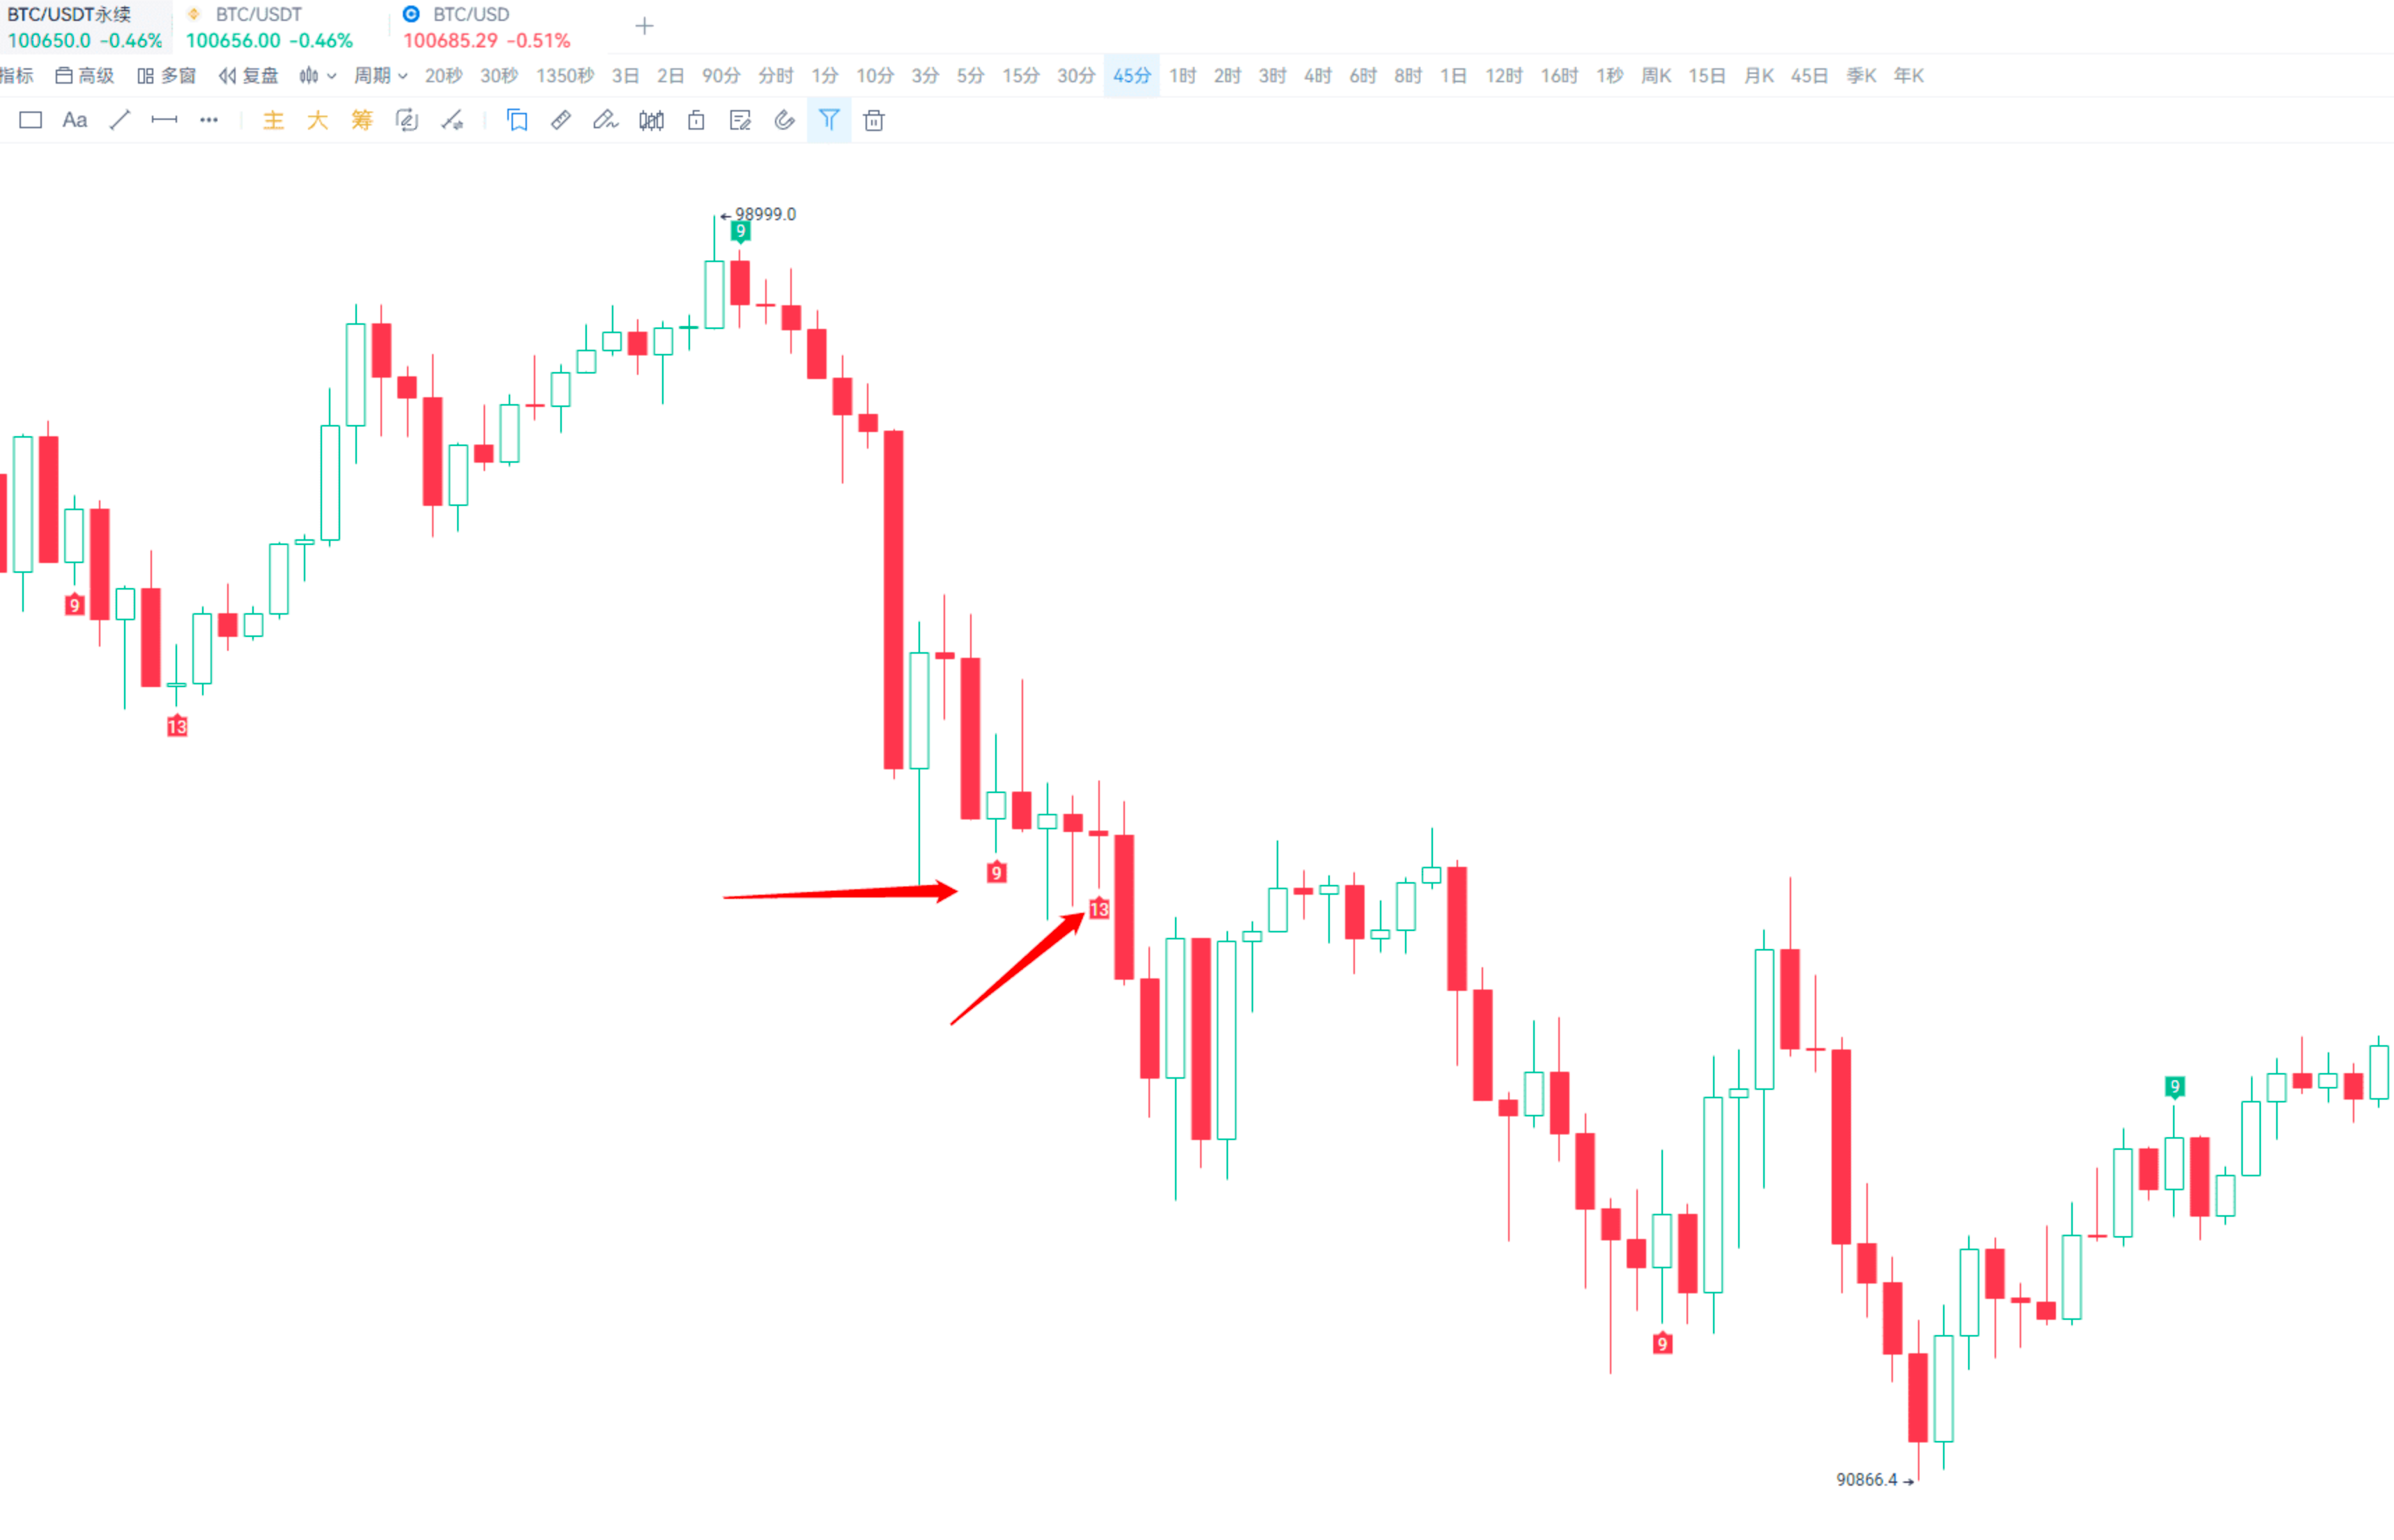
The TD indicator is suitable for oscillating markets, while in a trending market, it needs to be used in conjunction with other indicators.
For instance, in a one-sided downtrend, the TD indicator is not suitable.
It can be combined with trend indicators, taking the BOLL indicator as an example.
BOLL, the Bollinger Bands indicator, belongs to price channel indicators (trend indicators).
BOLL can be used to determine support and resistance, with the upper band as resistance and the lower band as support.
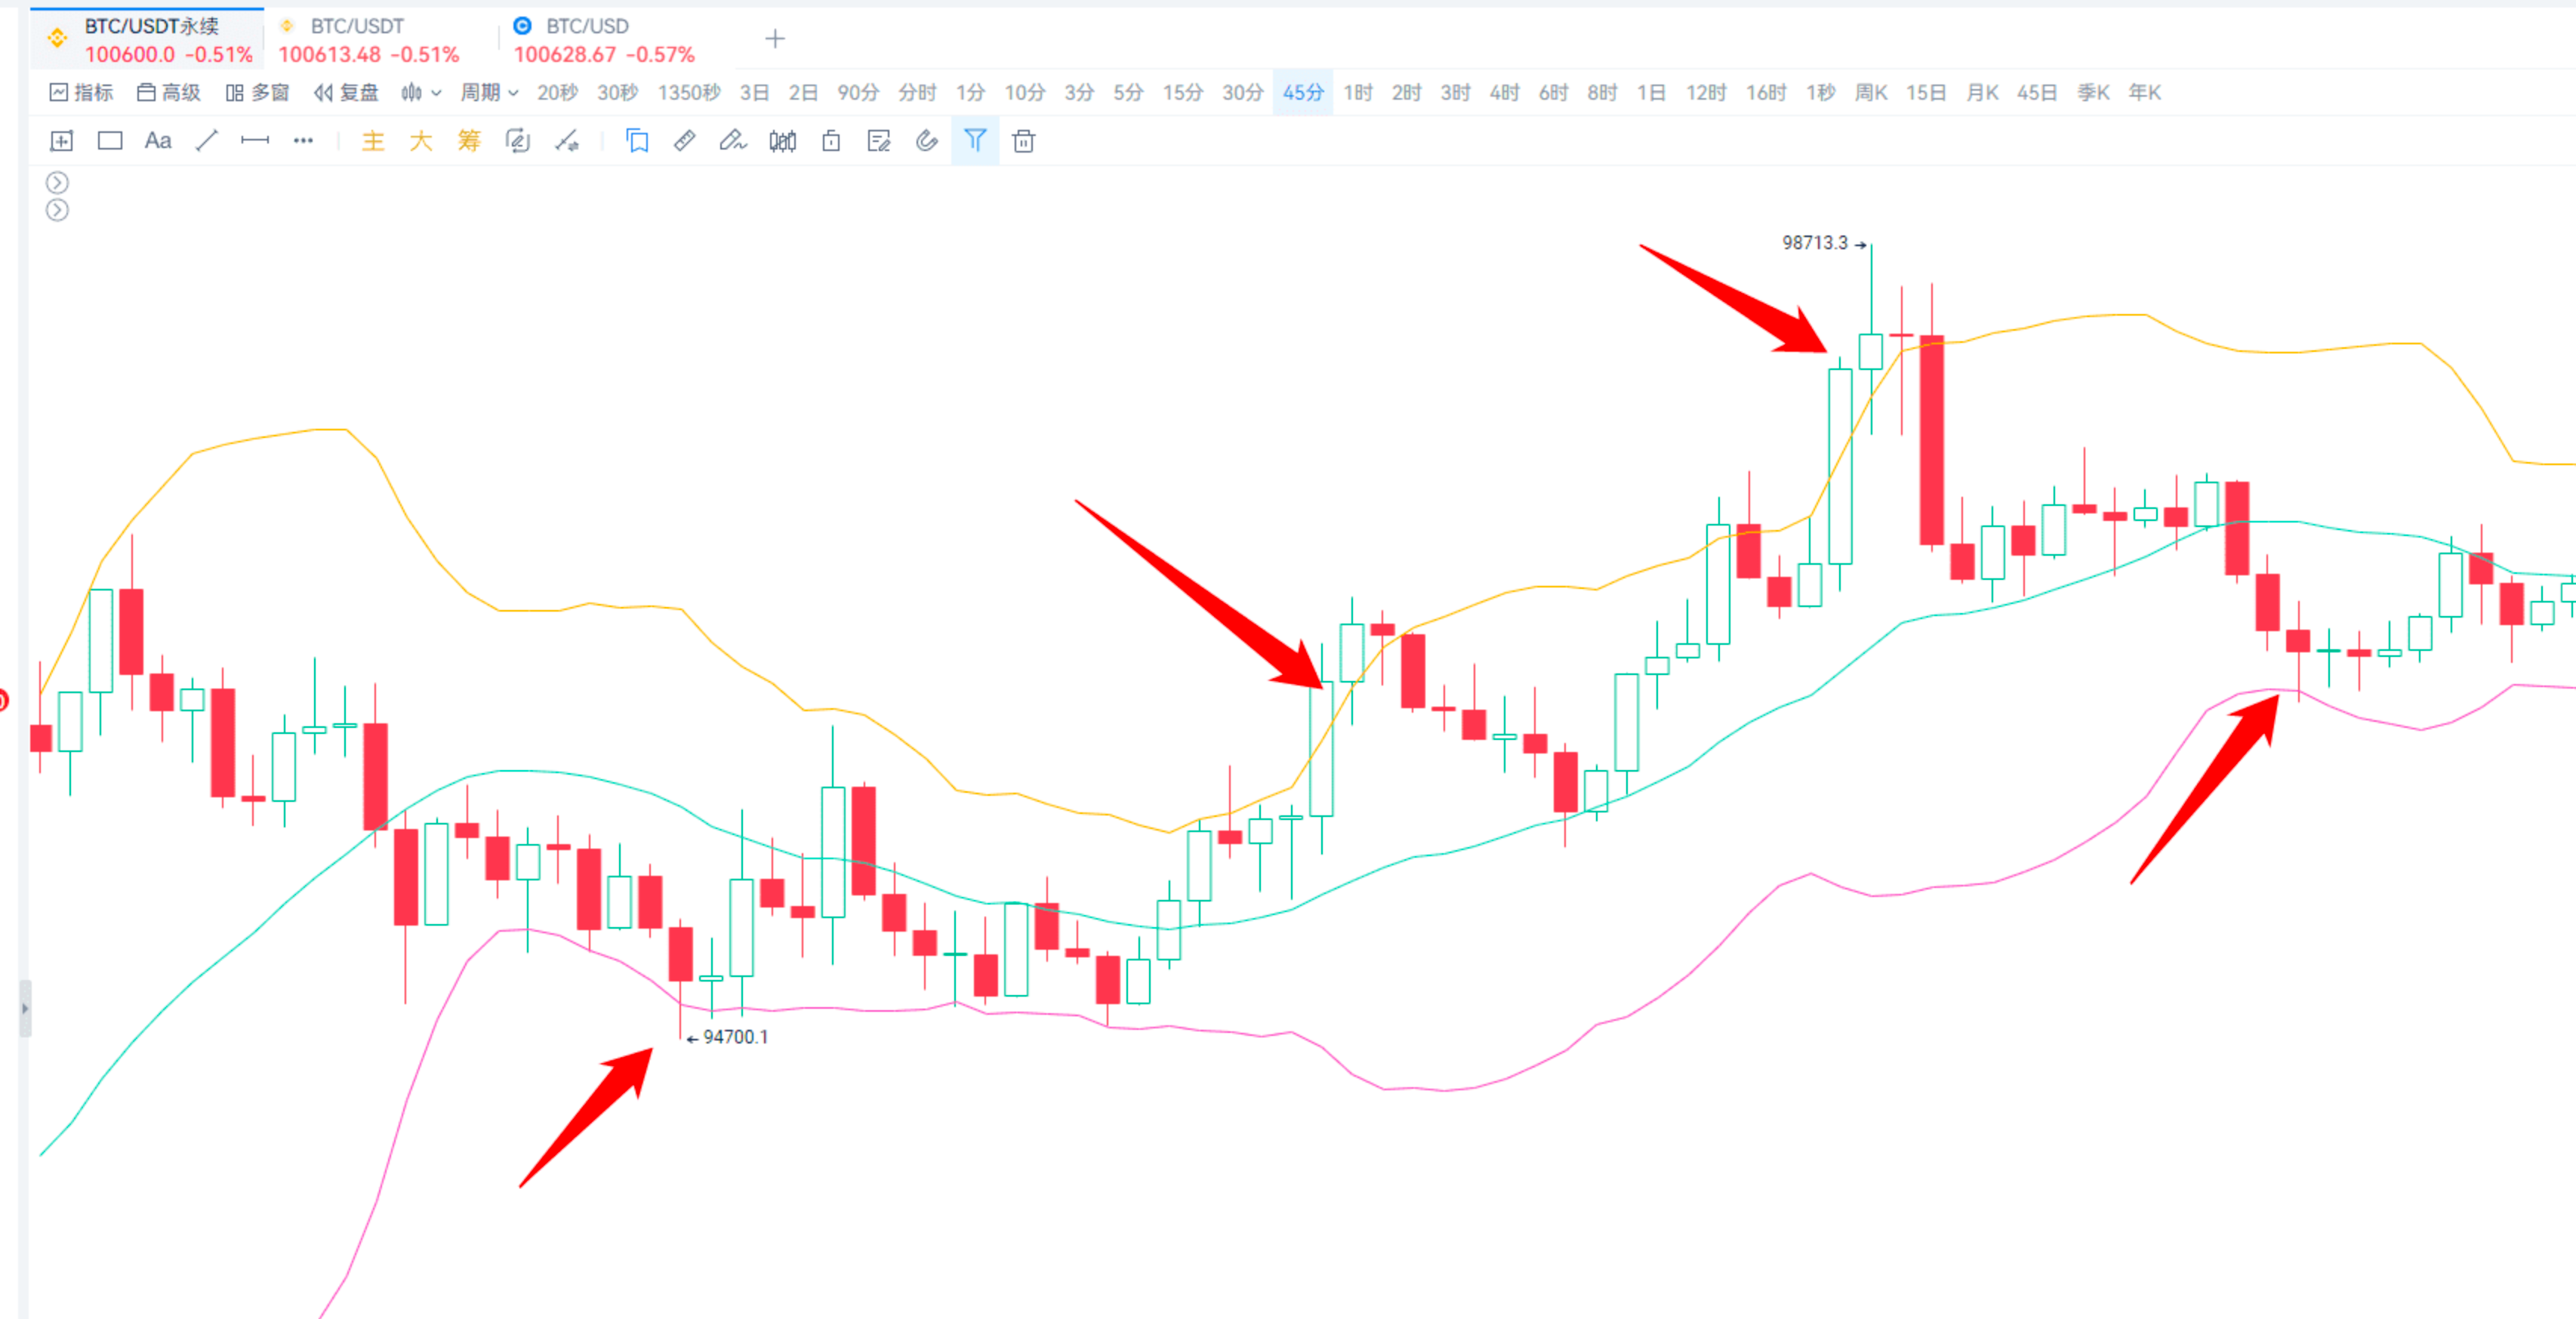
When combining the TD indicator with the BOLL indicator, we look for oversold and overbought resonance.
To supplement the BOLL overbought and oversold judgment: crossing above the upper band is considered overbought, which is a signal to sell; crossing below the lower band is considered oversold, which is a signal to buy.
As shown in the image, this can improve the win rate to a certain extent.
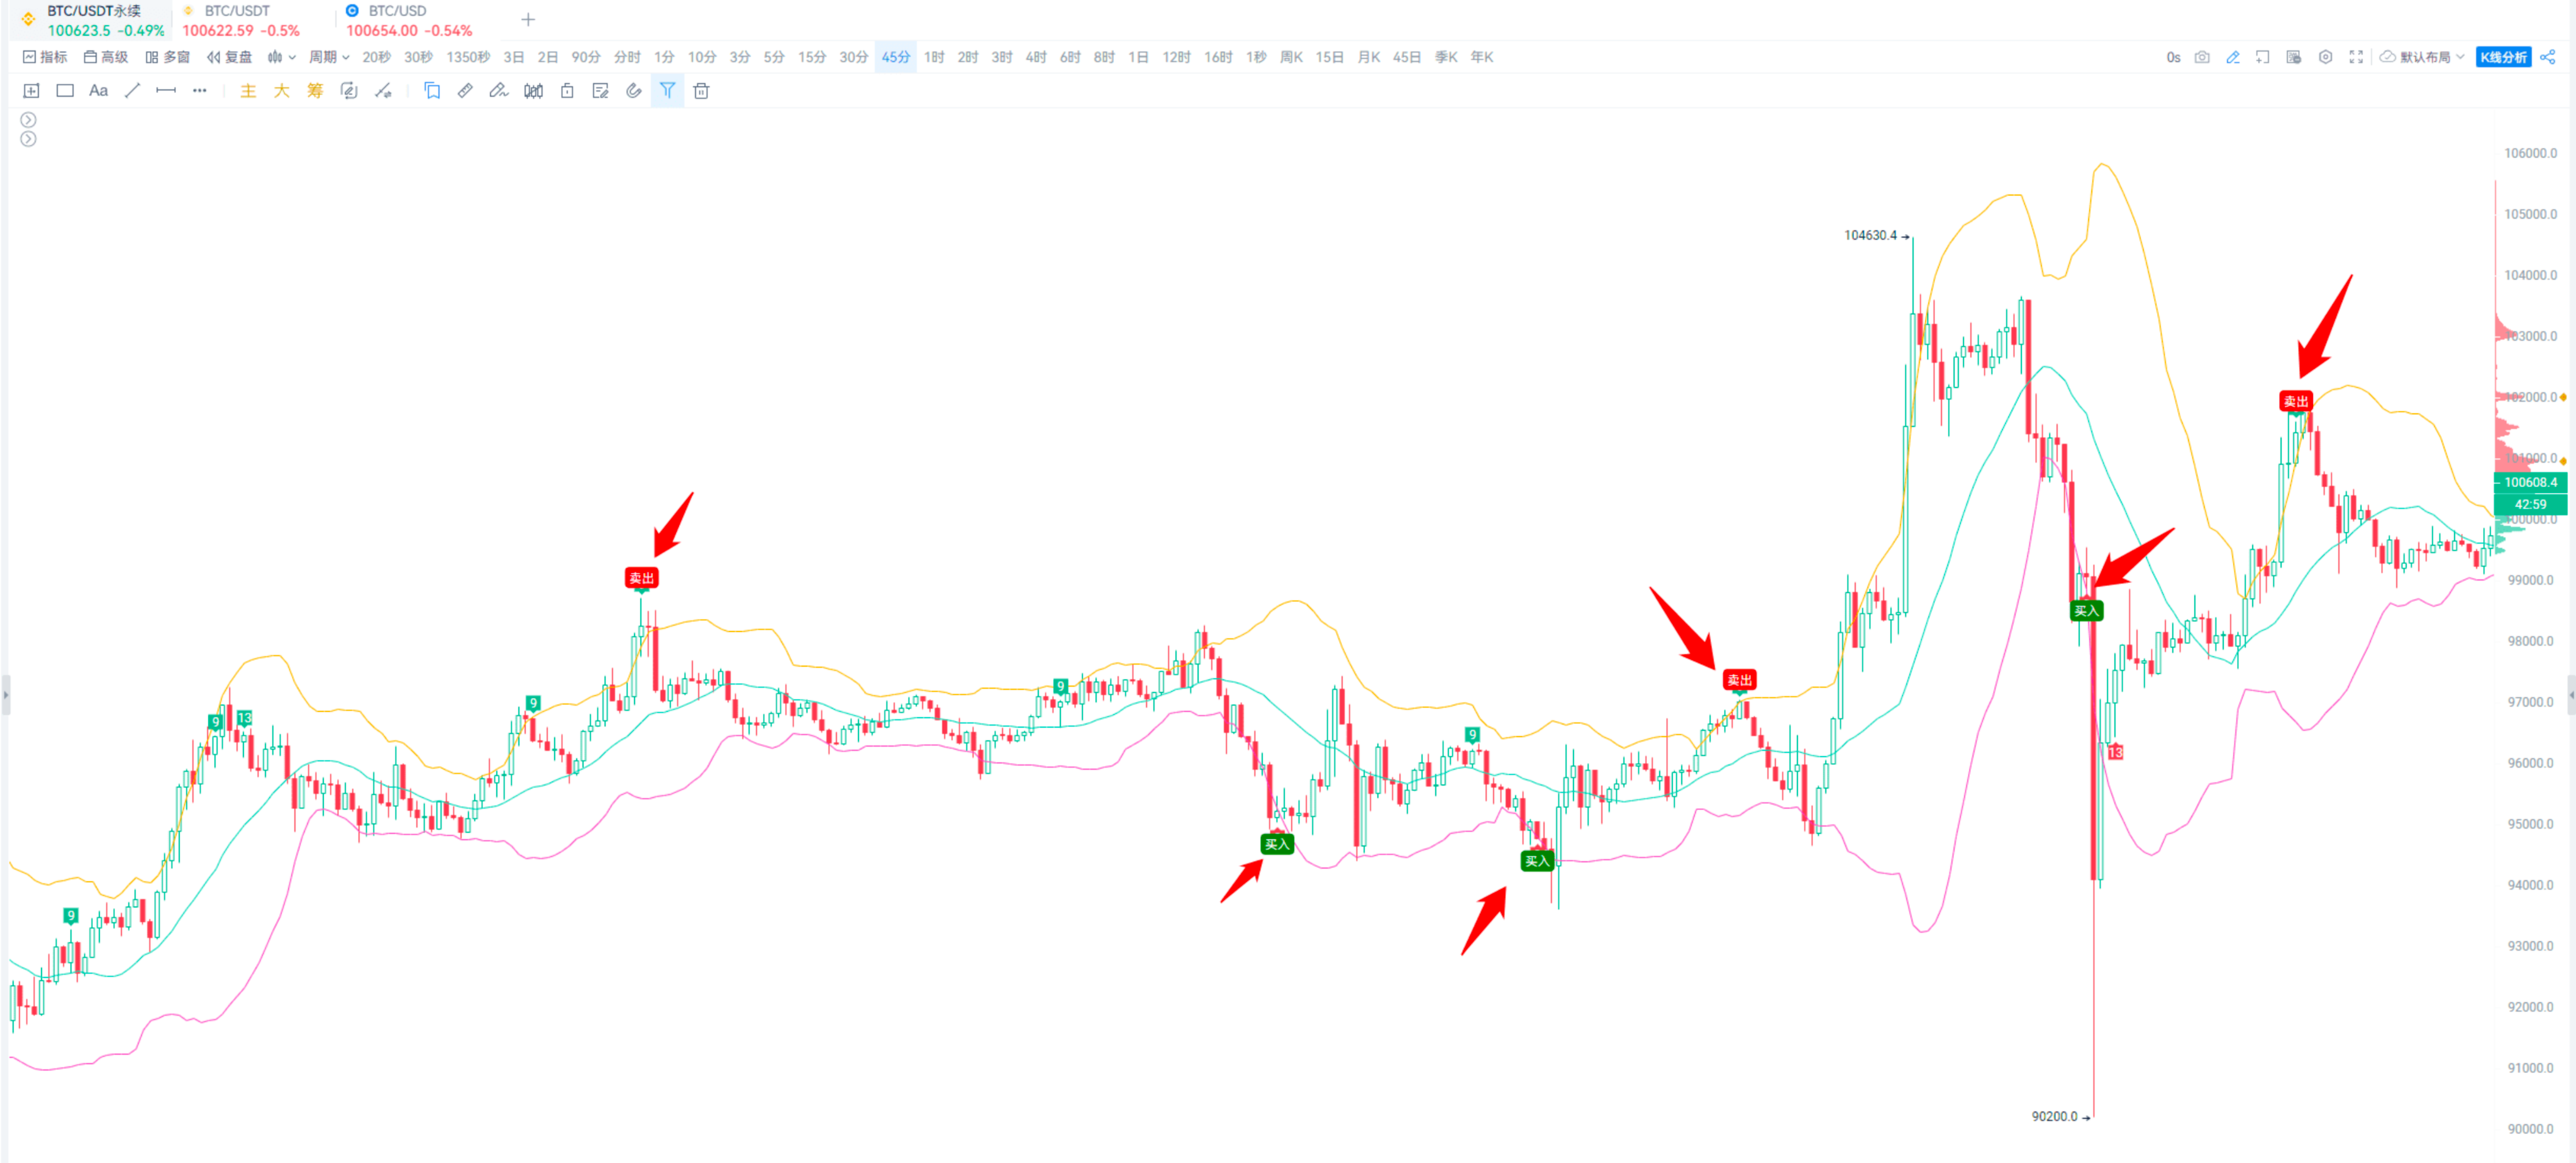
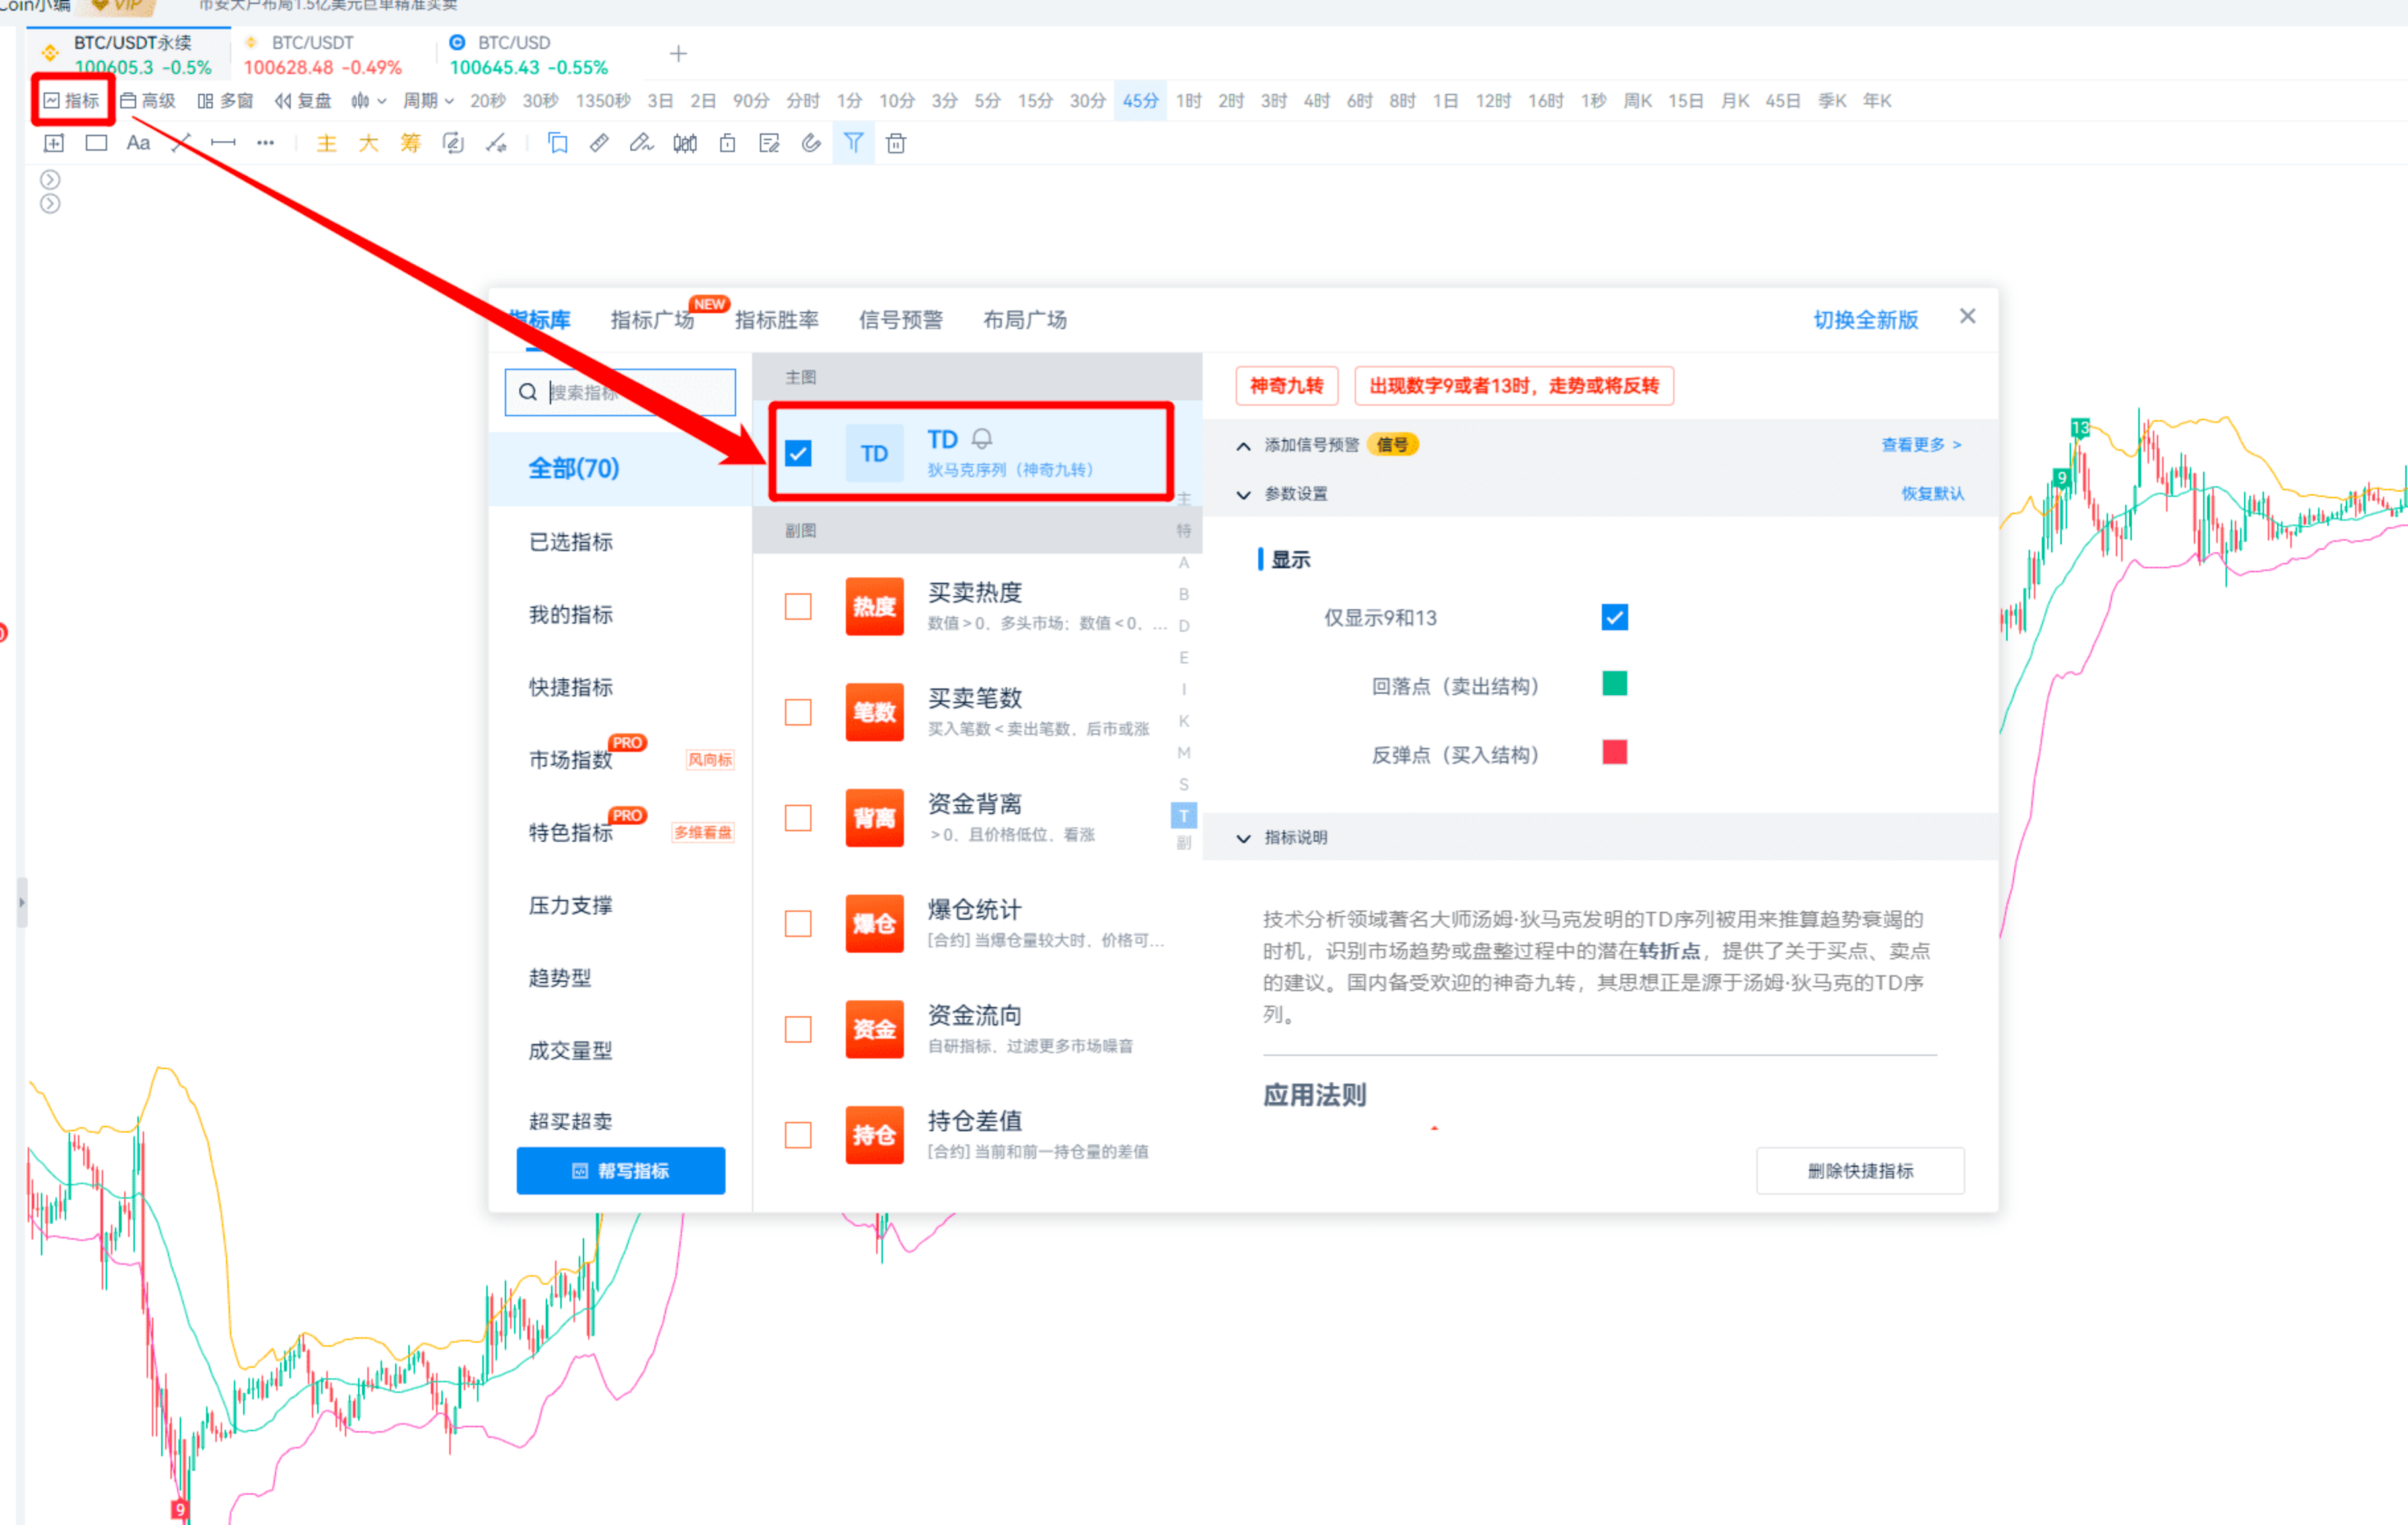
The TD and BOLL indicators can be selected for use in the indicator library.
However, compared to using the BOLL indicator, trading in the direction of the trend will yield better results.
TD9 or TD13 are both reversal signals.
2. TD Indicator Trend Trading Method
This involves using reversal signals in conjunction with indicators like MACD divergence, RSI overbought/oversold, or divergence.
Taking MACD as an example
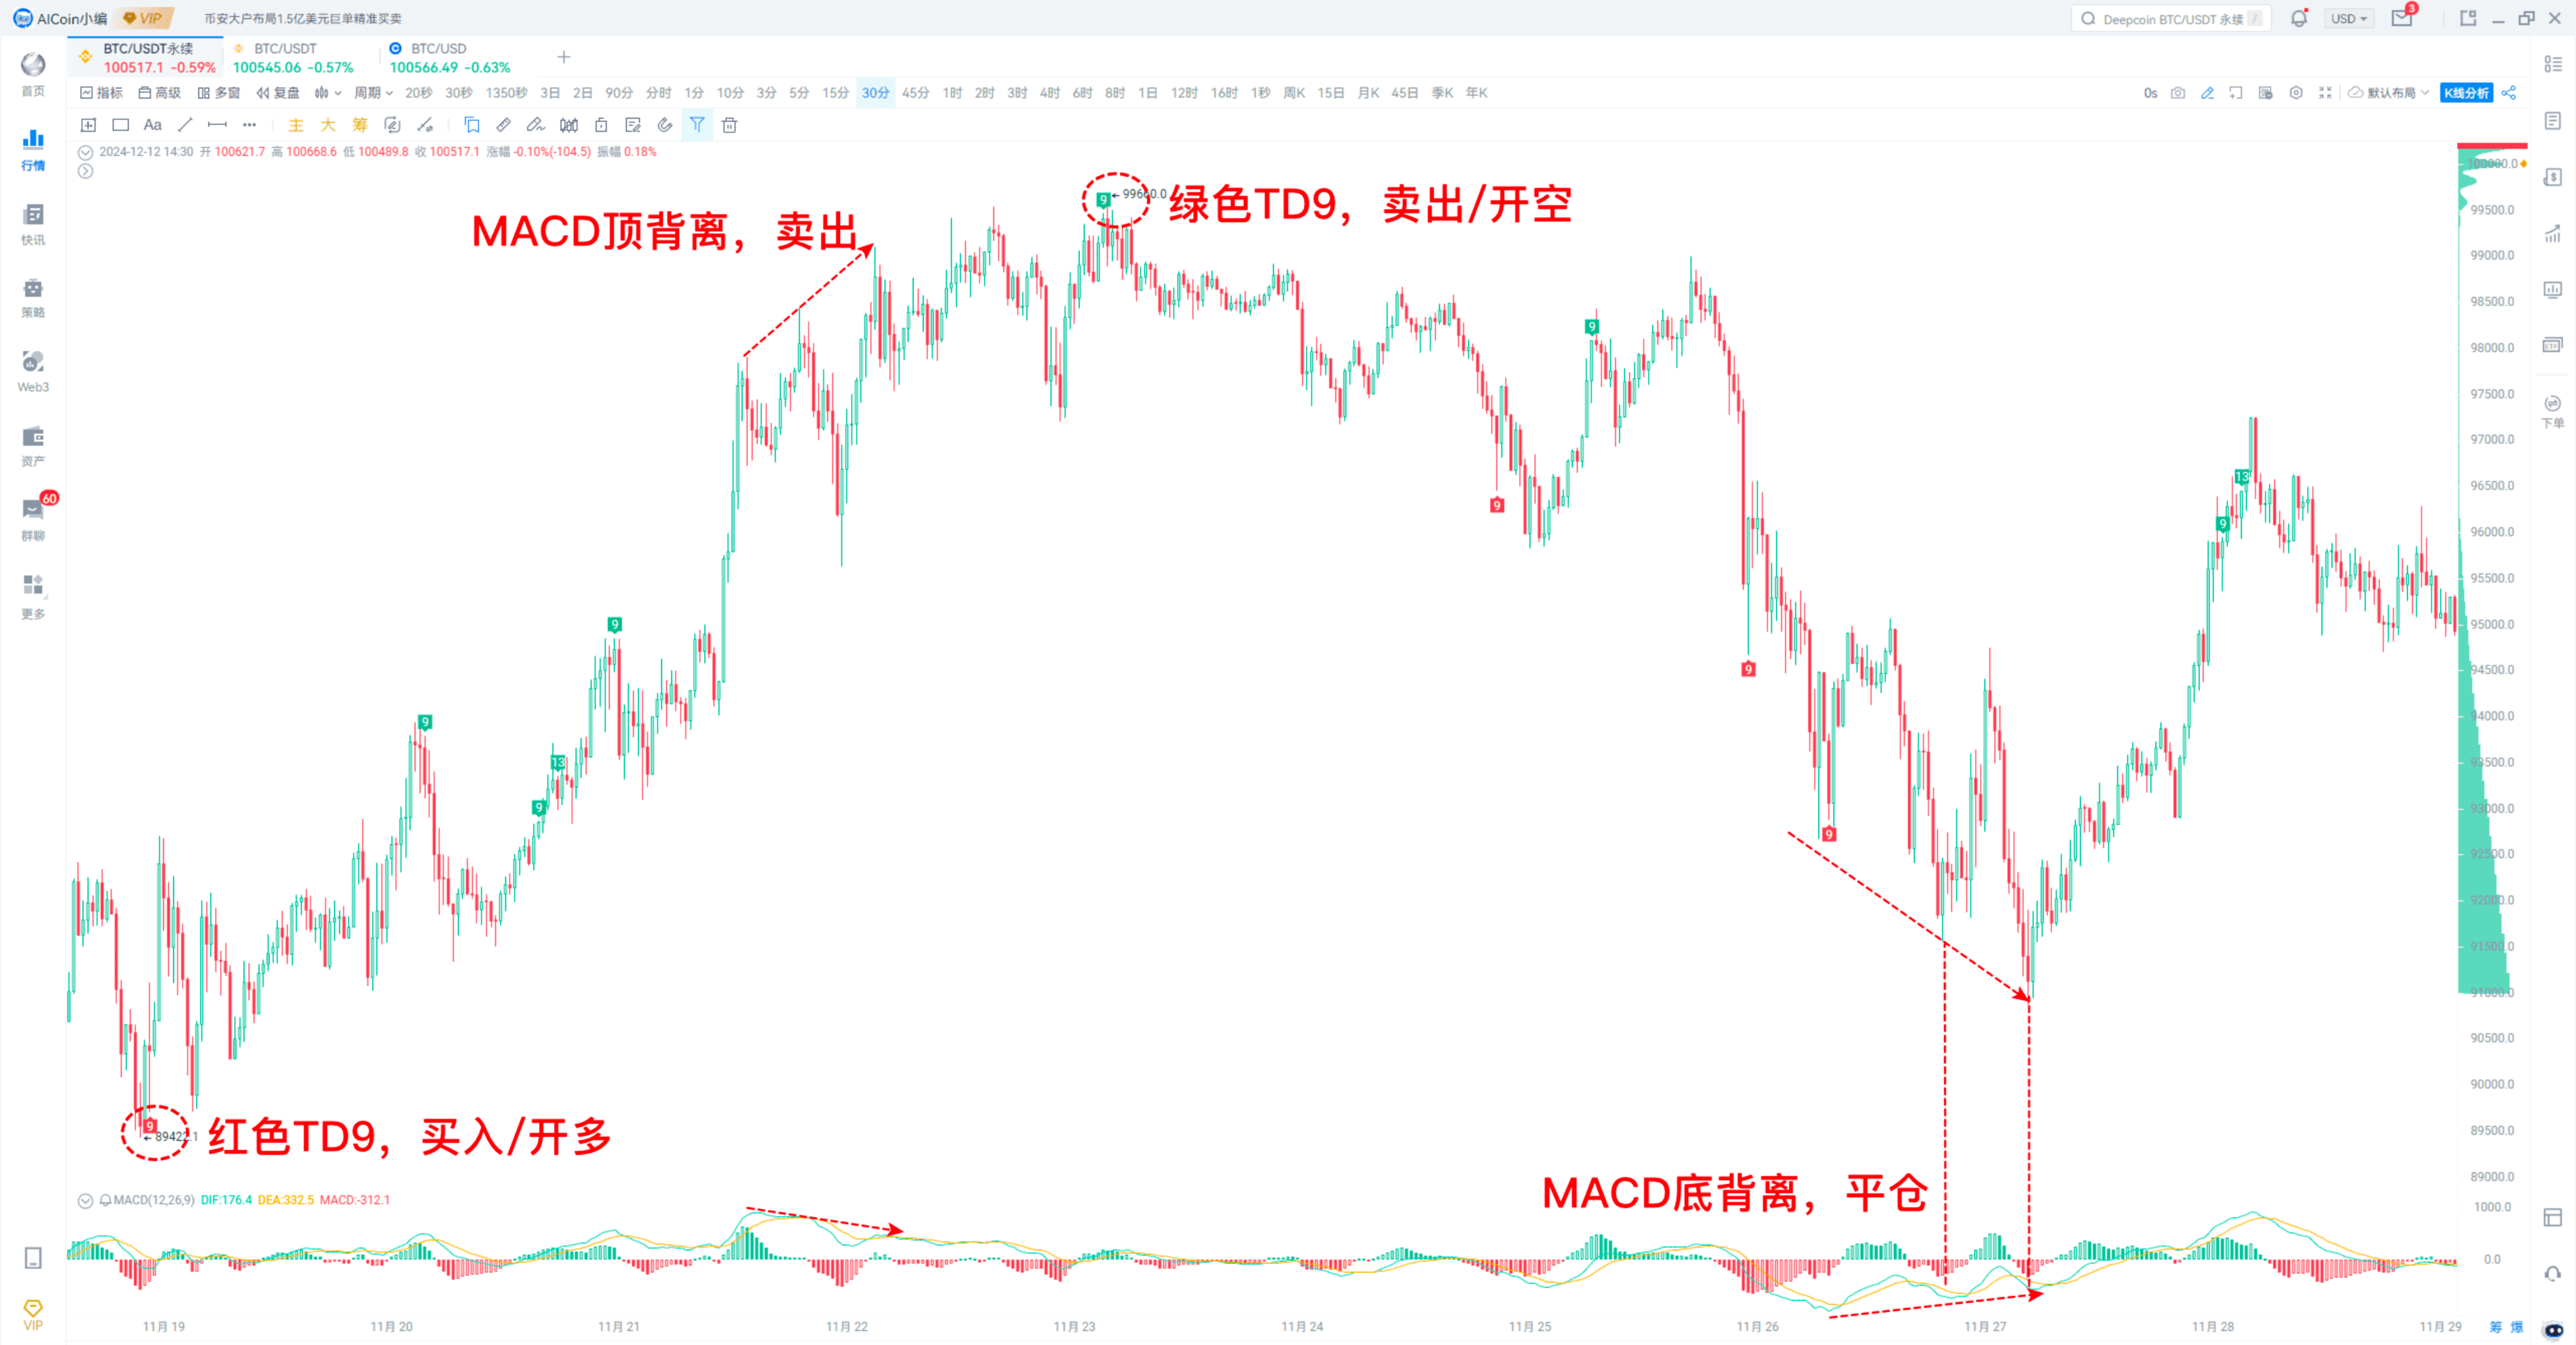
In a one-sided uptrend: TD-9 buy/long, close position on MACD top divergence.
In a one-sided downtrend: TD9 sell/short, close position on MACD bottom divergence.
The same applies to RSI, TD9 + RSI overbought/oversold or divergence.
Recently, I have been fond of using line divergence.
If using RSI
Personally, I prefer to look for resonance signals.
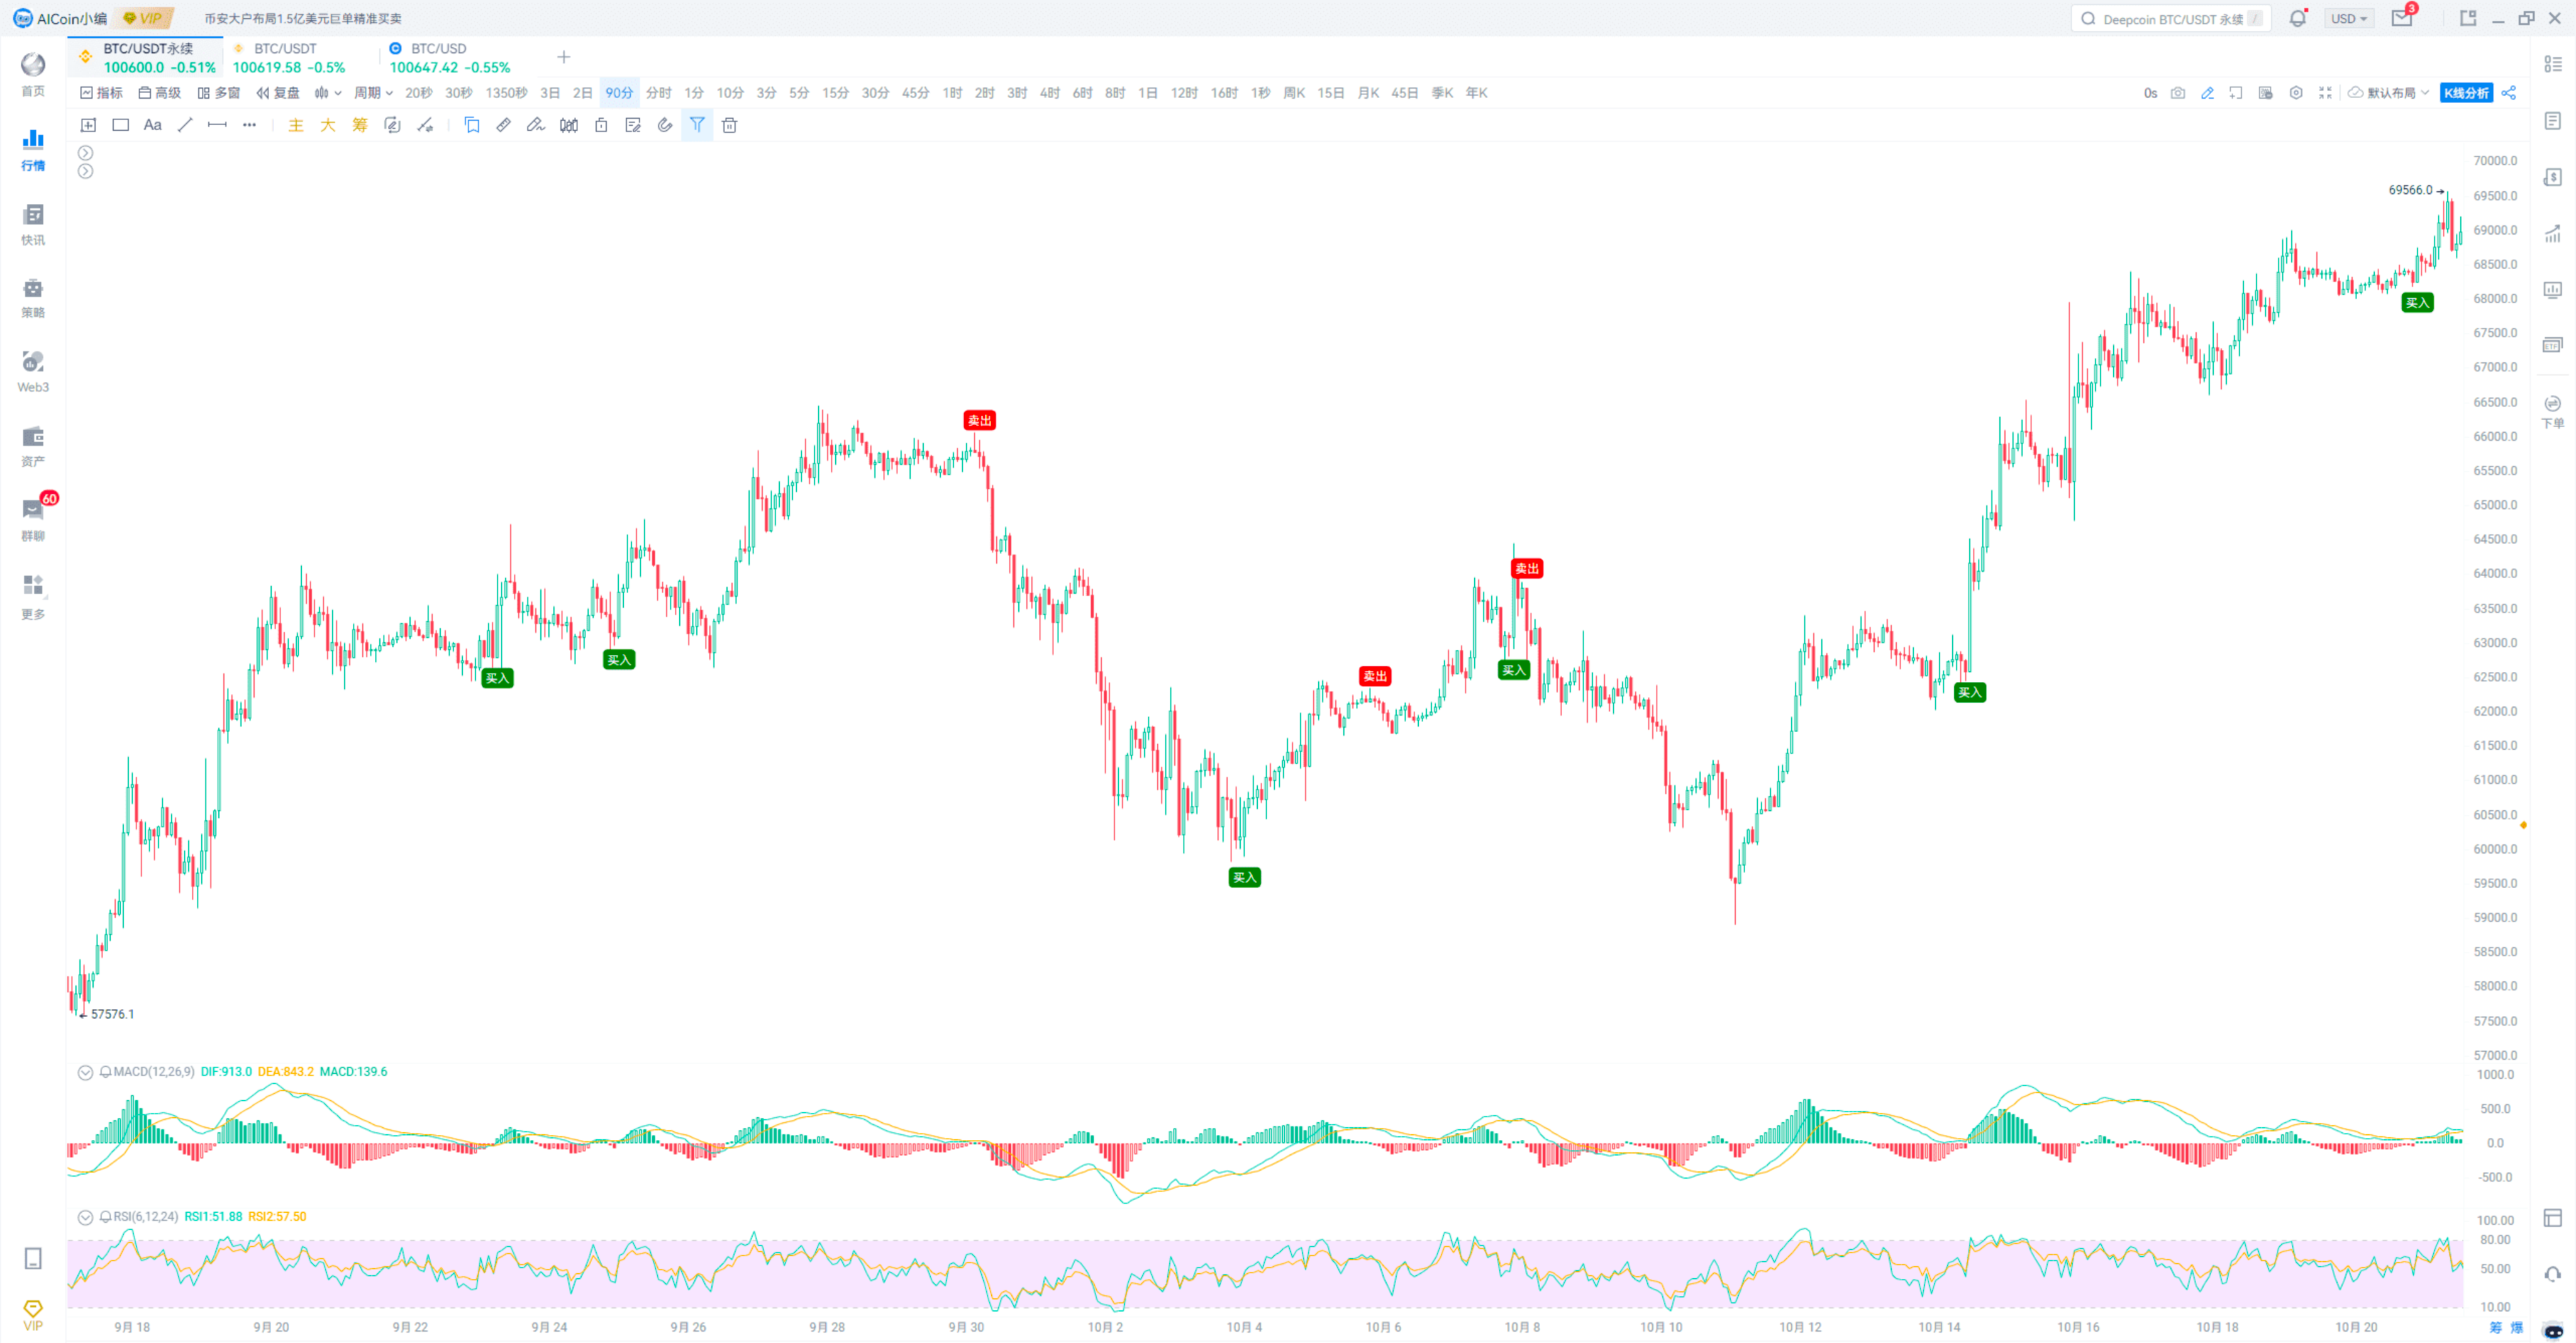
- Golden Death Cross Resonance
MACD golden cross + RSI golden cross, buy.
MACD death cross + RSI death cross, sell.
Signals are shown in the image.
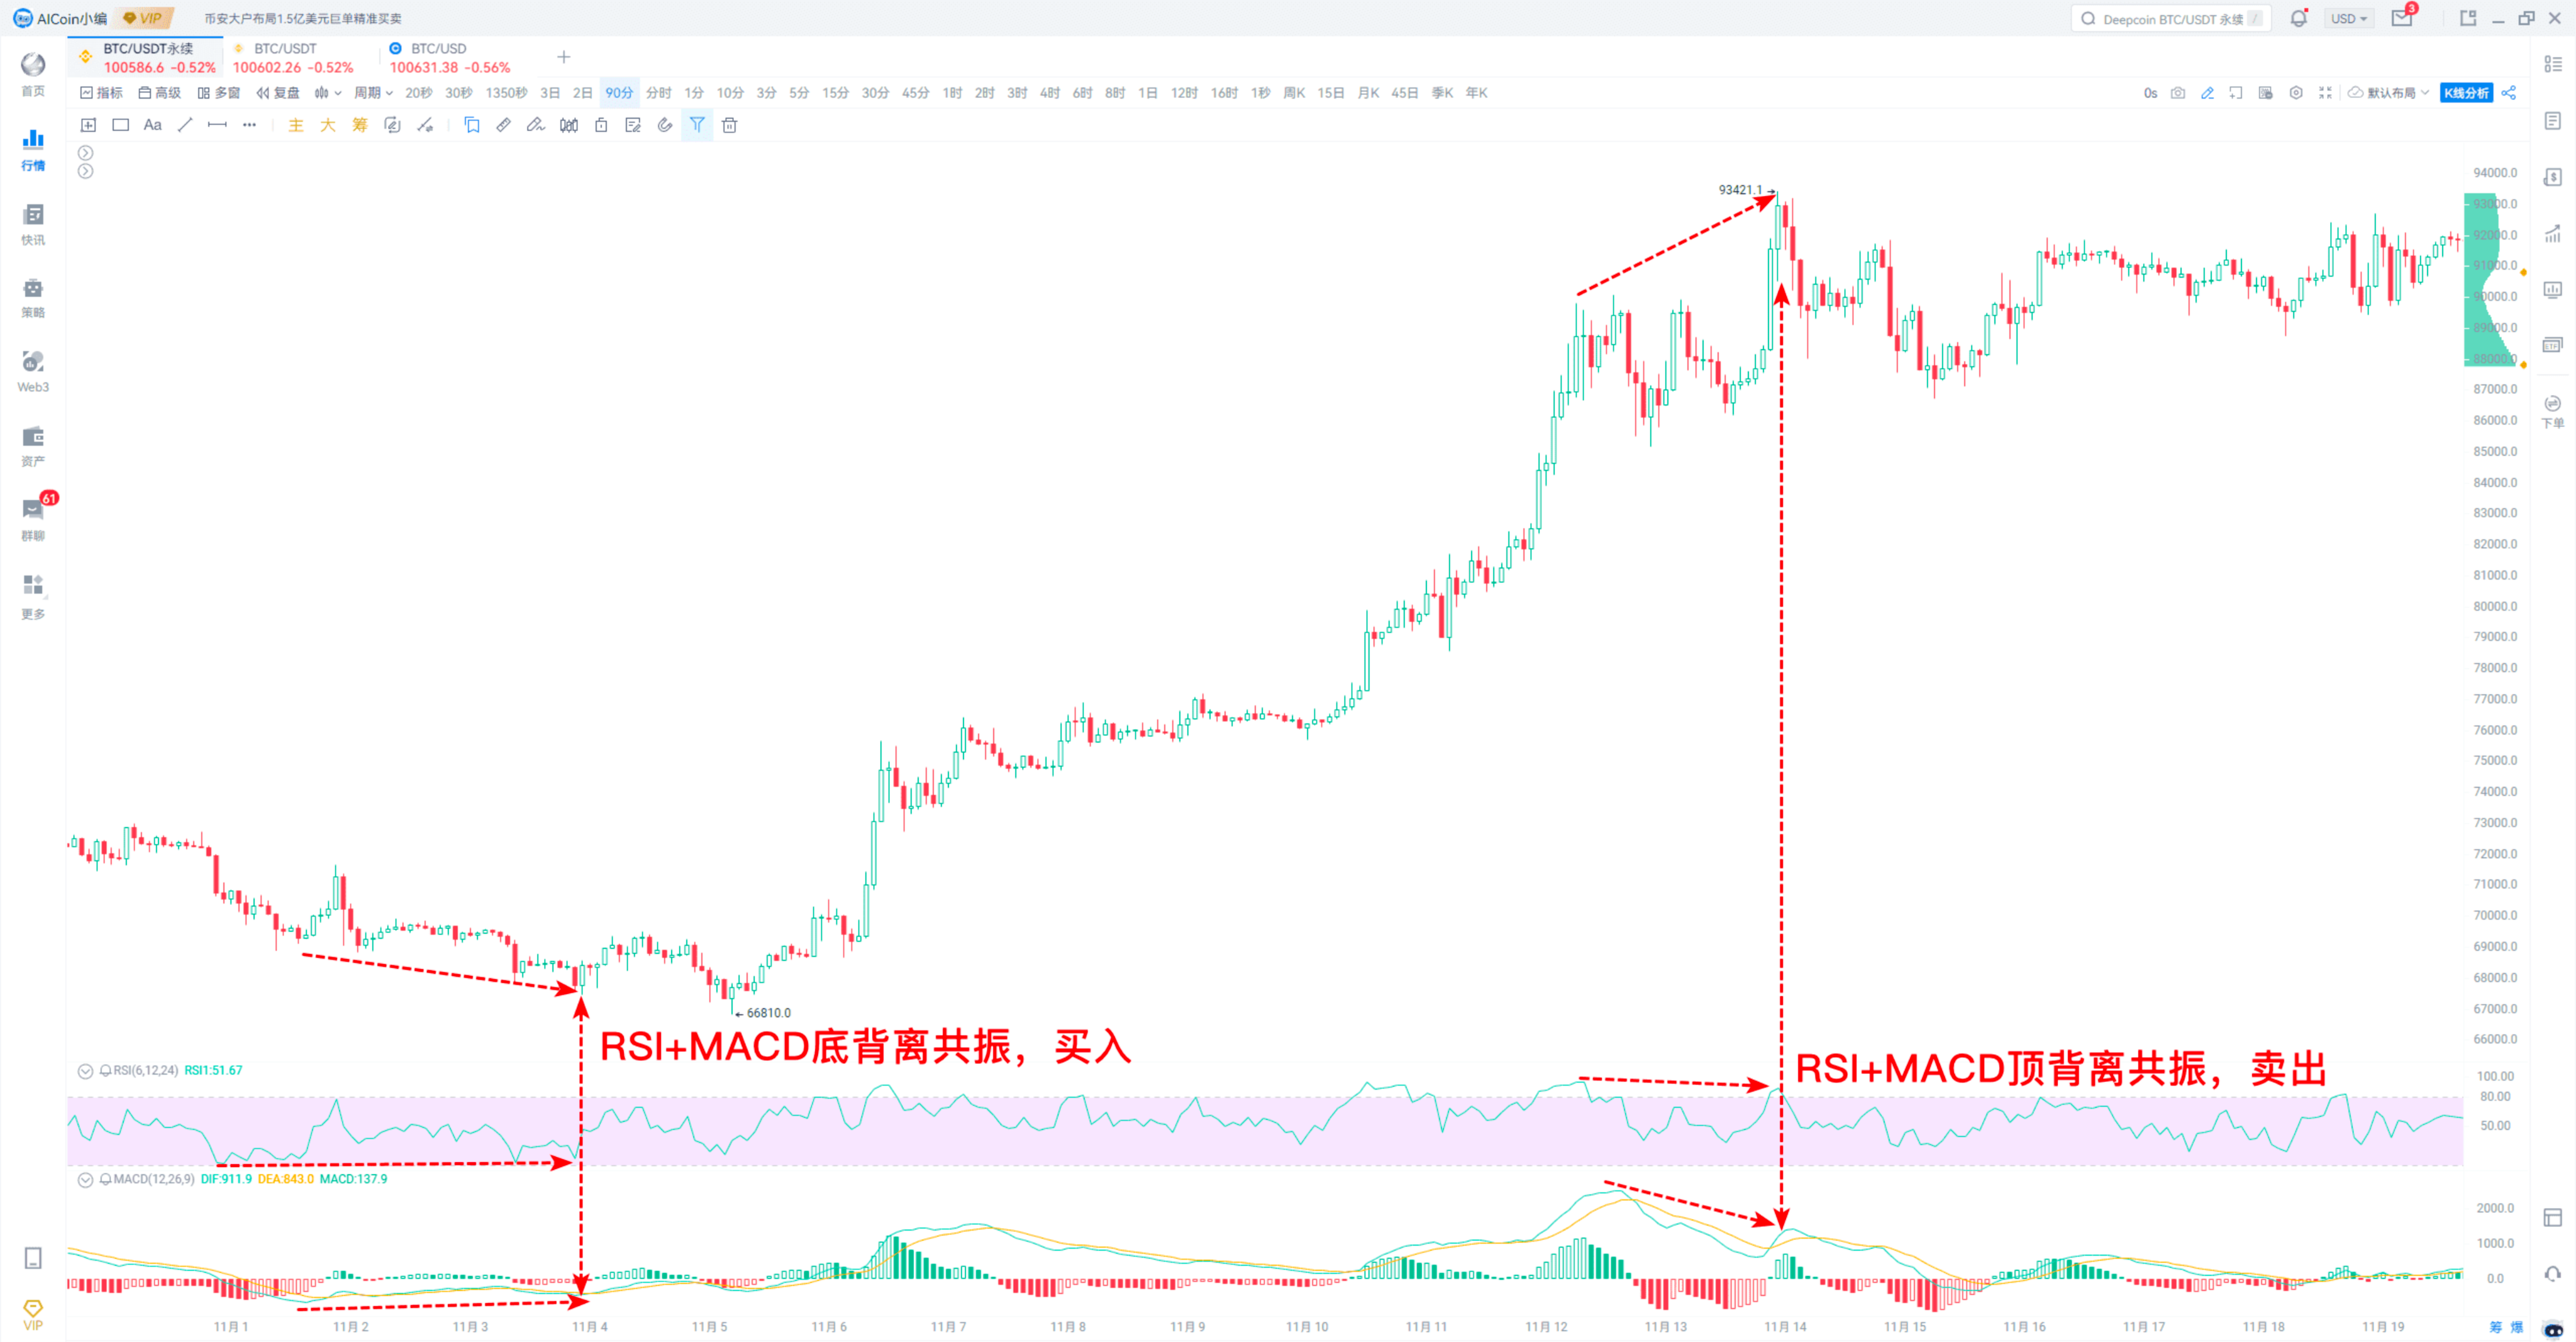
- Divergence Resonance
MACD bottom divergence + RSI bottom divergence, bullish.
MACD top divergence + RSI top divergence, bearish.
For divergence, the judgment method is the same as MACD, look at the price, and then judge the peak of RSI.
Regarding the time frame, when looking at indicators, I personally prefer 30 minutes, 45 minutes, 4 hours, 8 hours, as well as daily and 3-day lines. For short-term trading, I prefer using candlestick patterns.
For divergence, I like to use RSI (6). To judge the golden death cross, I use RSI (6) and RSI (12), as I personally prefer to look for divergence.
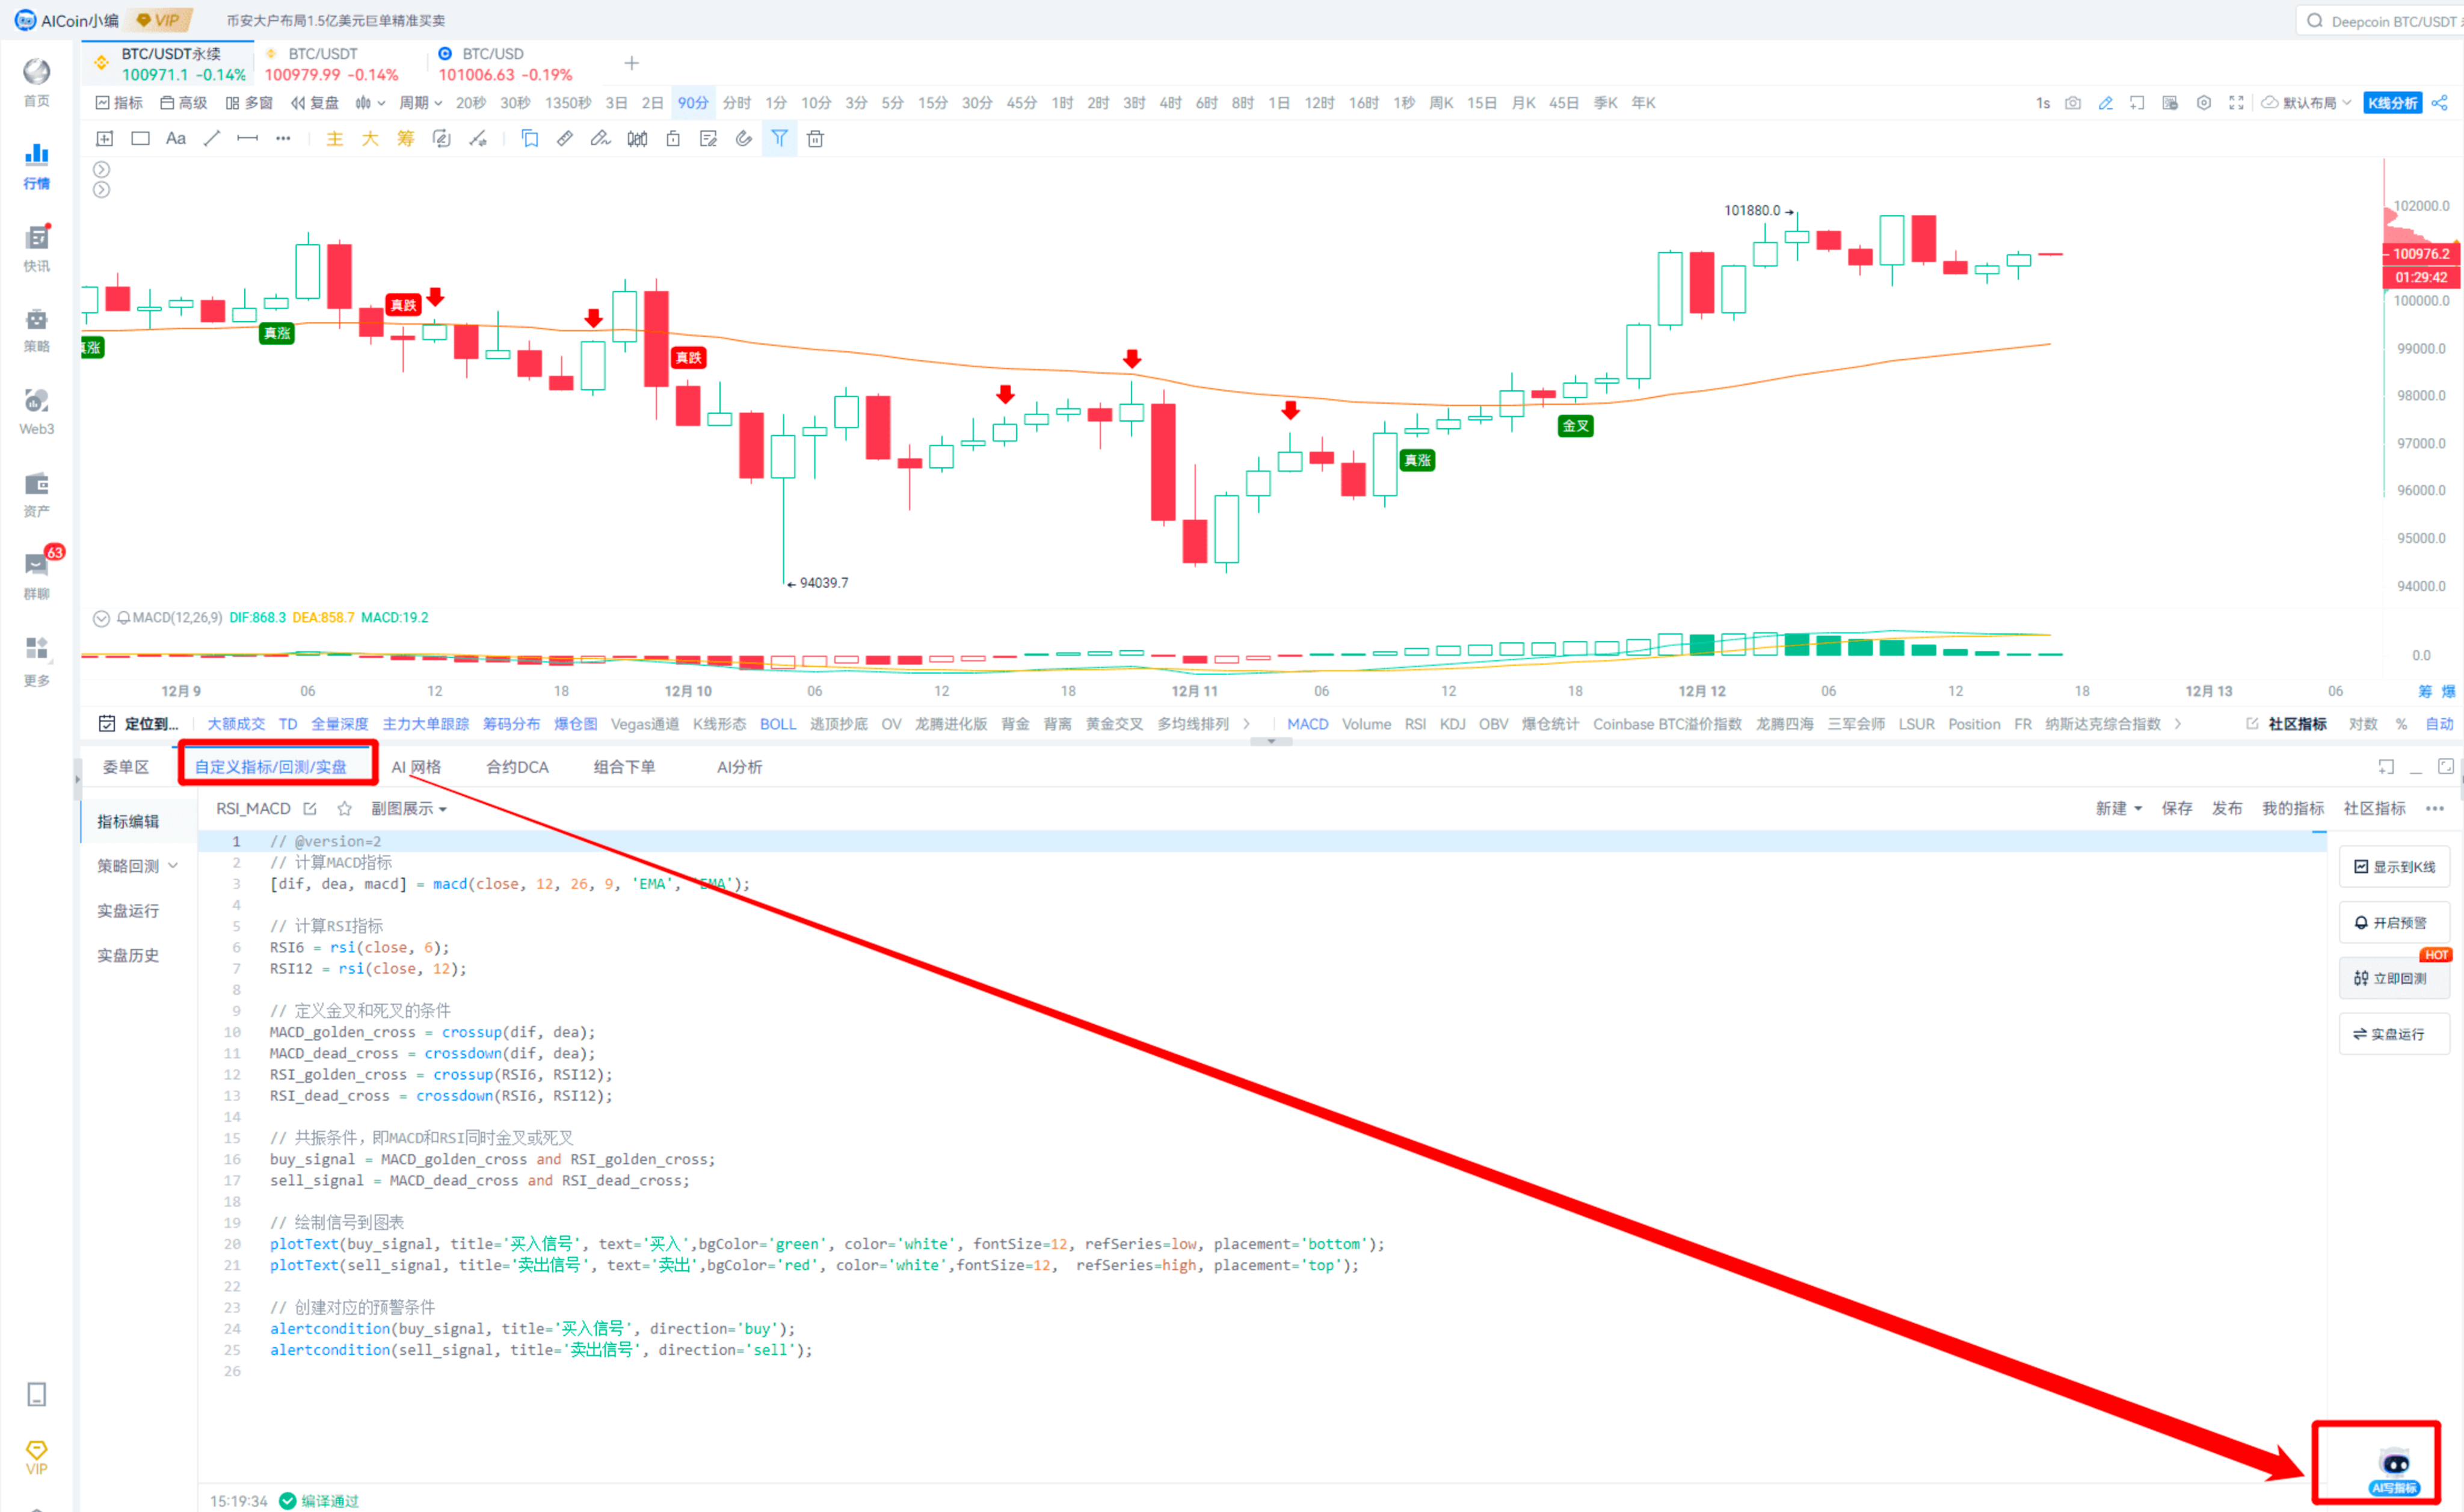
The several indicator usages mentioned earlier can all be monitored using custom indicators. Friends who don't know how to code can ask us to write it for them, or they can directly give the indicator logic to our assistant—AI to write the indicator, just submit the indicator logic, and AI will generate the code directly, super convenient!
As shown in the image, it's super easy.
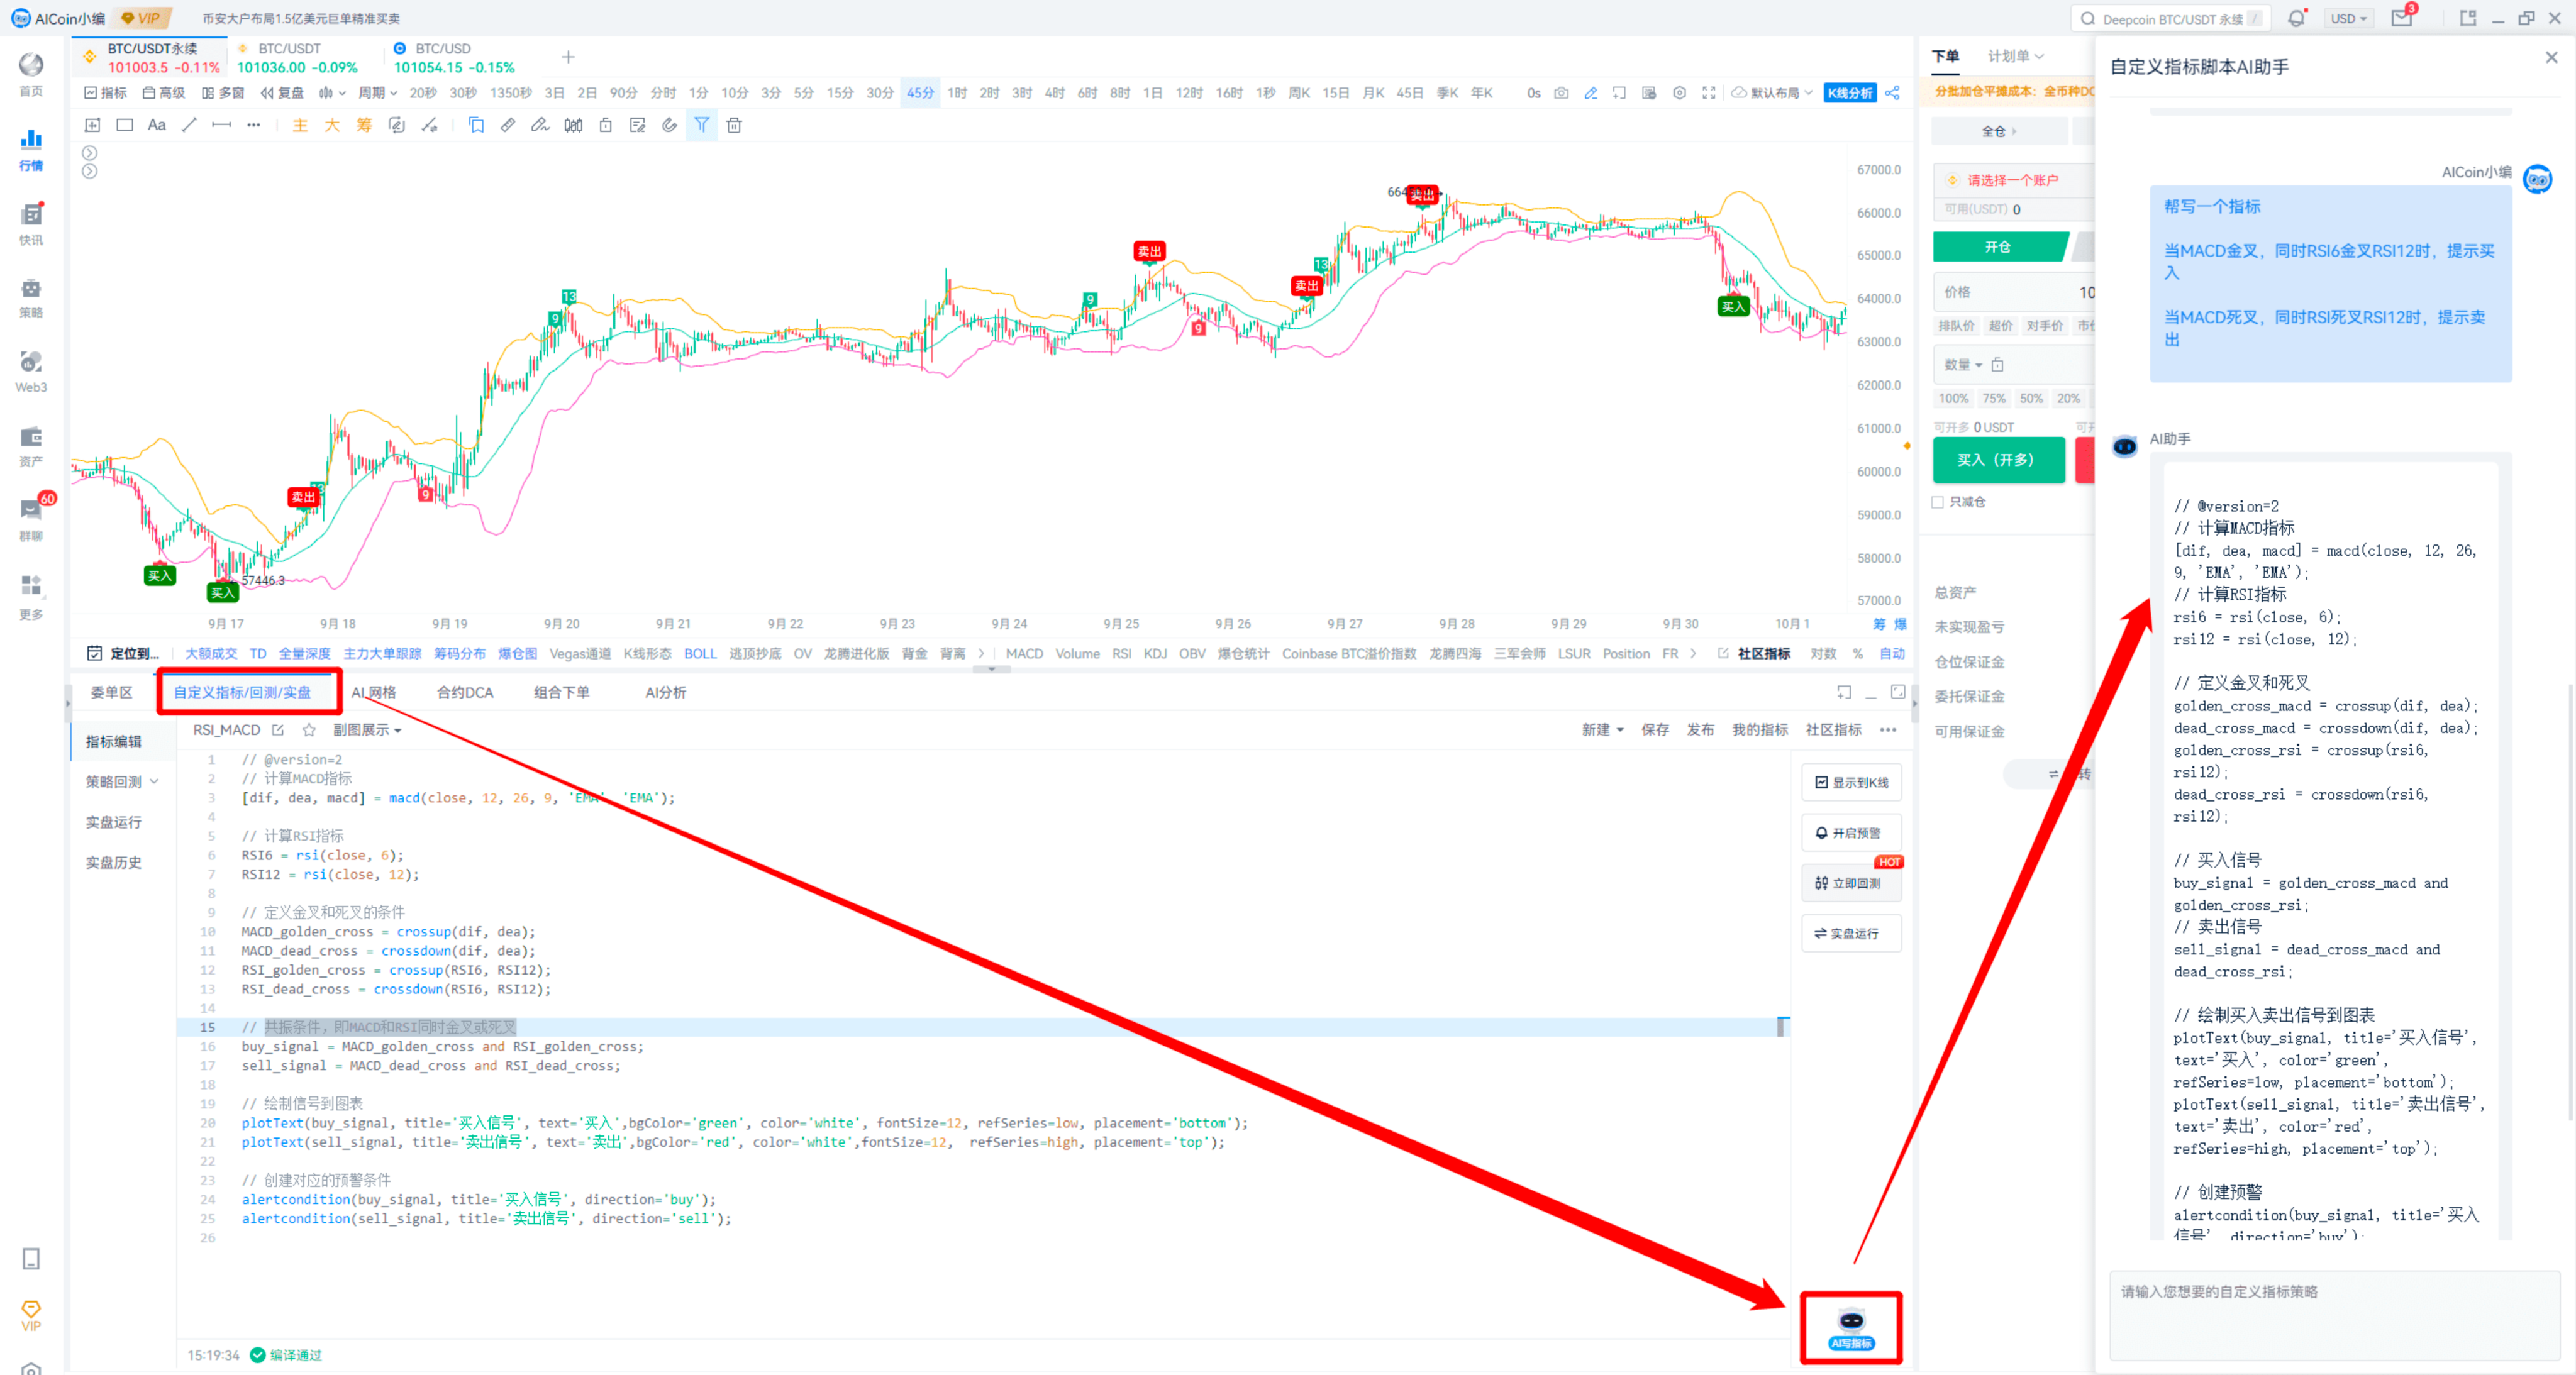
The buy and sell signals in the image are the RSI and MACD golden death cross resonance signals that I wrote using custom indicators. The divergence can also be written by the AI assistant. After becoming a member, you can use our AI indicator writing function! After becoming a member, you can use our AI indicator writing function, which also supports alerts, real trading (backtesting available), and signal display on candlesticks.
If friends who have watched my previous live sessions can notice, I personally really like using custom indicators because it reduces manual judgment.
Next, I will share with you the combination usage of EMA and MACD.
3. EMA+MACD
This is what I use the most! PRO members know this well.
The custom indicators I often use are basically posted in the community indicator square, so interested friends can subscribe!
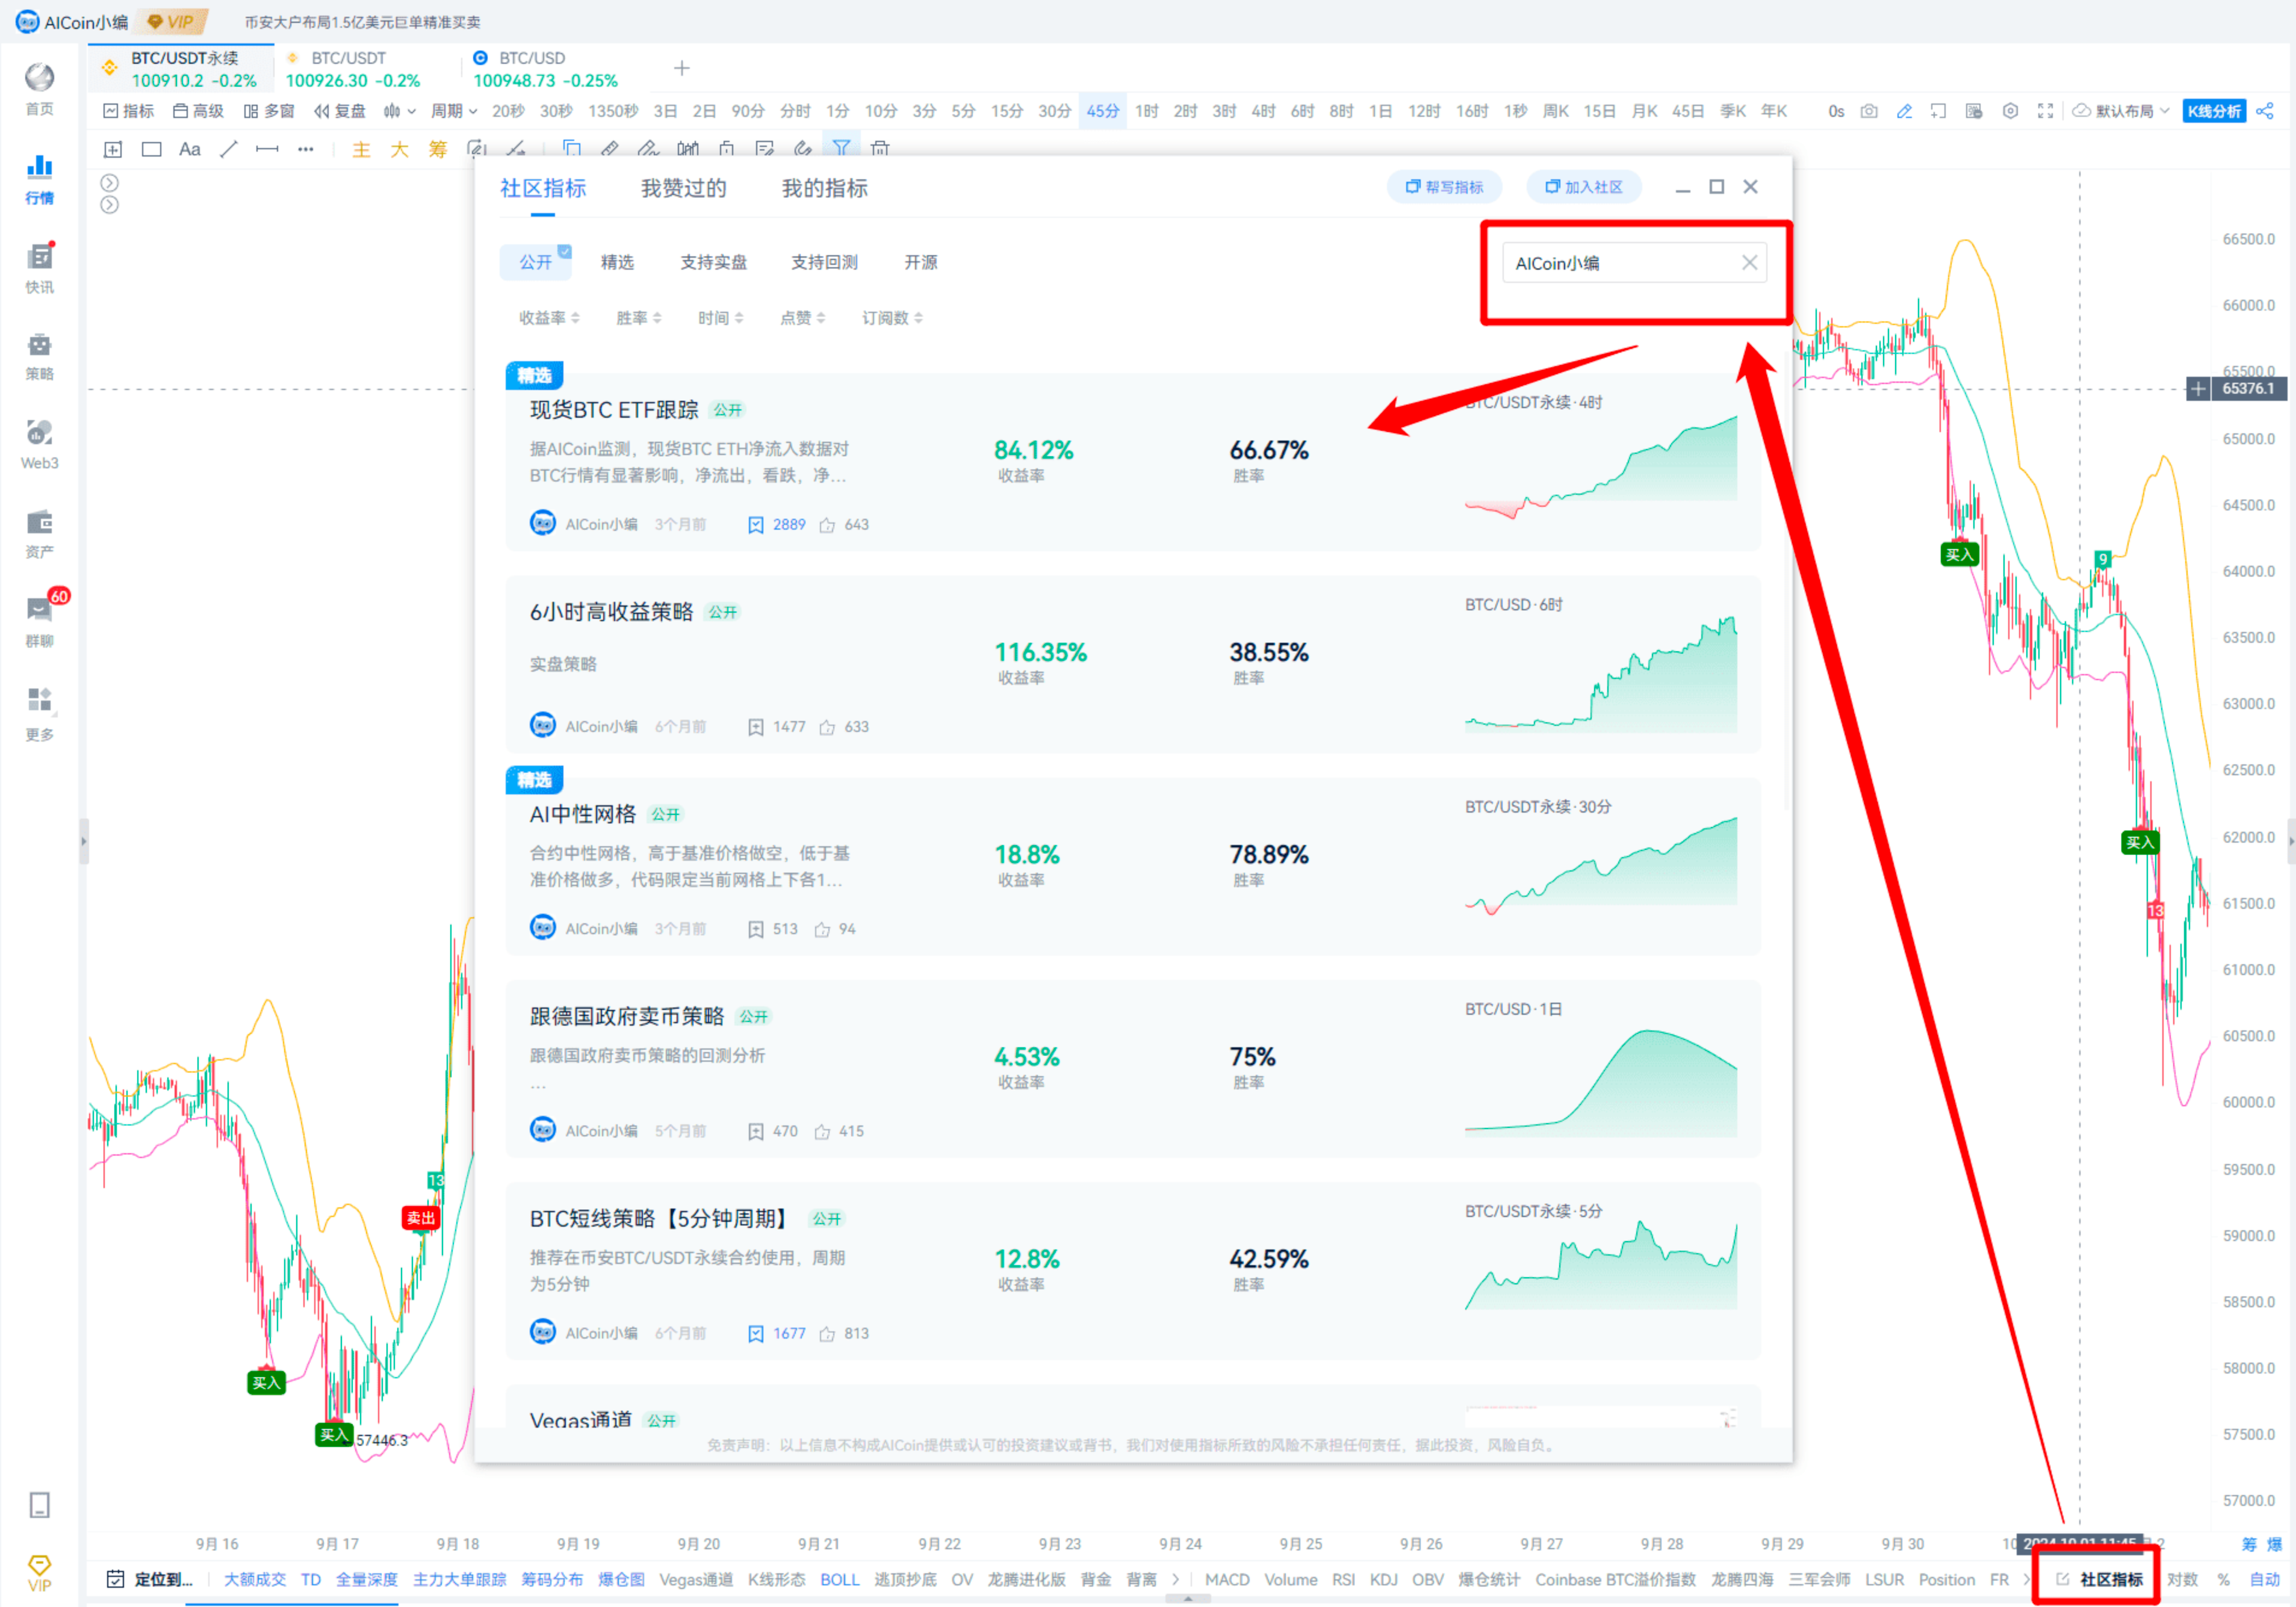
Recently, I have been using strategies like fake-out strategies, breakout hunters, pin bar volume method, and Vegas channel frequently.
Back to EMA and MACD,
I generally use EMA52 for the EMA indicator.
EMA52 + MACD (12, 26, 9):
Usage 1: Trend Judgment
When the price crosses above EMA52, and the MACD fast and slow lines are above the zero axis, it is bullish.
When the price crosses below EMA52, and the MACD fast and slow lines are below the zero axis, it is bearish.
Usage 2: True and False Breakout Judgment
When the MACD fast and slow lines are above the zero axis, if the K-line retraces to EMA52, it is considered a rebound signal.
When the MACD fast and slow lines are below the zero axis, if the K-line rises and touches EMA52, it is considered a pullback signal.
If the MACD fast and slow lines approach the zero axis, the effect is even better.
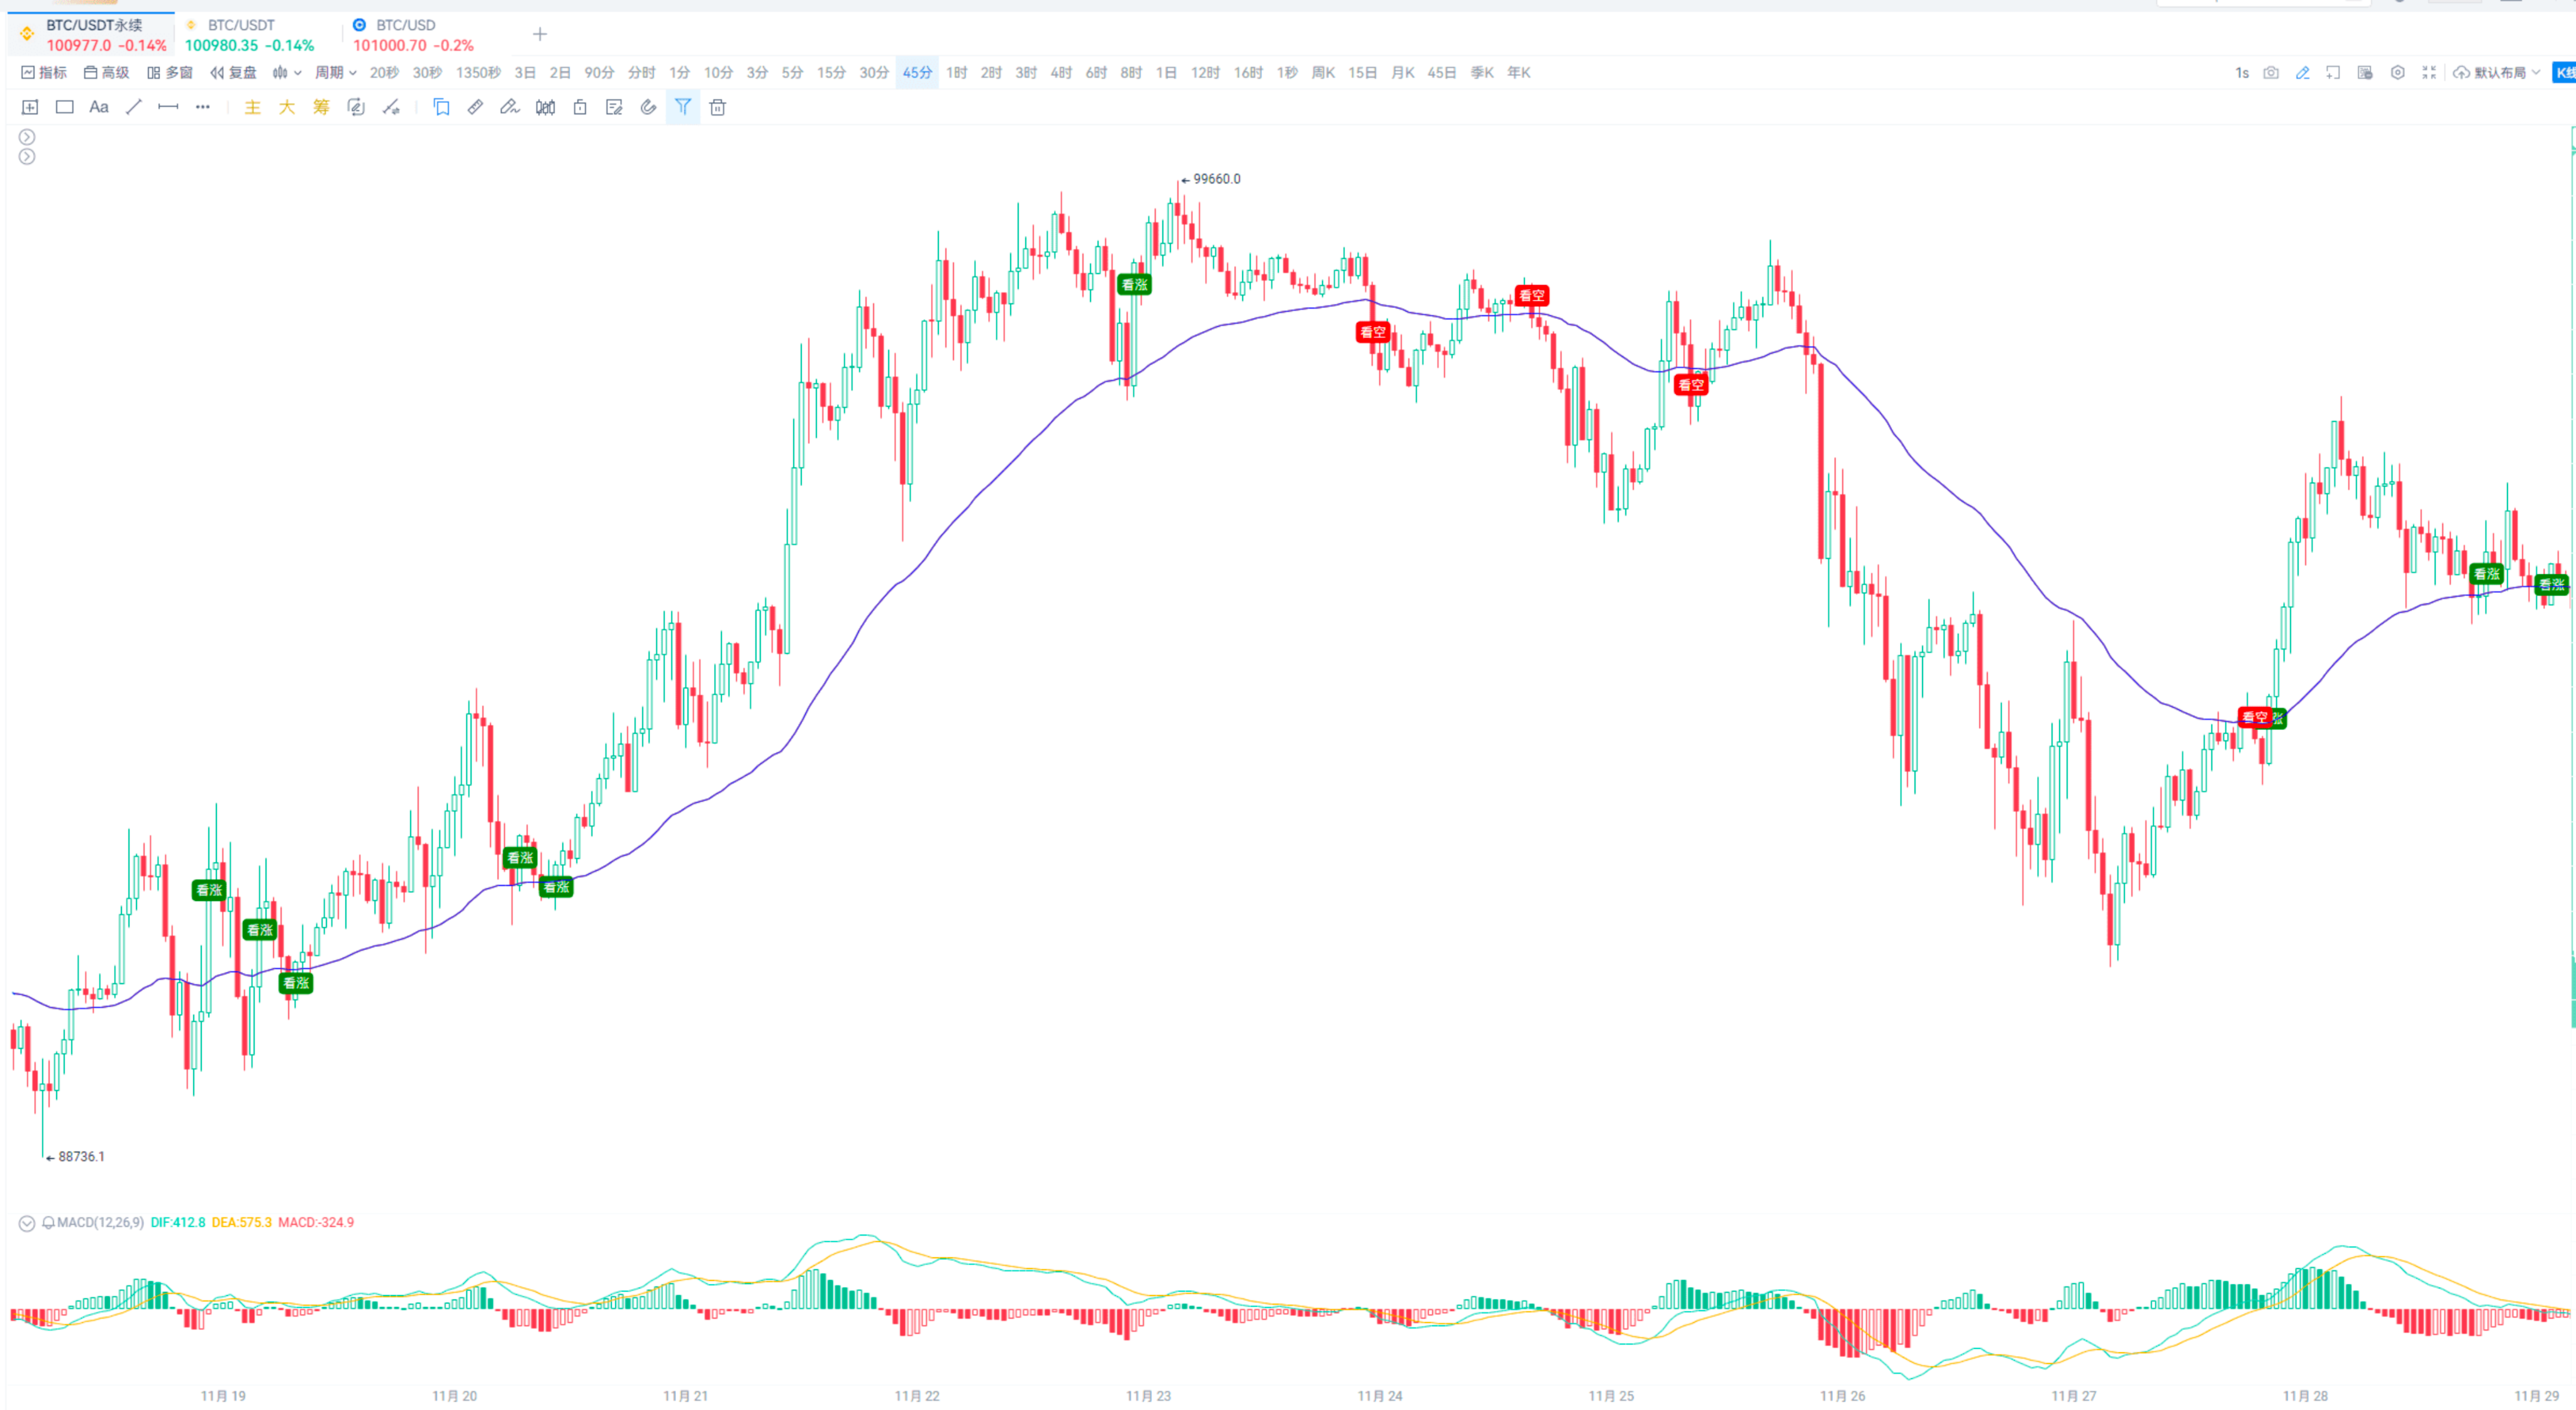
However, I personally prefer to use EMA and MACD to judge true and false breakouts.
Simple version.
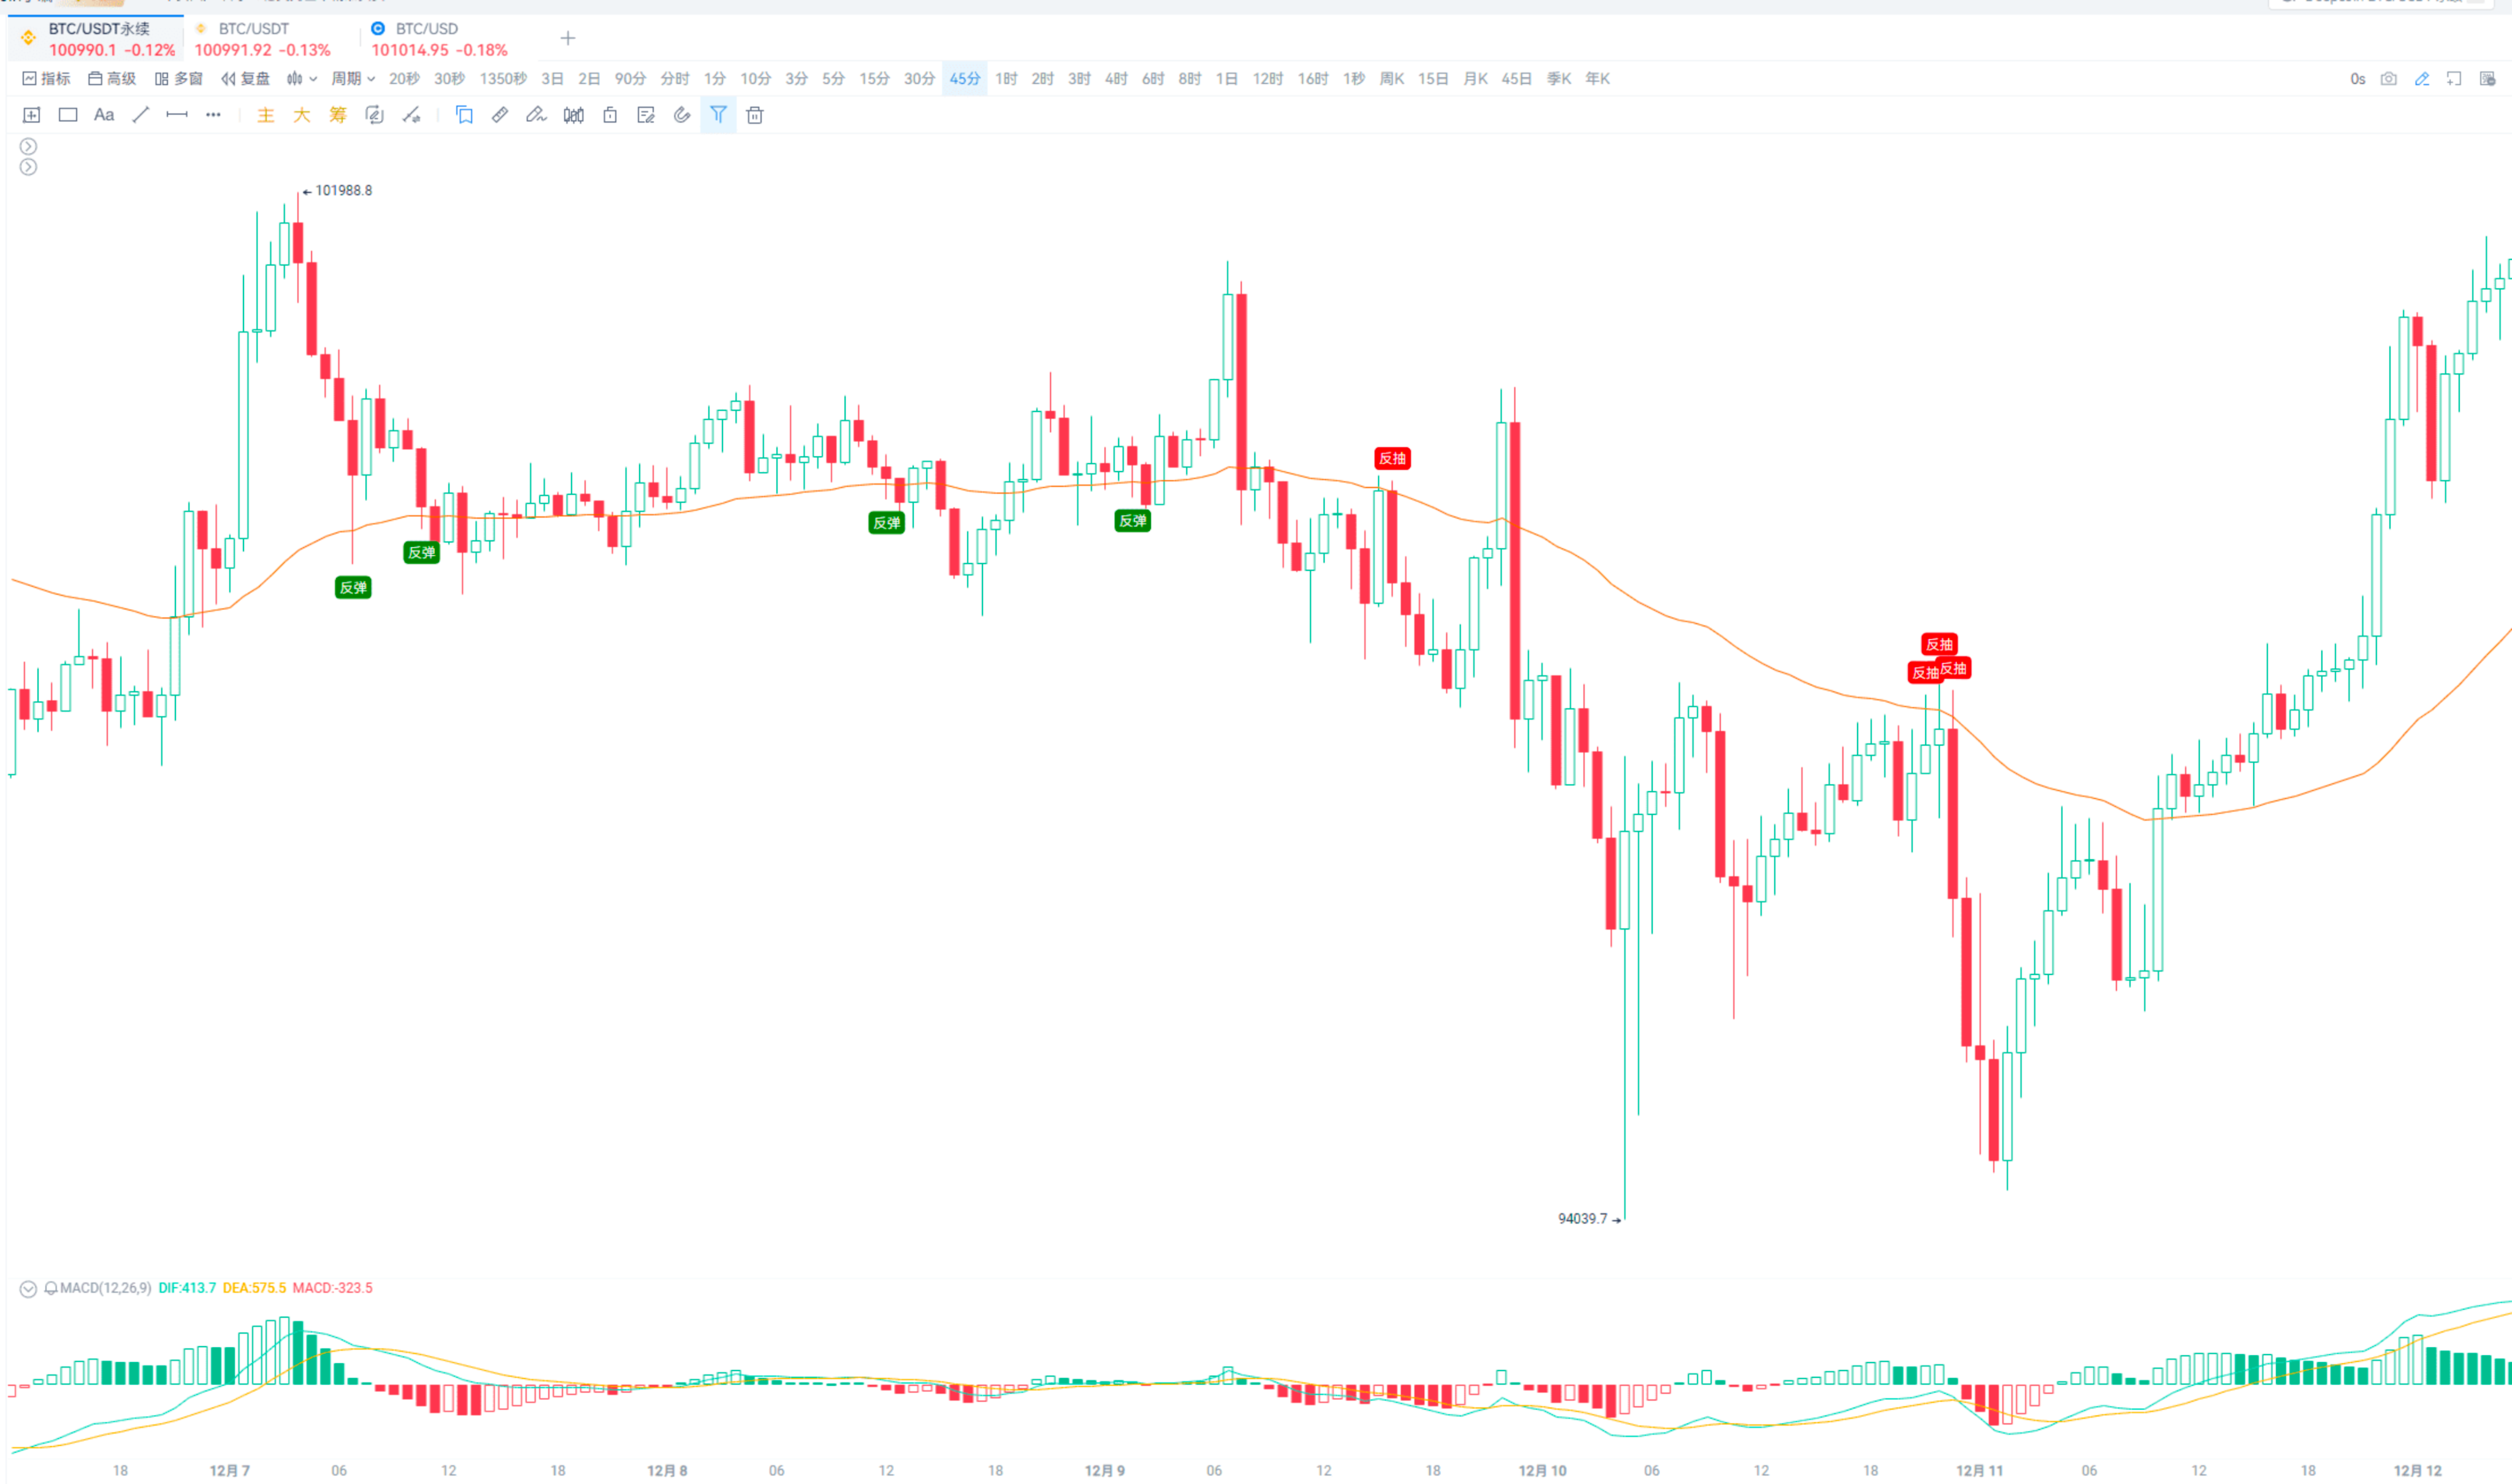
The complex version is the fake-out strategies and breakout hunter strategies I mentioned.
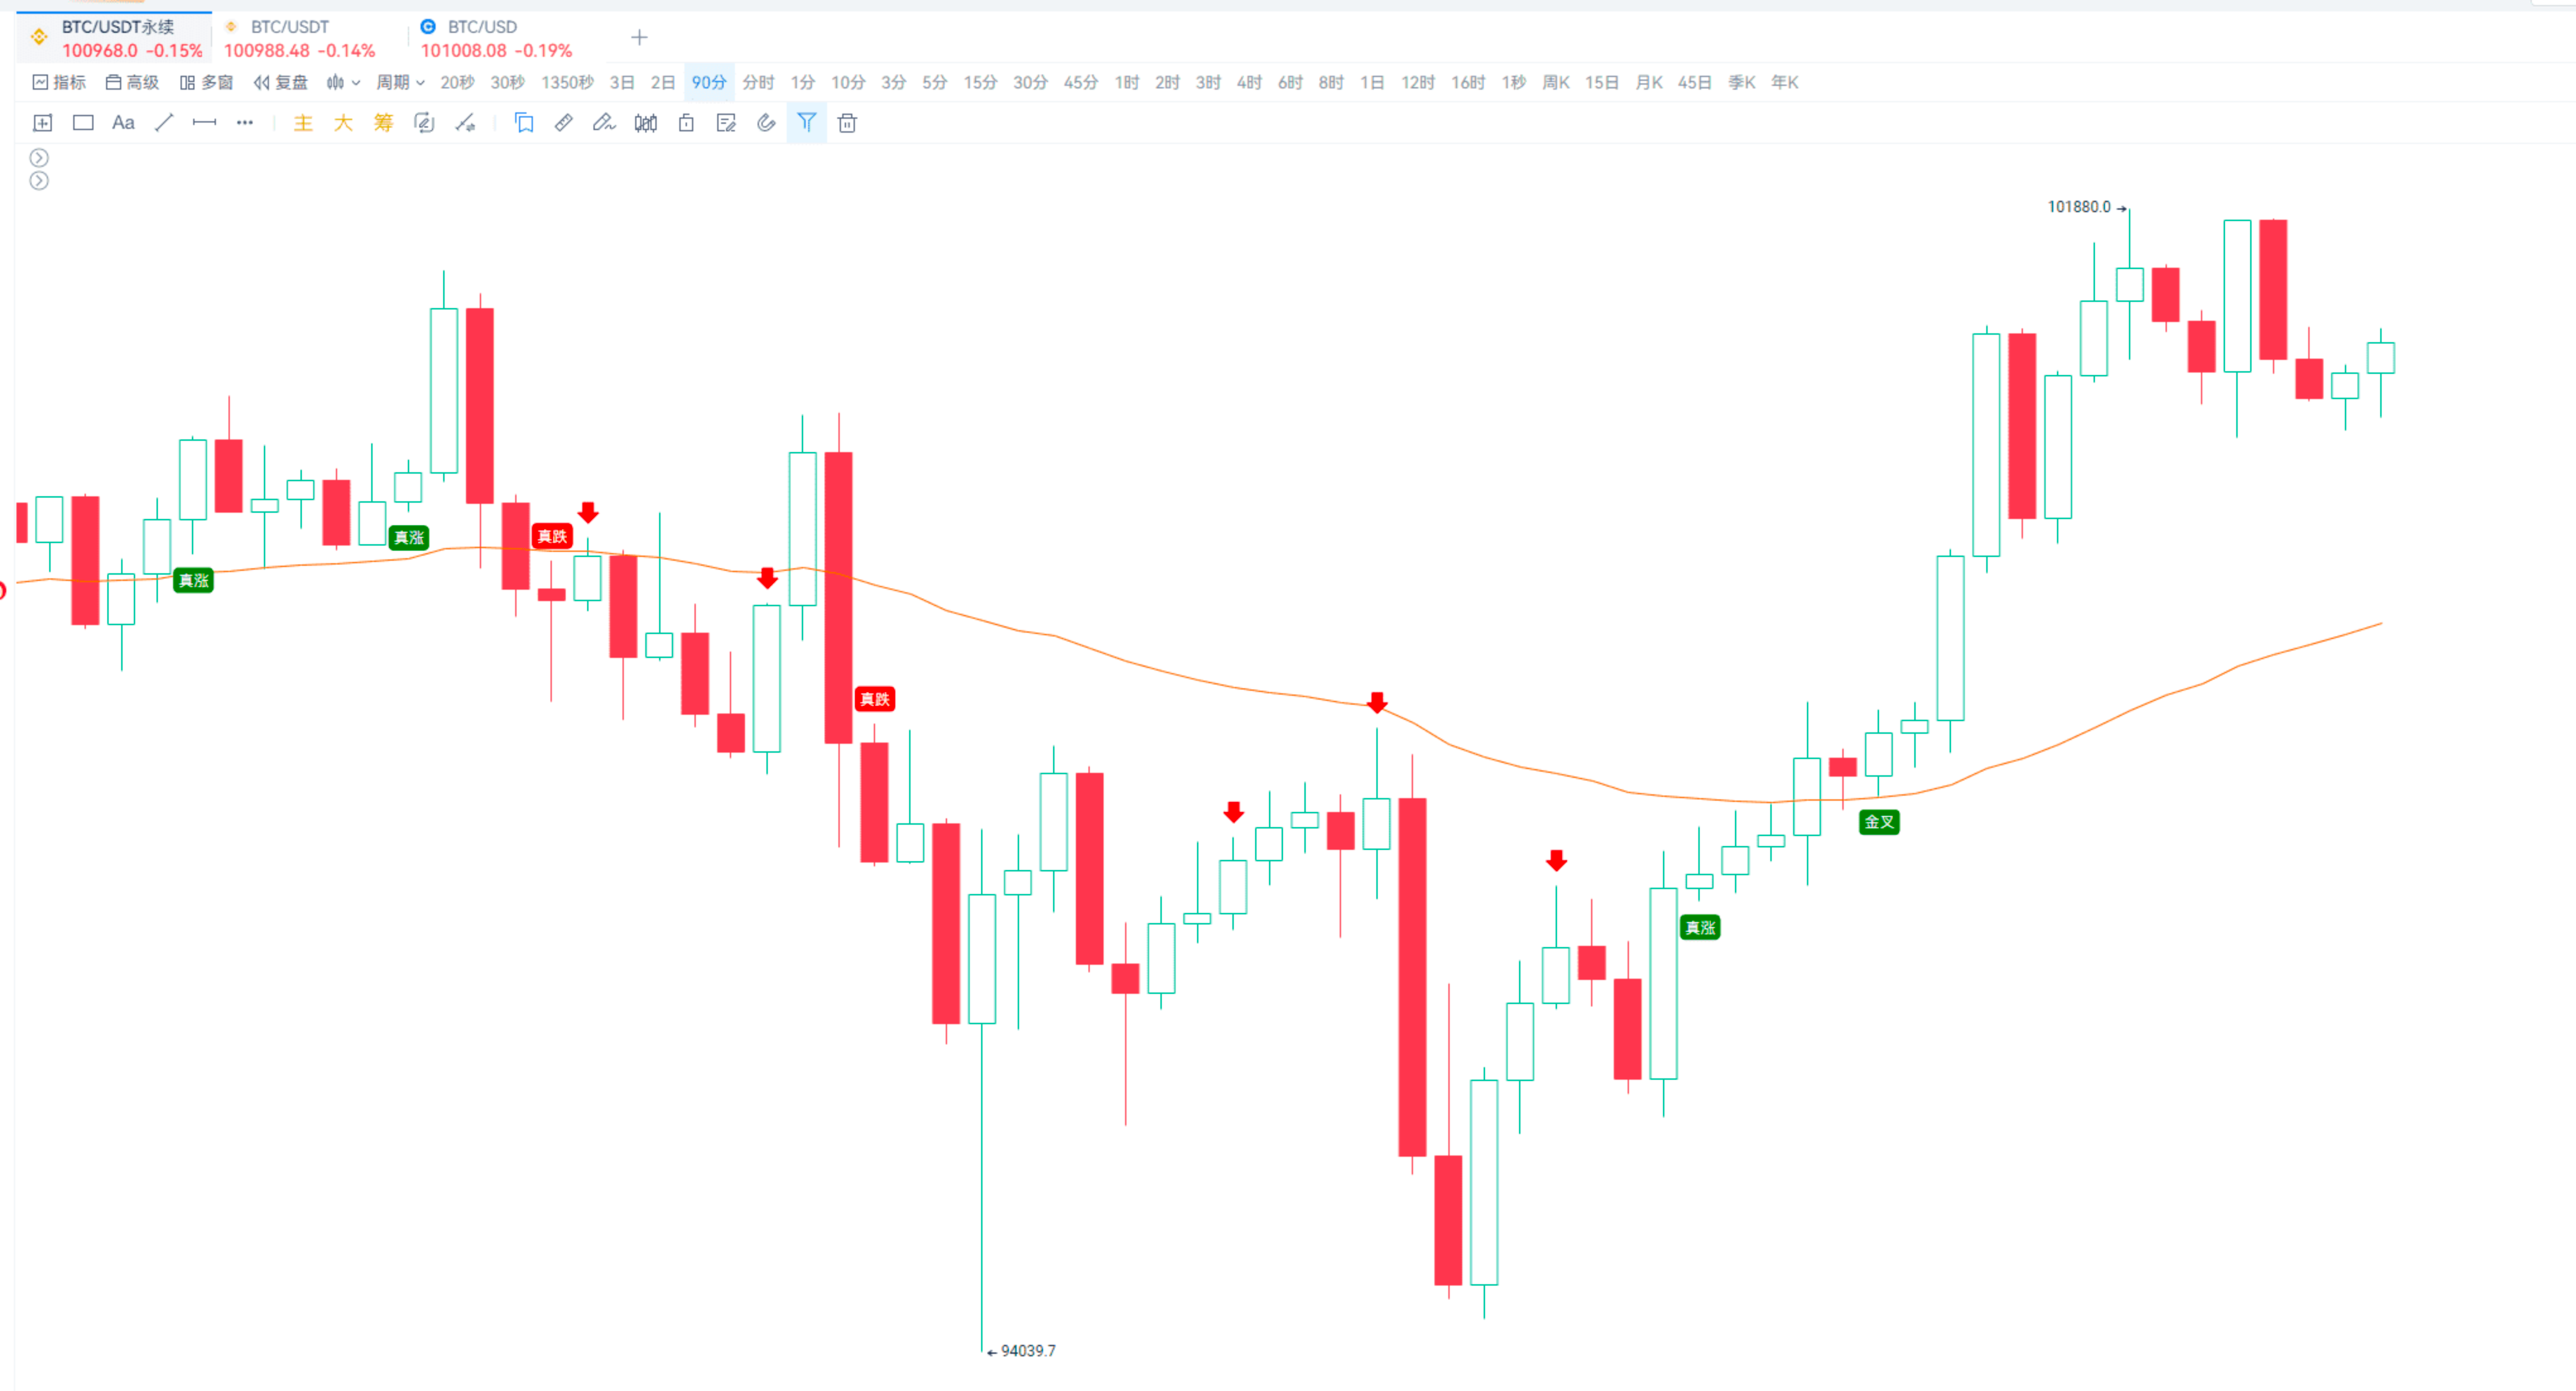
The second usage mainly looks at the closing price; as long as the closing price does not break the moving average, it is not a true breakout.
Breakout hunter indicator: https://www.aicoin.com/link/script-share/details?shareHash=7dOMvoJPObMdyqaX
Fake-out strategy: https://www.aicoin.com/link/script-share/details?shareHash=l3P2876OdlgPWxdZ
For friends interested in the screenshots above, you can throw the indicator logic to the AI indicator writing assistant and let AI help write it!
Indicators are meant to assist in judgment; there are various complex indicators in the market, so just find the ones that suit you and that you are comfortable using.
The indicator usages are as mentioned above. For more in-depth discussions, feel free to leave a message or join the PRO group to discuss with me.
4. AI Grid
Finally, I want to share a powerful tool—AI Grid.
The last session's director also shared this with everyone.
This function is truly effective and applicable to any market condition, unafraid of bull or bear markets.
Applicable to any market condition, unafraid of bull or bear markets.
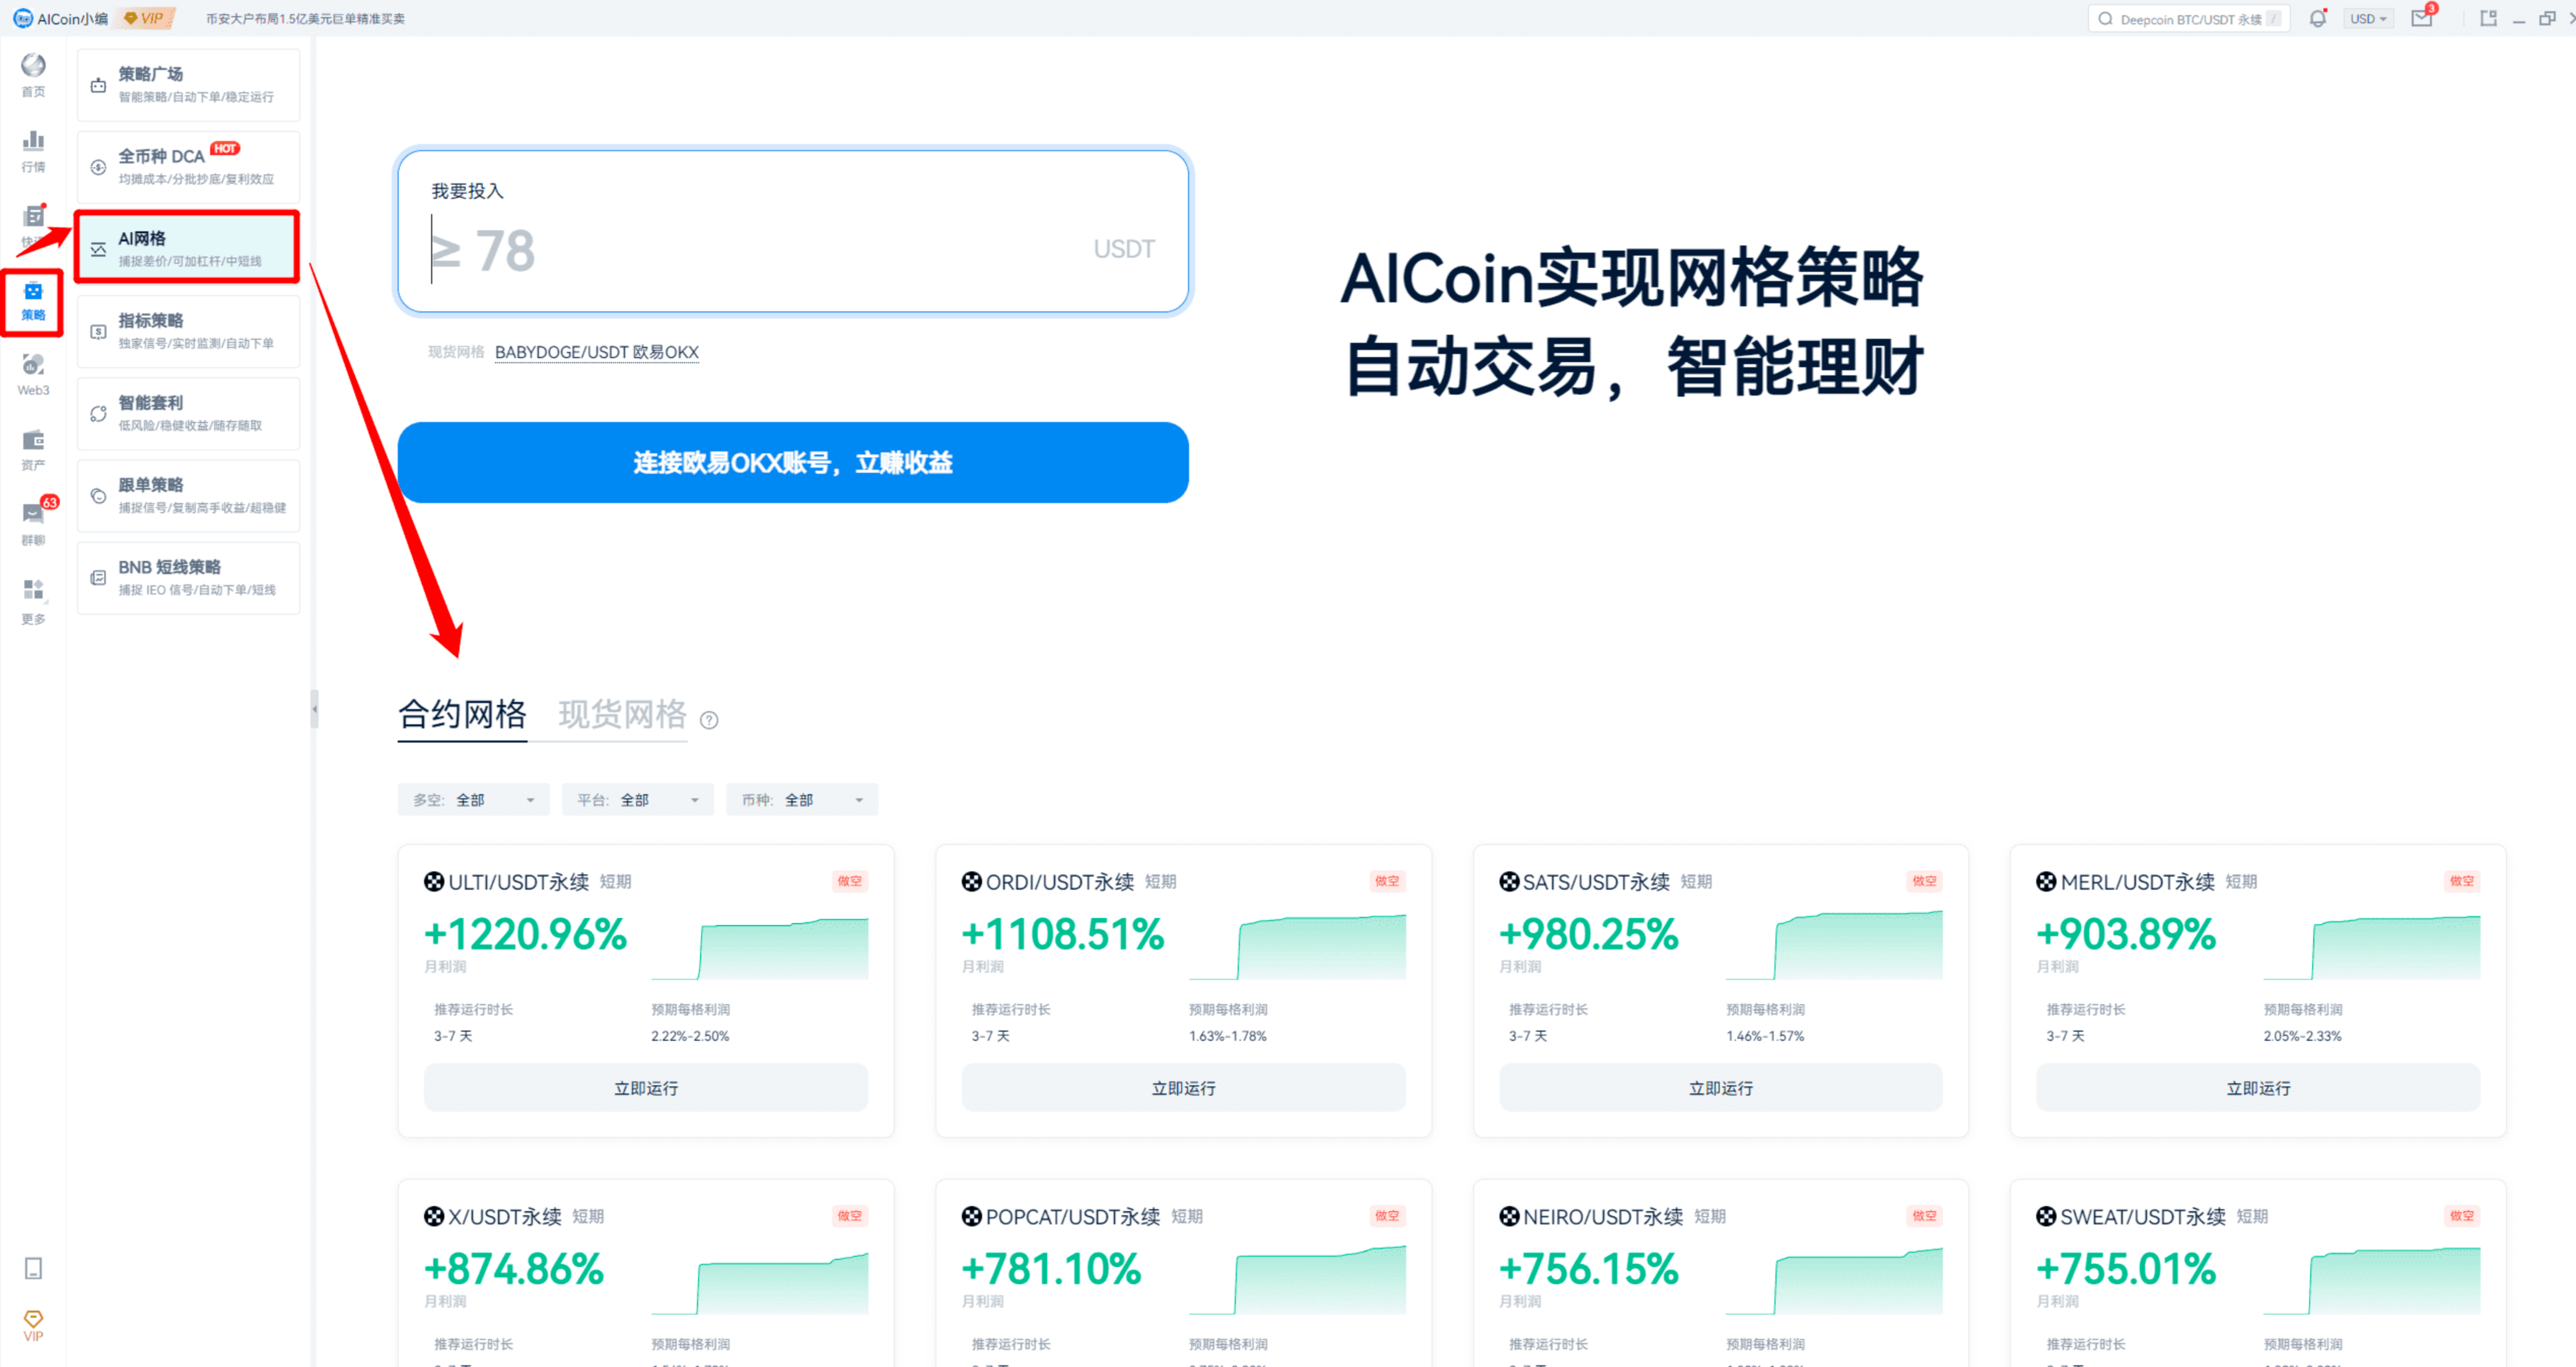
AI indicator writing assistant.
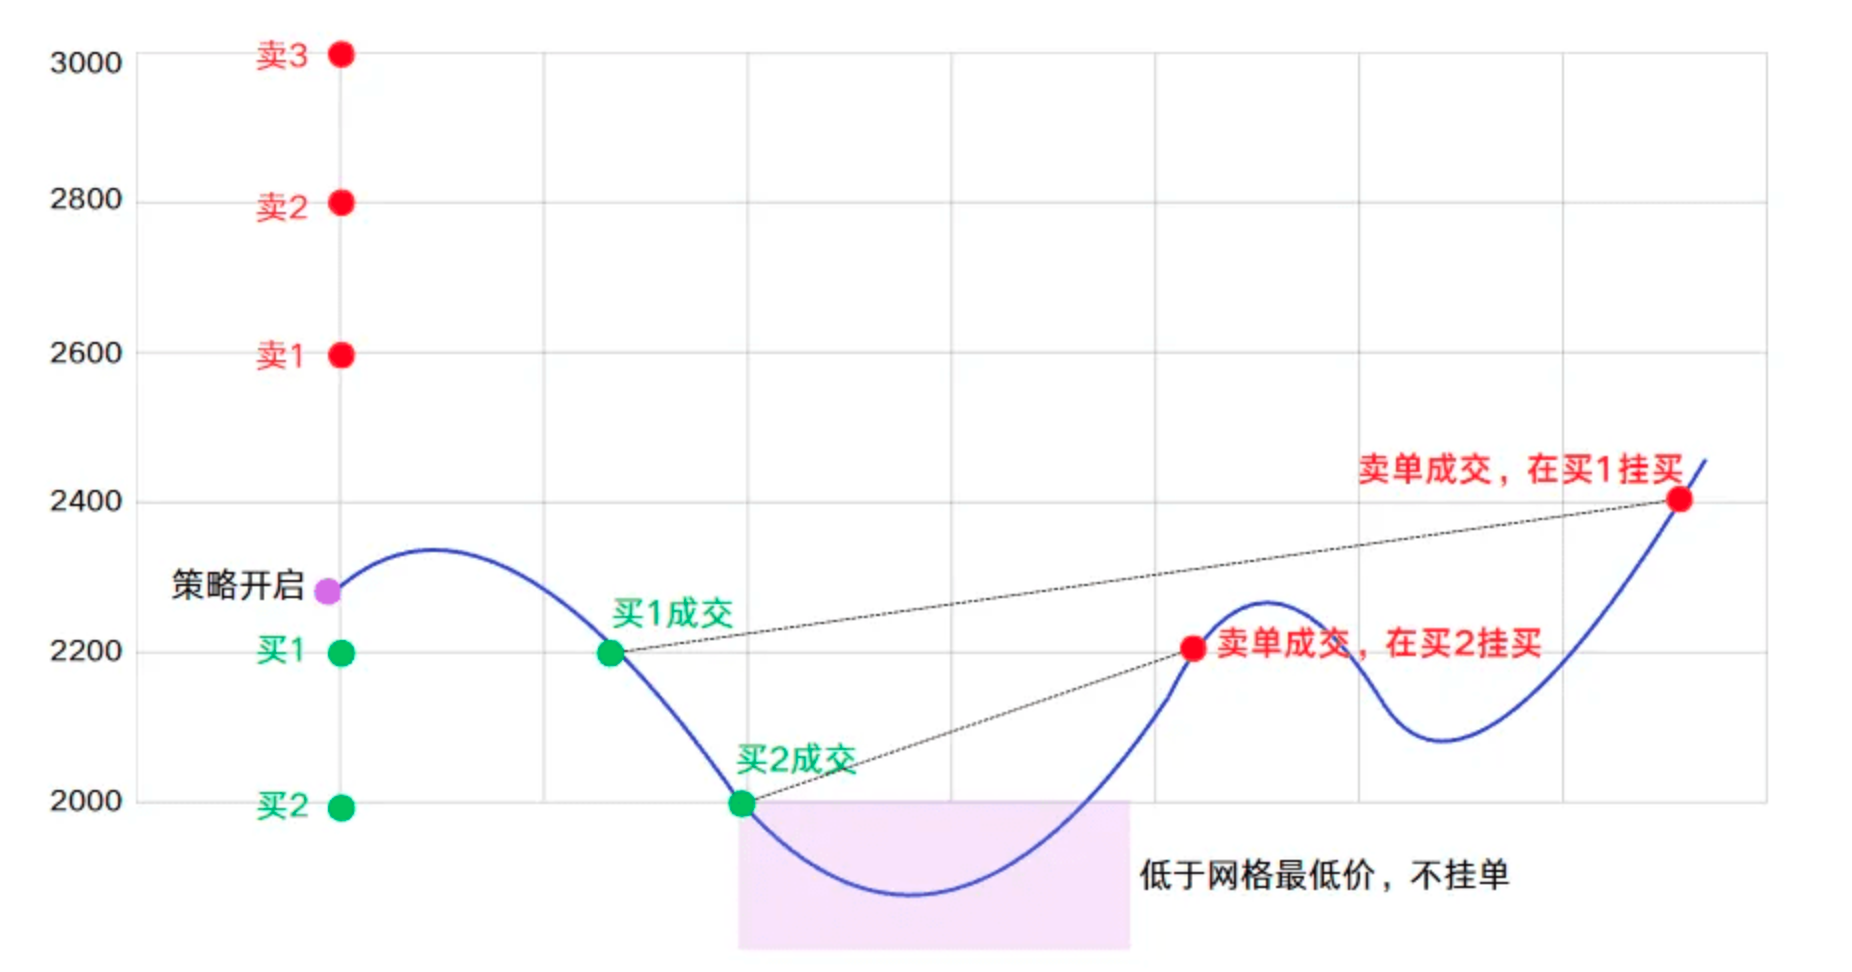
Buy low and sell high, very useful.
This is a strategy from our internal colleagues, with steady returns.
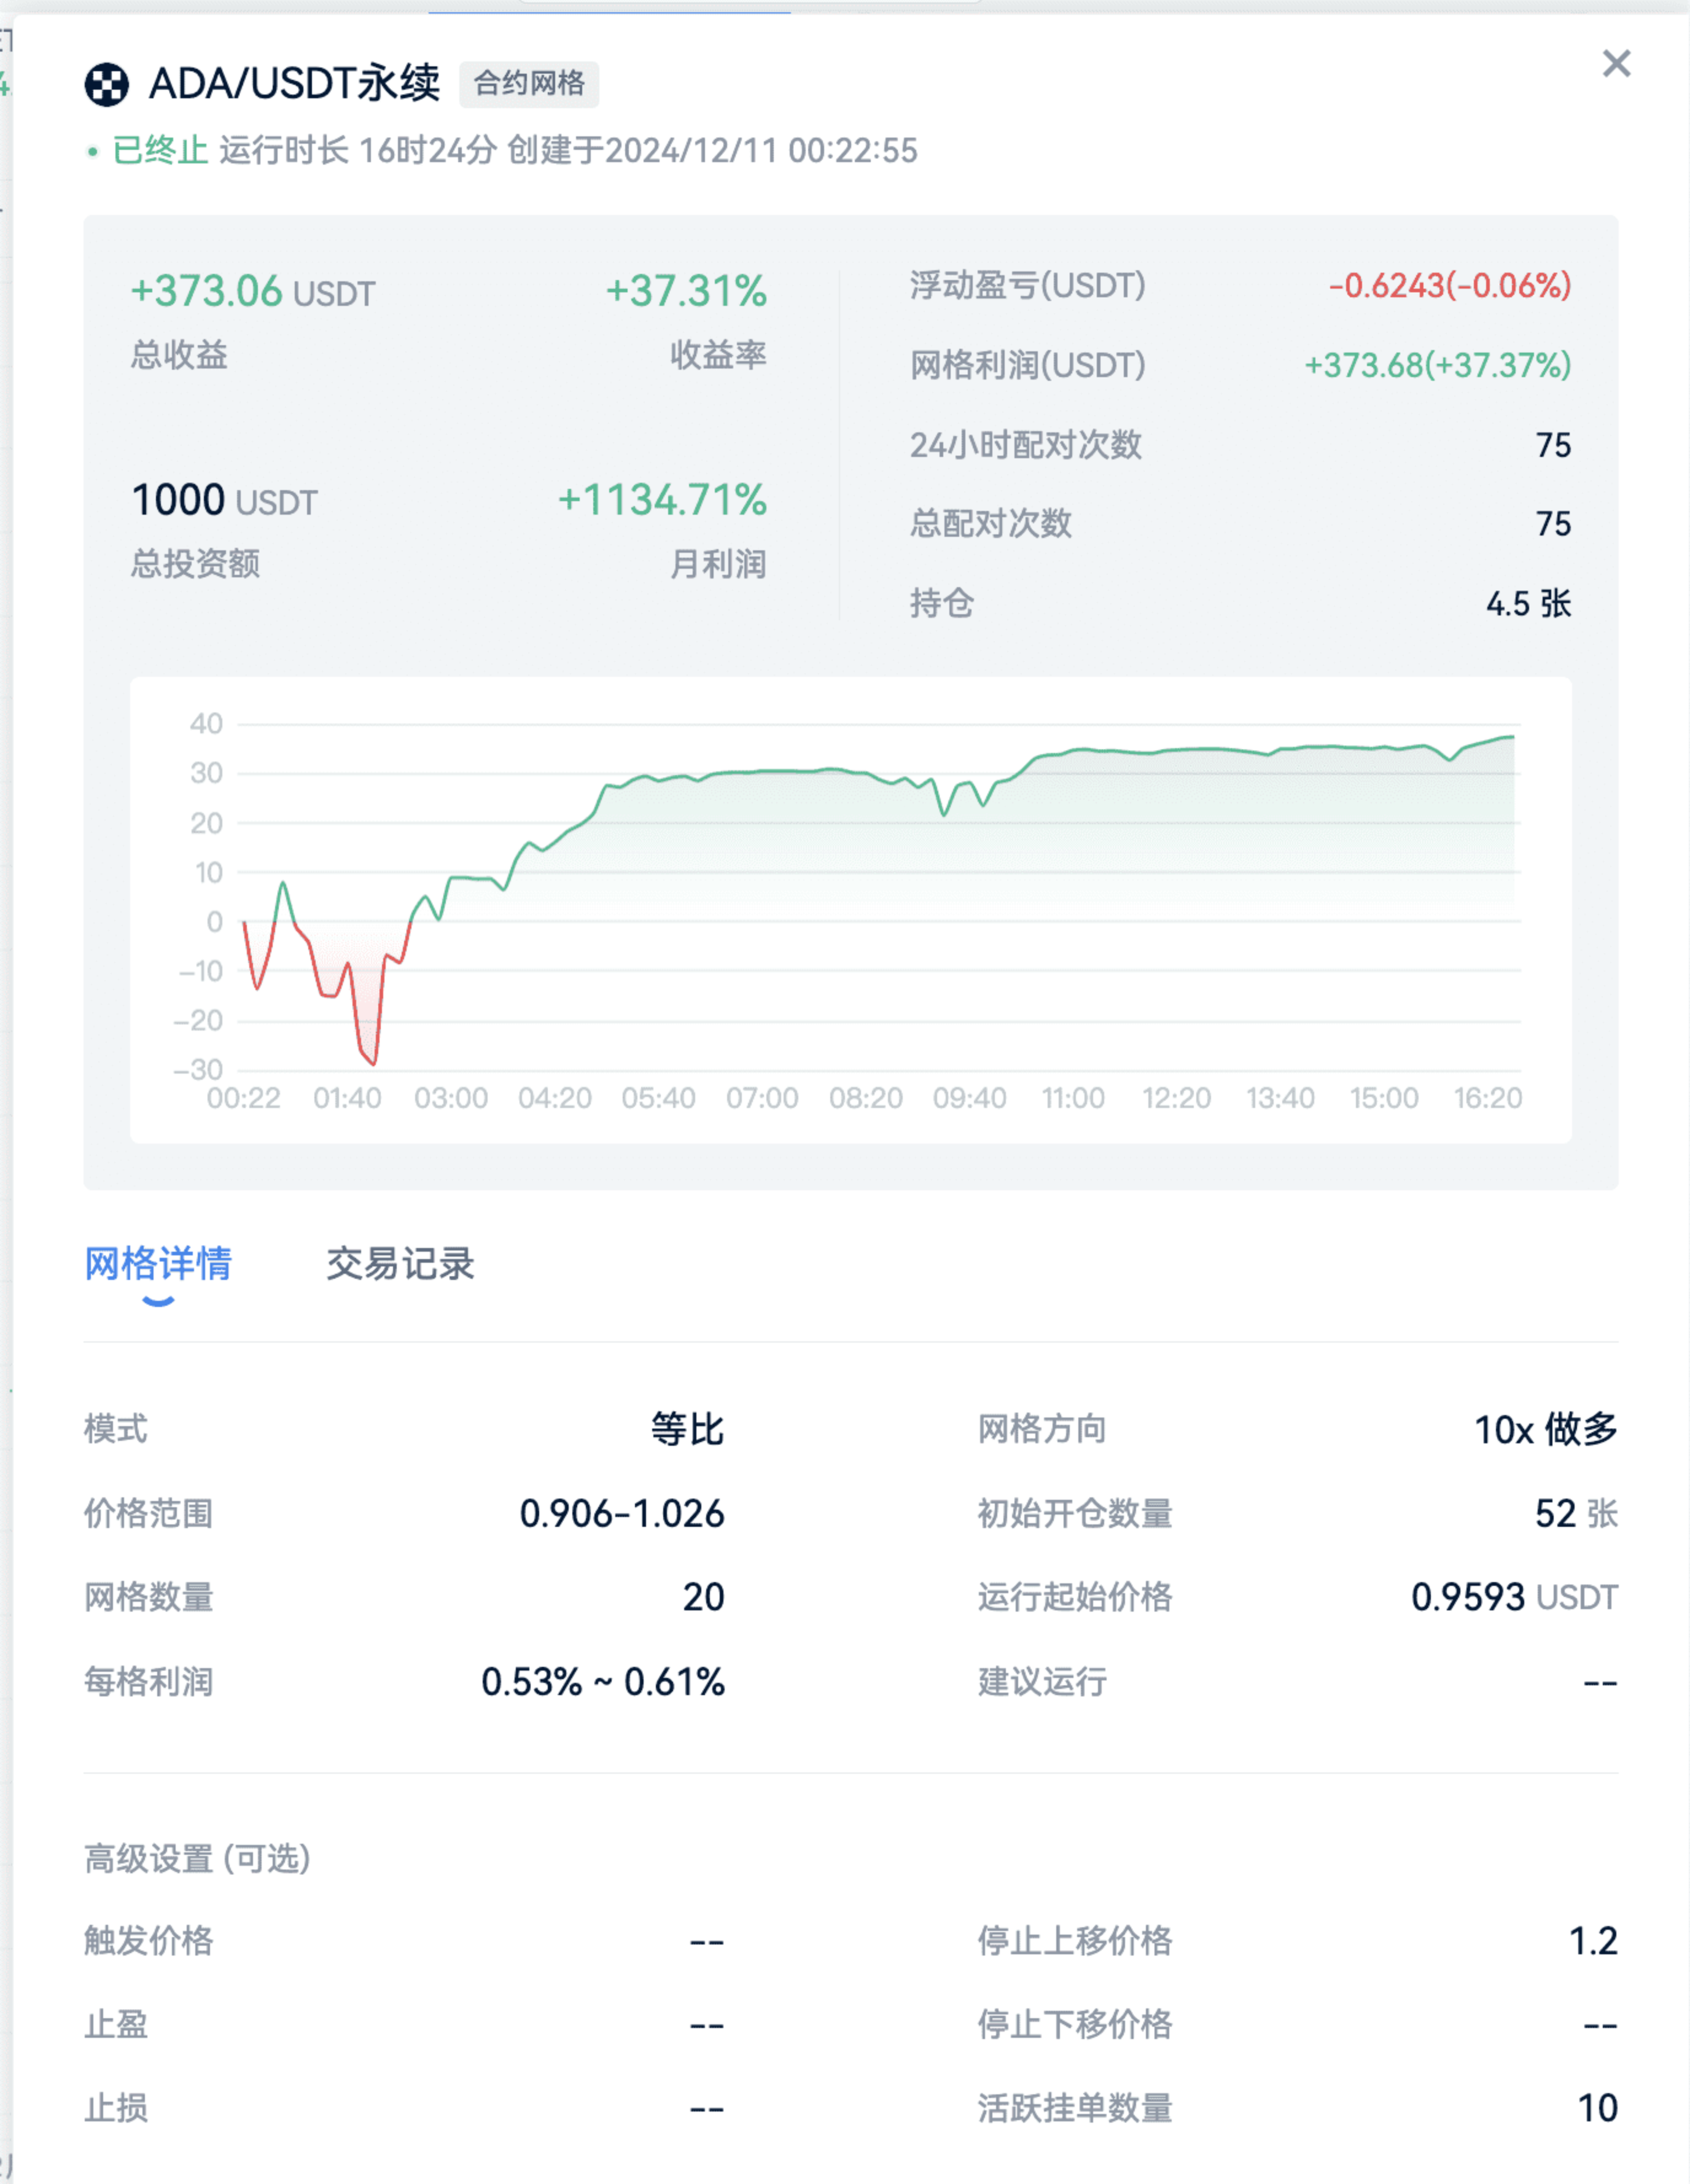
This.
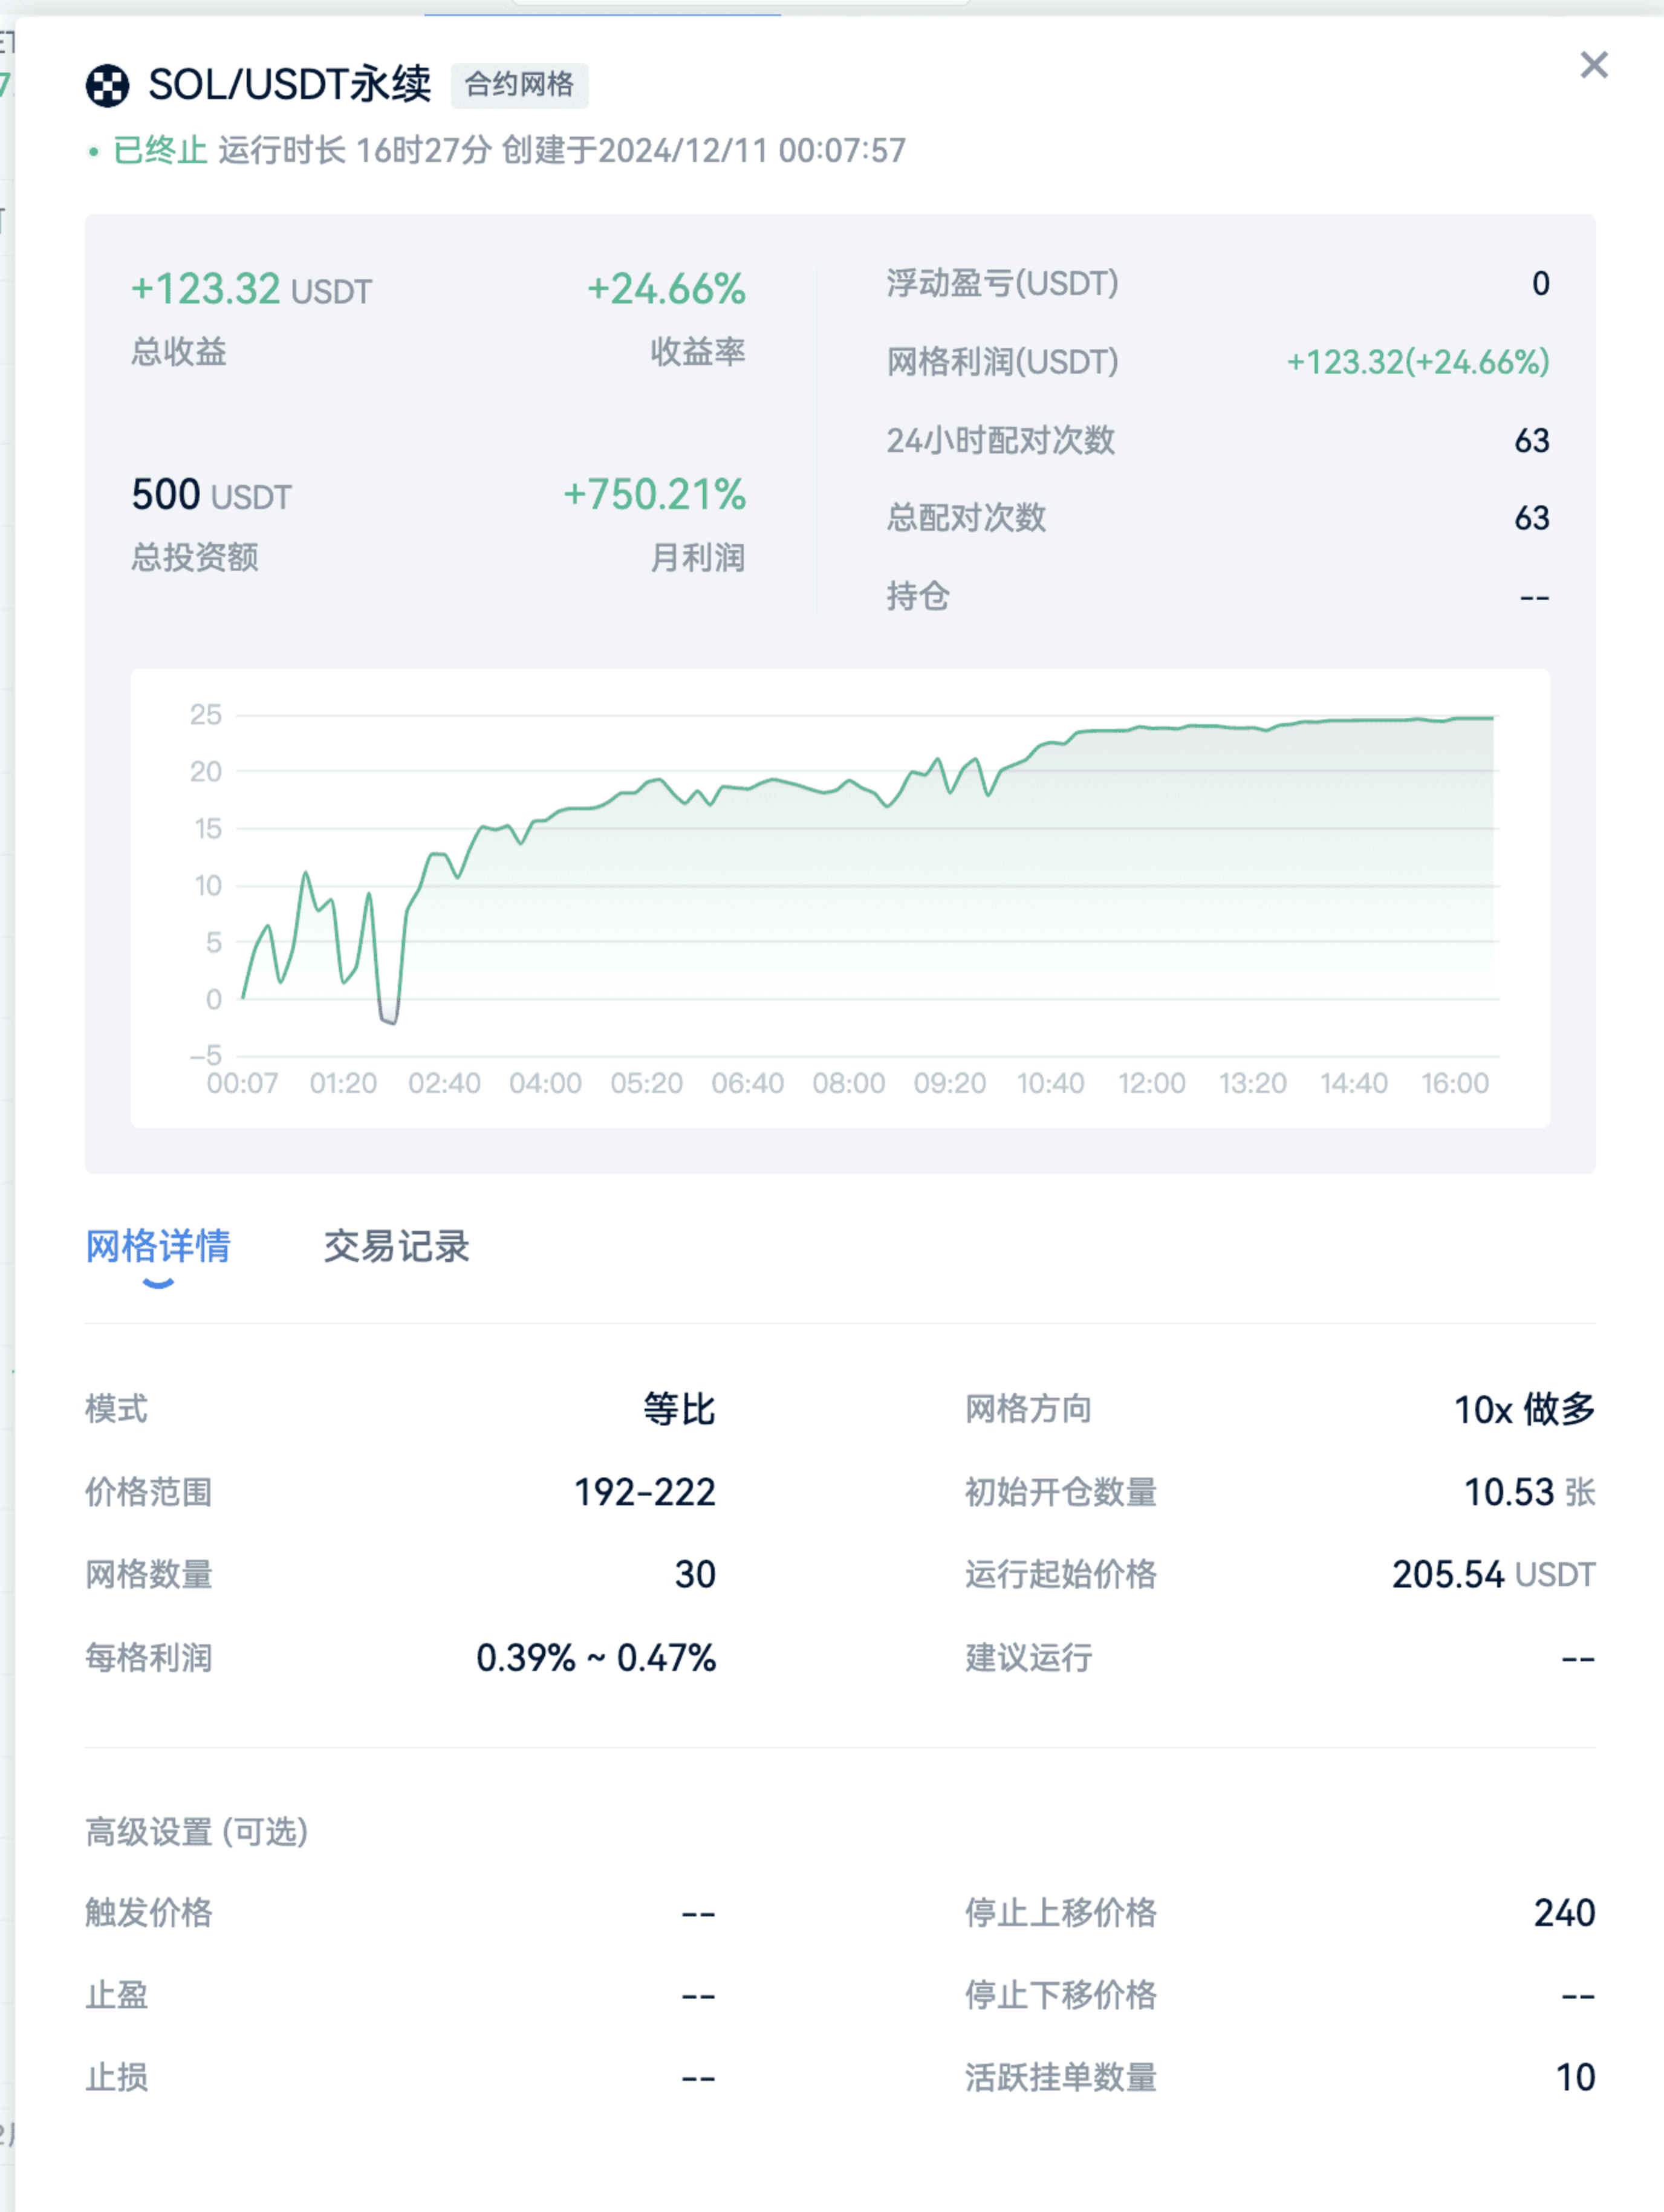
Performance can be verified!

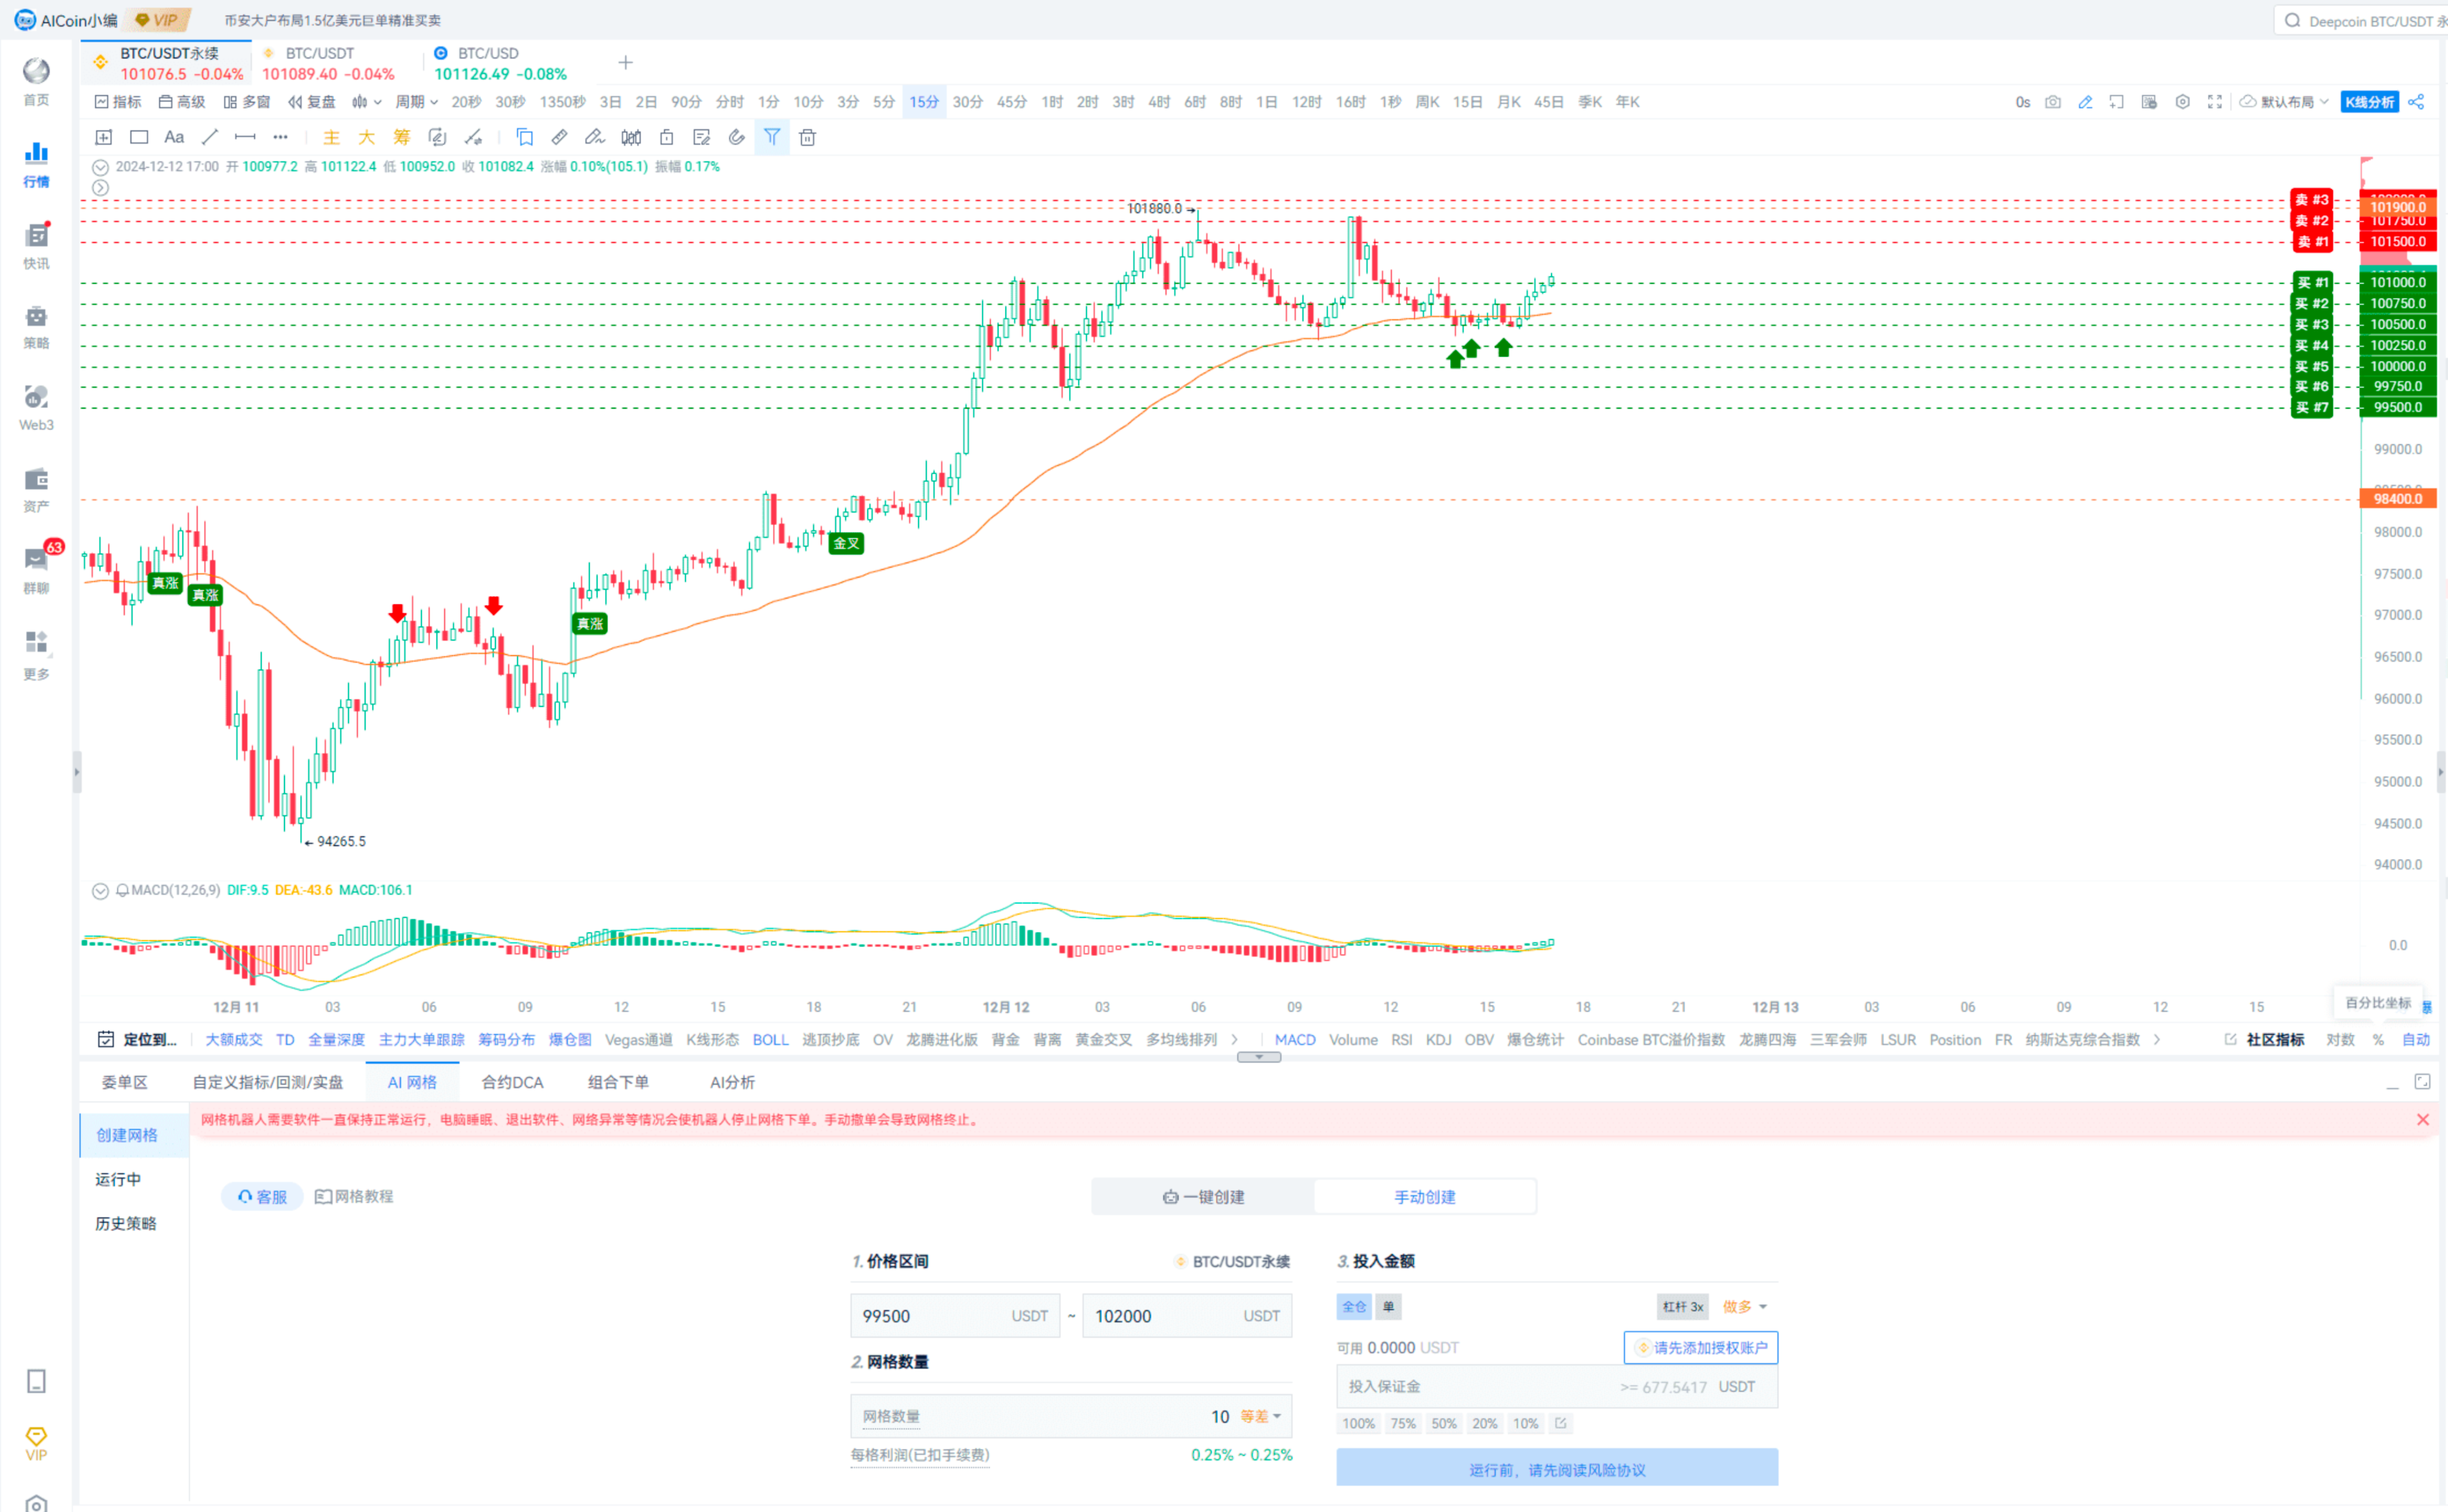
Grid smart tips: Short grid after a surge, long grid after a plunge, neutral grid in oscillation.
For example, in the current market, testing the $100,000 level in oscillation, you can consider opening a neutral grid, targeting the range of $99,500 to $102,000, buying on dips and selling on highs.
Example.
Some friends ask if the grid will get liquidated.
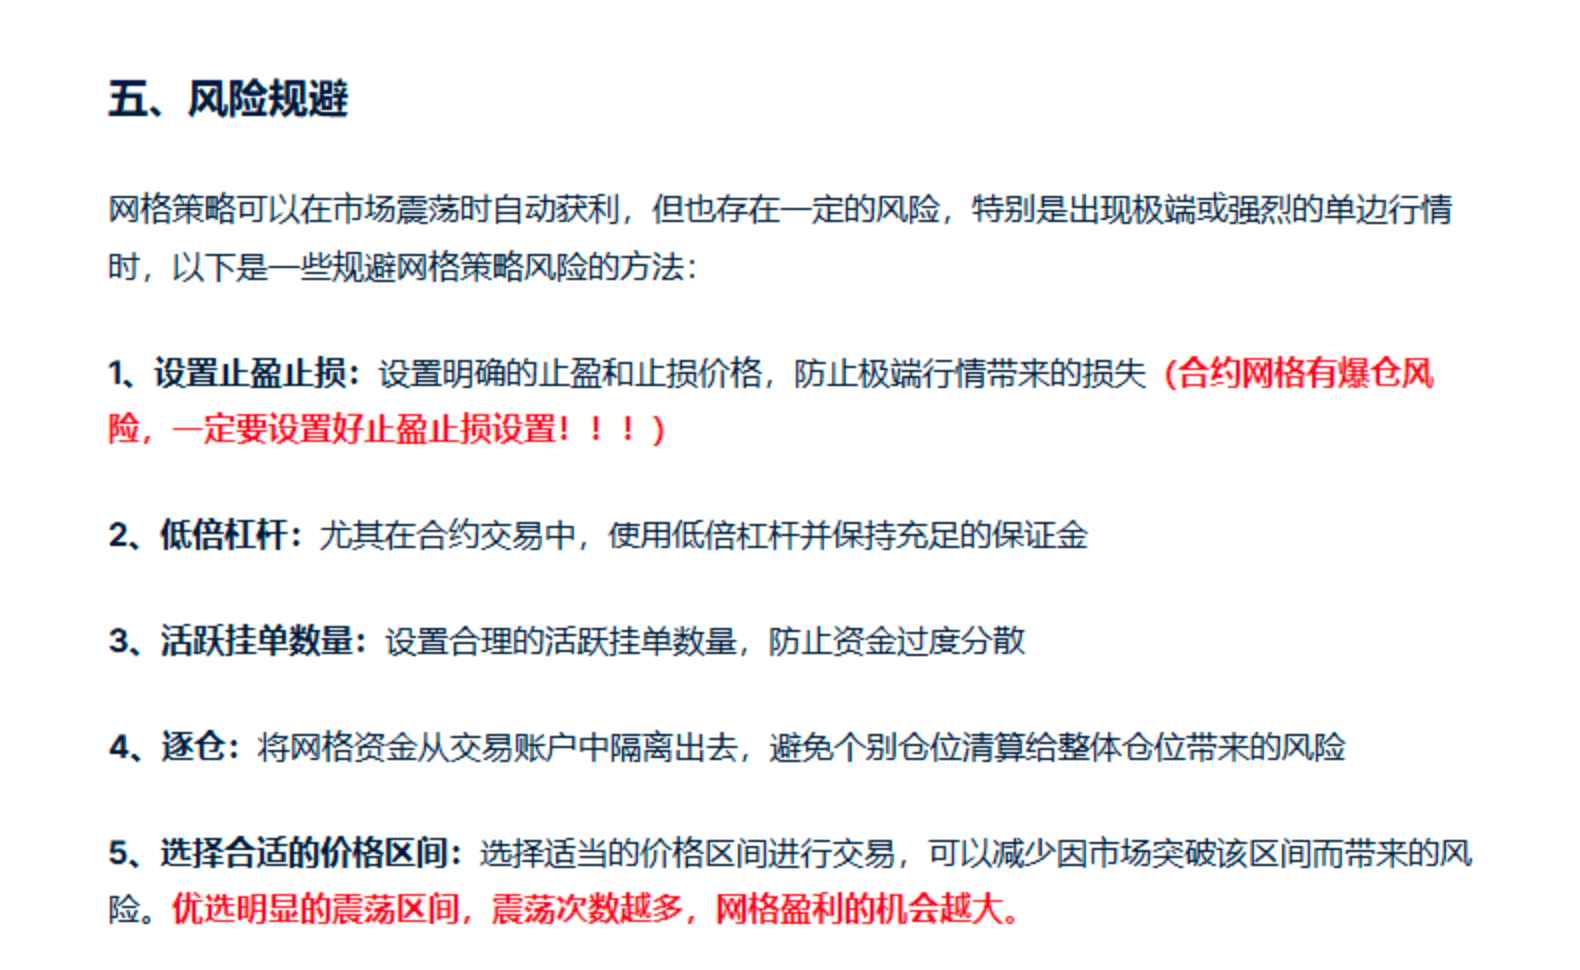
If you are not familiar with mobile grids, you can take a look at this; it can prevent grid breakage, a very good feature.
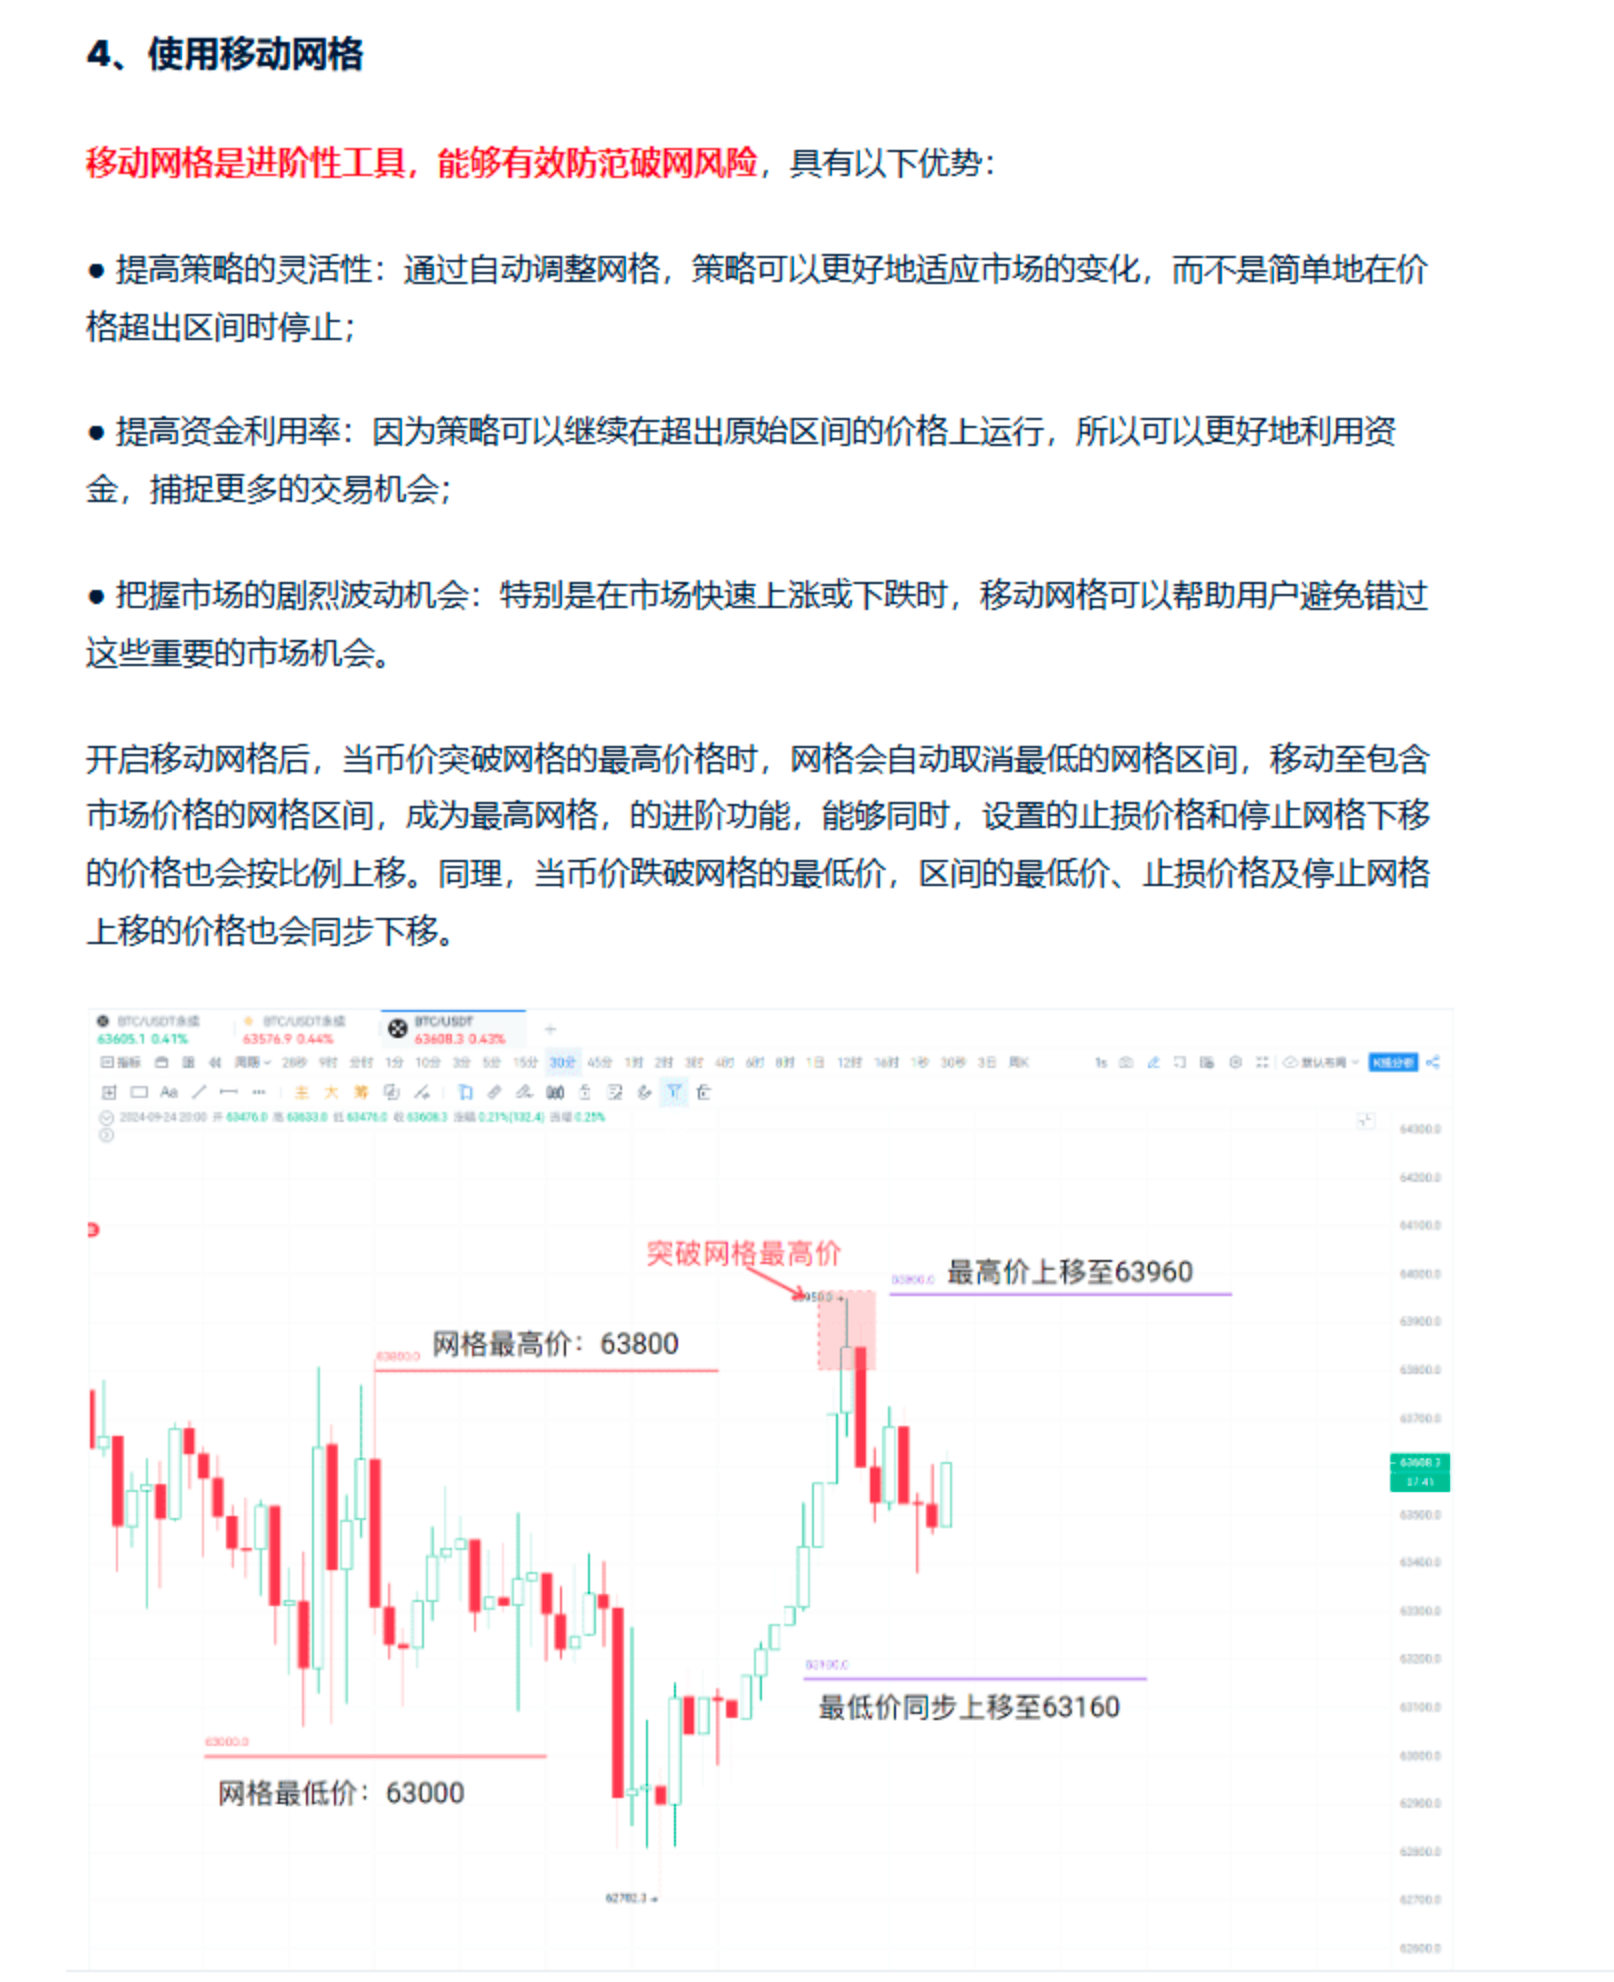
Friends who are afraid of a one-sided market can do long grids or short grids; our grid tools support both!
Our grid strategy is very powerful, supporting both spot and contract types, applicable to any market condition.
Spot market: Especially suitable for oscillating markets, providing investors with stable operational space.
Contract market: Long is suitable for bullish markets, short is suitable for bearish markets, and neutral long-short dual openings perform excellently in oscillating markets.

For grids, just remember this technique: Short grid after a surge, long grid after a plunge, neutral grid in oscillation.
Friends interested in grids can check out these two tutorials, which are beginner-friendly and easy to understand.
https://www.aicoin.com/zh-Hans/article/420406
https://www.aicoin.com/zh-Hans/article/418636
You don't need to worry about parameters; the program has default settings. Just input the amount → click run, and you're good to go.
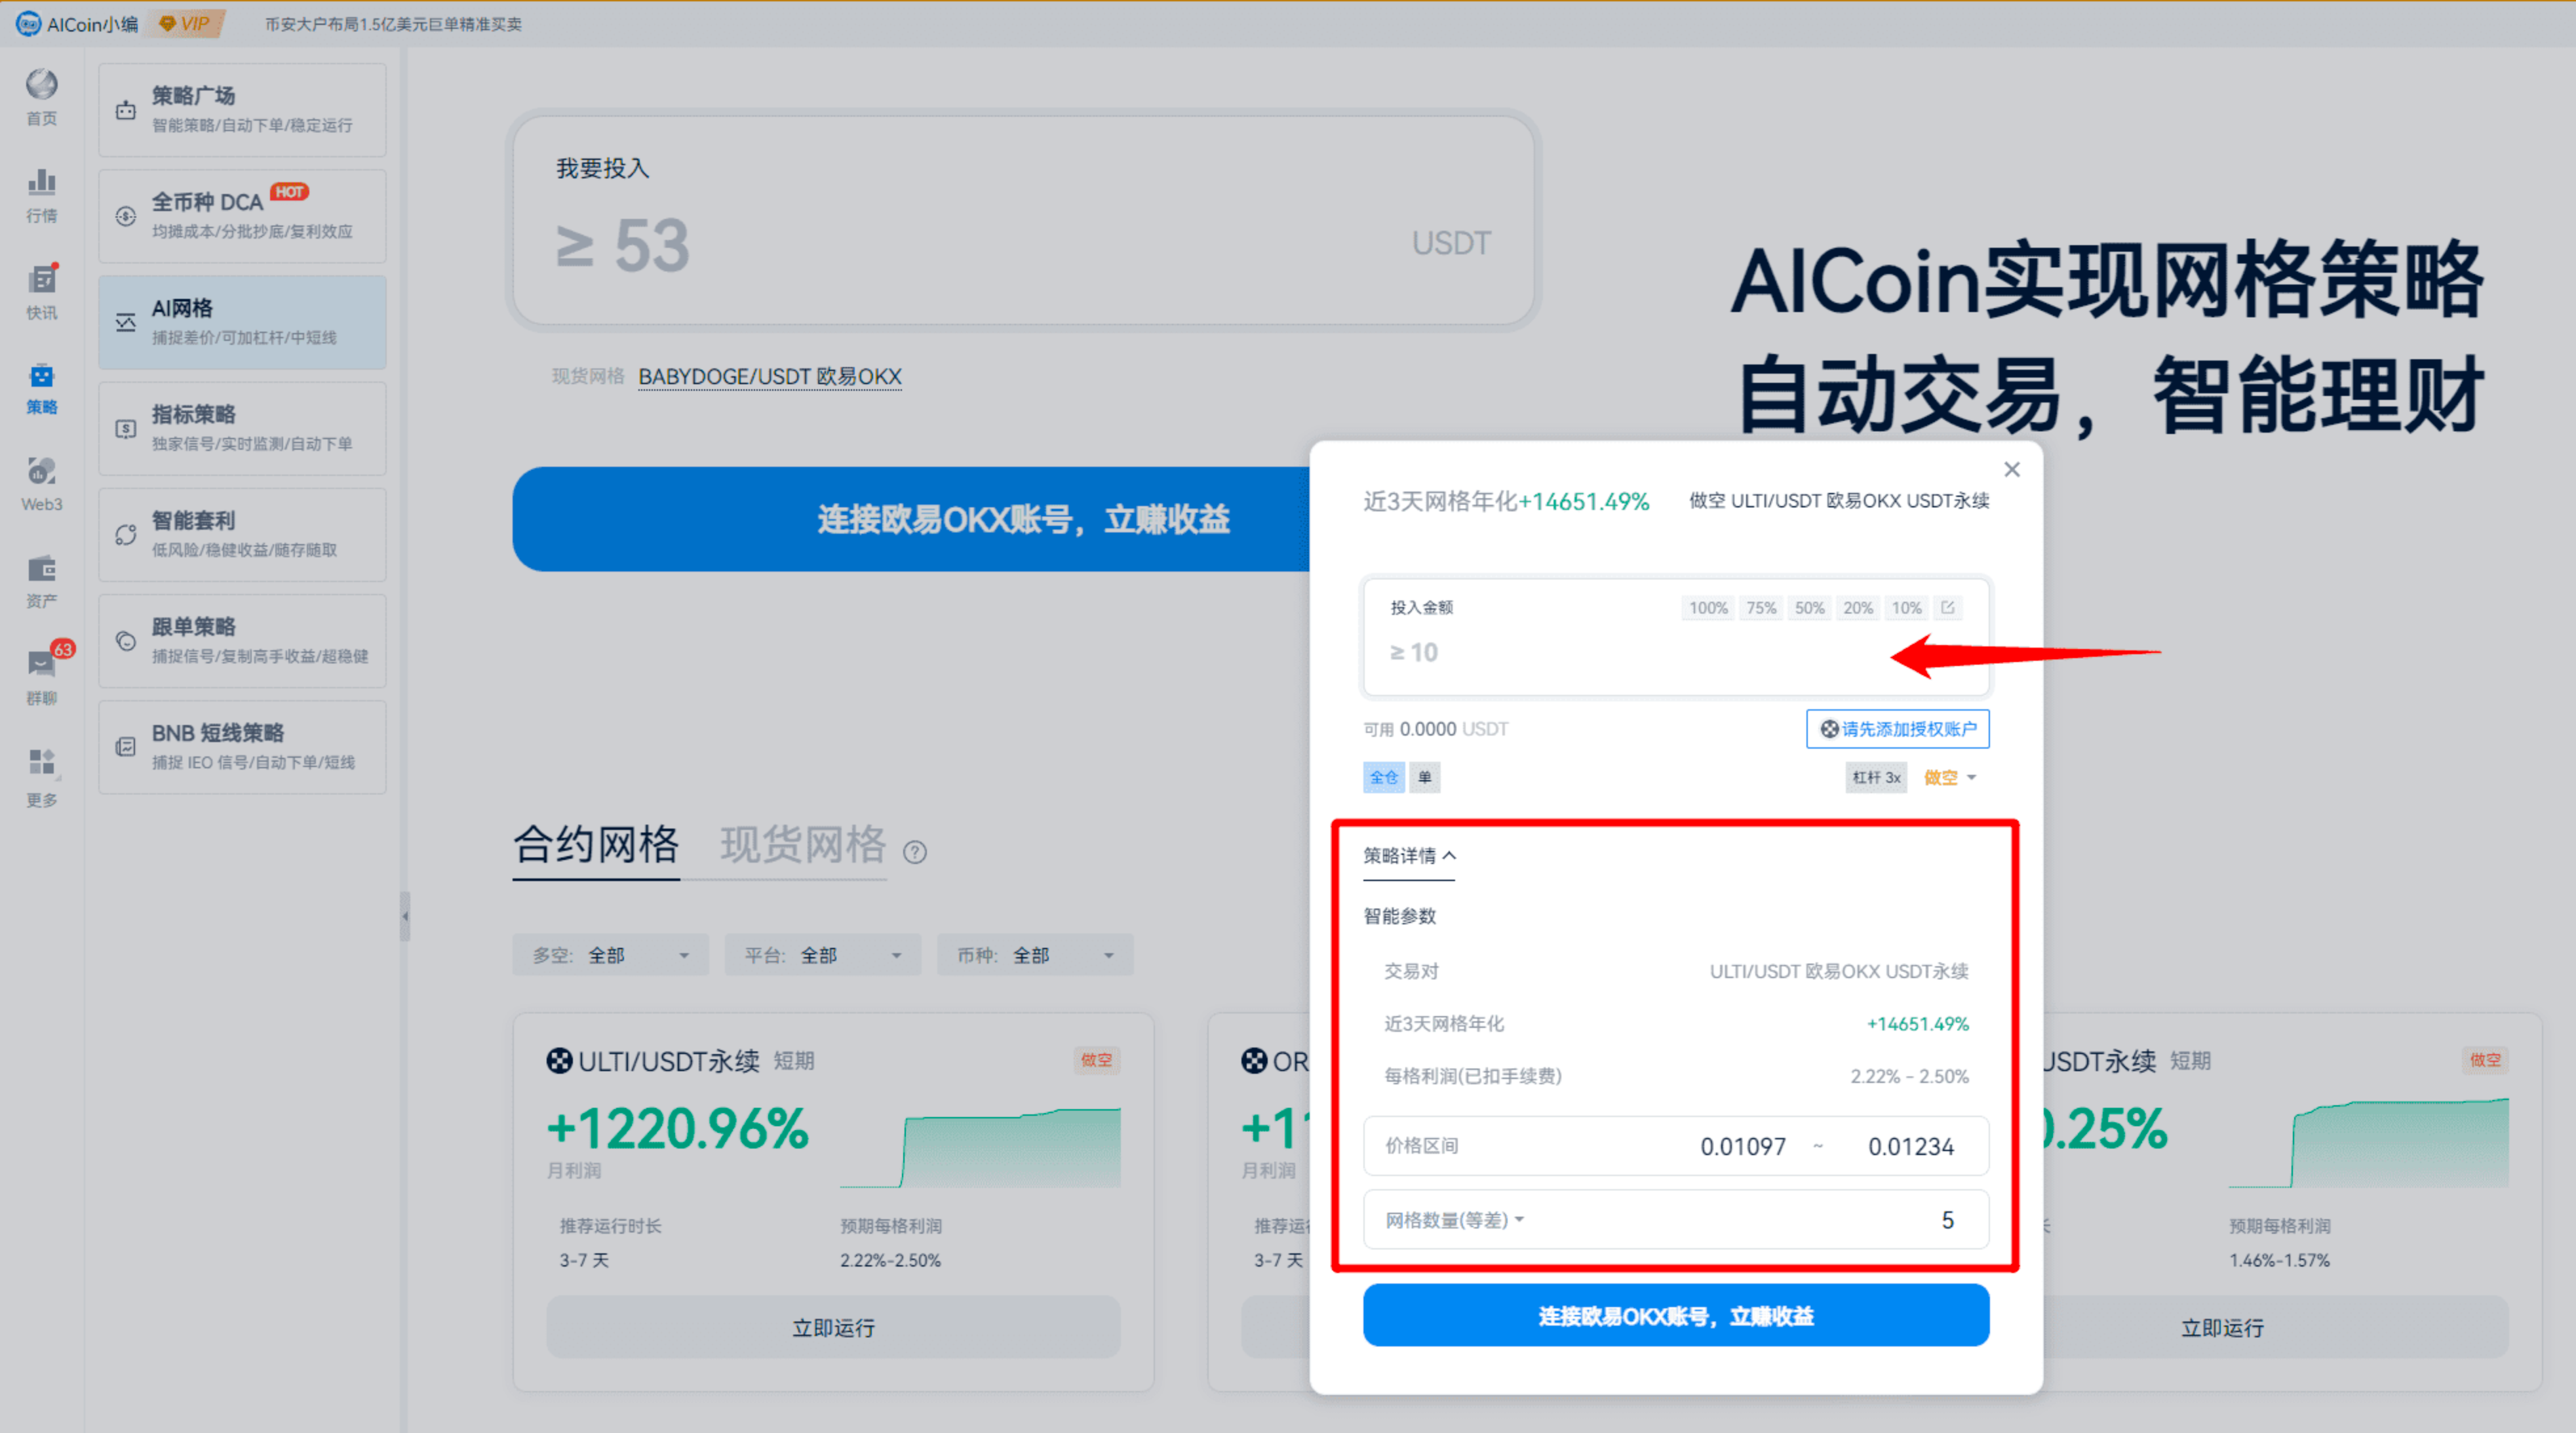
Super simple, zero basic operation.
That's all for the live session!
Thank you all for your attention, stay tuned to our live room.
In a bull market, let's explore the market together and find trading opportunities! Use AICoin well to earn a free life.
Recommended reading:
For more live session content, please follow AICoin's “AICoin - Leading Data Market and Smart Tool Platform” section, and feel free to download AICoin - Leading Data Market and Smart Tool Platform.
免责声明:本文章仅代表作者个人观点,不代表本平台的立场和观点。本文章仅供信息分享,不构成对任何人的任何投资建议。用户与作者之间的任何争议,与本平台无关。如网页中刊载的文章或图片涉及侵权,请提供相关的权利证明和身份证明发送邮件到support@aicoin.com,本平台相关工作人员将会进行核查。


