Zhou Yanling: The Decline on 12.11 is for a Better Rise - Today's Bitcoin and Ethereum Latest Trend Prediction Analysis and Trading Strategy
There are many types of breakouts, so why are people so fixated on them? It's because they want to see the trend develop, so you inevitably have to go through price breakouts - technical breakouts - cycle breakouts - trend breakouts. This is a complete sequence of market operation, and it shouldn't feel too complicated. Currently, Bitcoin has completed the first two steps. You might feel it's slow, but that's because Bitcoin's oscillation cycle is relatively long. Each rise and fall has fluctuations that can be traced, and these fluctuations will form some technical patterns and structures. Zhou Yanling has analyzed these in previous articles about Bitcoin, including the emergence of converging triangles, expanding triangles, rectangular consolidations, and subsequent step-like rises. These are all transformations of patterns. Right now, Bitcoin has broken through all these patterns and is currently in a step-like rising trend, which has not yet been terminated. This means that in the upcoming period, there is still an opportunity to wait for a chance to go long on Bitcoin during pullbacks.
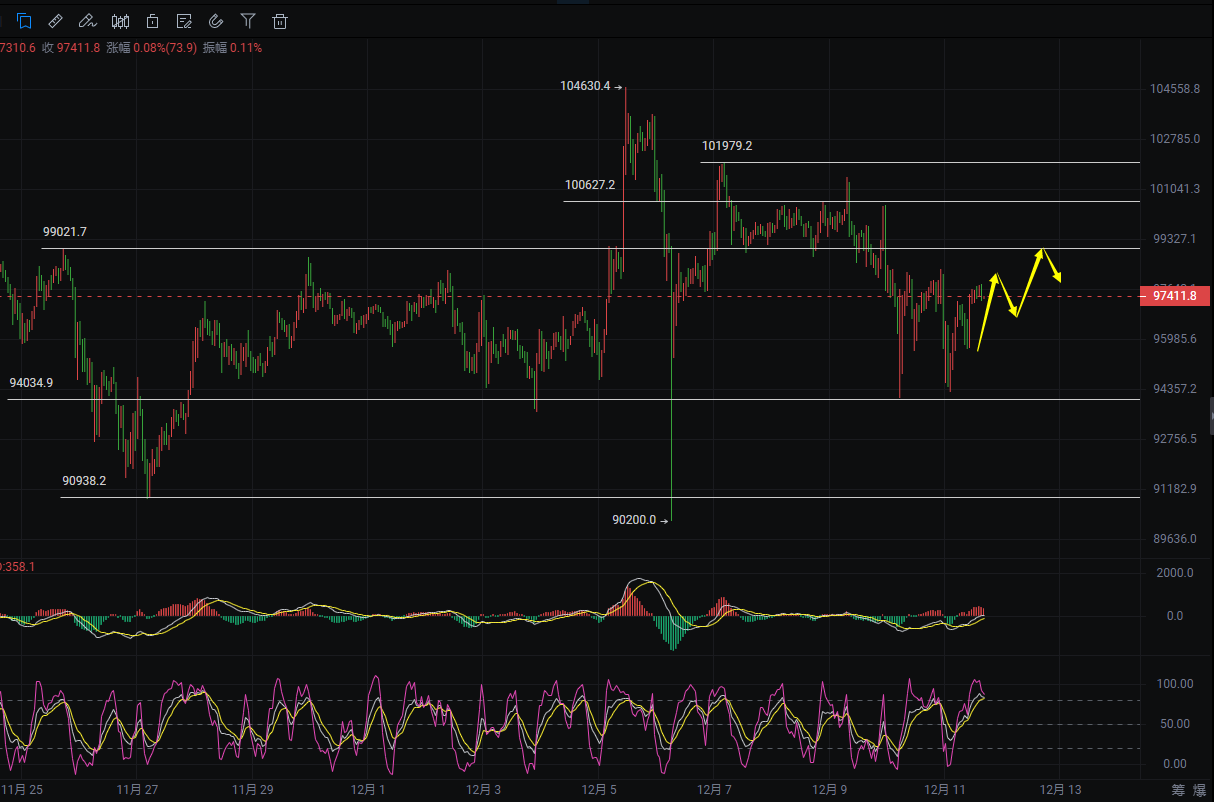
The horizontal trend line represents the resistance during consolidation, while the previous downtrend line was touched again in the early hours of last night, with the midpoint at 95500. This is the key point to observe whether Bitcoin is inducing longs. If the market continues to break down today and also breaks below 94000, it would represent a decline of nearly 8000 points compared to the recent high, which would indicate not just a bullish outlook but signs of a peak in this round of rises. From the daily chart, this morning closed with a bullish candle, showing an increase compared to the previous day, but still below recent highs. The current MACD histogram is positive and gradually shortening, indicating a weakening of bearish strength, which may lead to a rebound. The RSI is currently at 52.4, in the neutral zone, not entering overbought or oversold territory, indicating relatively stable market sentiment. The 7-hour EMA (97266.2) is close to the 30-hour EMA (97109.2), with the 120-hour EMA (98079.5) above them. The short-term moving averages provide support, but the current weak adjustment has not yet completed, and re-establishing long positions requires waiting for the right opportunity.
12.11 Bitcoin Trading Strategy:
Go long at 96000-96800, stop loss below 95300, target 97900-98500, continue to look for 99500 nearby.
Go short at 99800-99200, stop loss above 100500, target 98300-97600.
12.11 Ethereum Trading Strategy:
Go long at 3610-3650, stop loss below 3560, target 3730-3780, continue to look for 3930 nearby.
Go short at 3790-3750, stop loss above 3840, target 3660-3620.
[The above analysis and strategies are for reference only. Please bear the risks yourself. The article review and publication may have delays, and the strategies may not be timely. Specific operations should follow Yanling's real-time strategies.]

This article is exclusively shared by senior analyst Zhou Yanling (WeChat public account: Zhou Yanling). The author has been engaged in financial market investment research for over ten years, currently mainly analyzing and guiding BTC, ETH, DOT, DOGE, LTC, FIL, EOS, XRP, BCH, ETC, BSV, and other cryptocurrency contracts/spot operations. For more real-time community guidance, consultation on unblocking positions, and learning trading skills, you can follow the teacher's public account: Zhou Yanling to find the teacher.
免责声明:本文章仅代表作者个人观点,不代表本平台的立场和观点。本文章仅供信息分享,不构成对任何人的任何投资建议。用户与作者之间的任何争议,与本平台无关。如网页中刊载的文章或图片涉及侵权,请提供相关的权利证明和身份证明发送邮件到support@aicoin.com,本平台相关工作人员将会进行核查。


