On December 9th at 16:00, the AICoin editor conducted a graphic and text sharing session on the "Advanced EMA Indicator Strategy." Below is a summary of the live content.
Today's live session mainly shared: How to master the EMA indicator.
There are three classic uses of the EMA! Each one is a classic.
Identifying Major Trends
If you want to identify major trends, the first classic method is the zero-crossing method. I highly recommend everyone to learn this method well.
It's very simple; with just one line, you can possess the skills that many technical analysts have.
This line is the DIF line of the EMA indicator.
First, let's take a look at the EMA indicator.
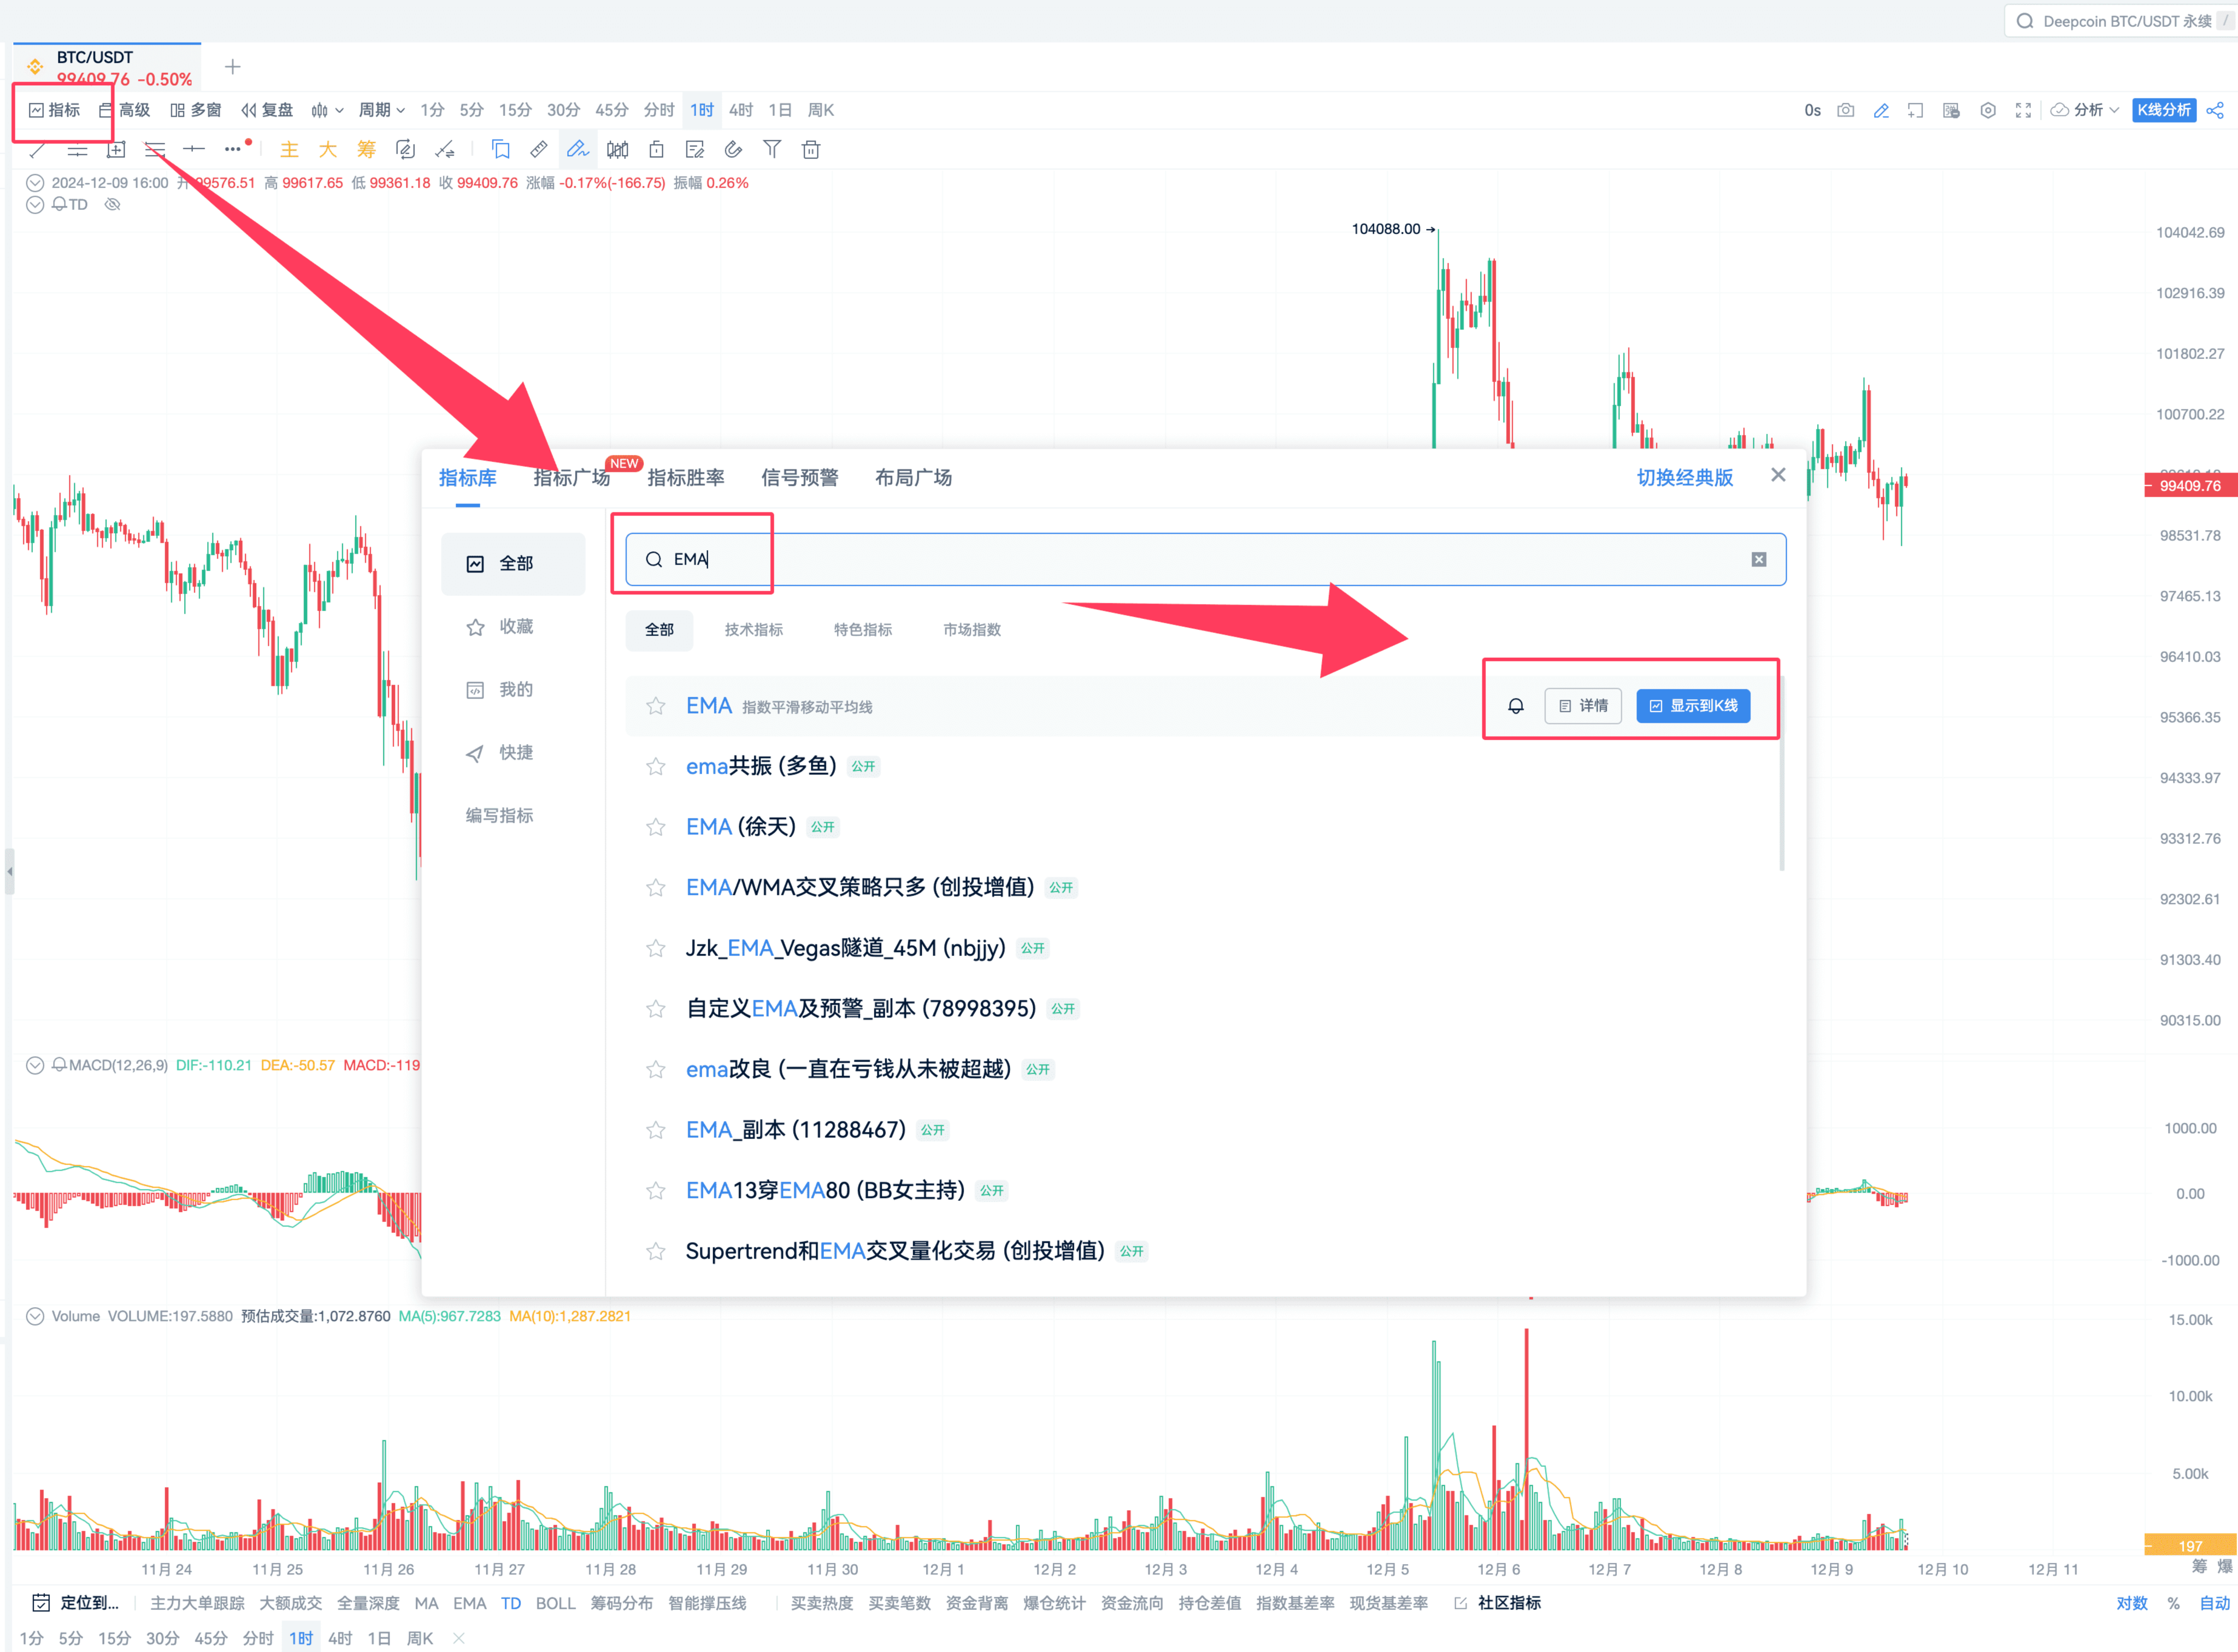
We will use it to see how Bitcoin performs with this indicator.
We need to set the parameters to 12; 26.
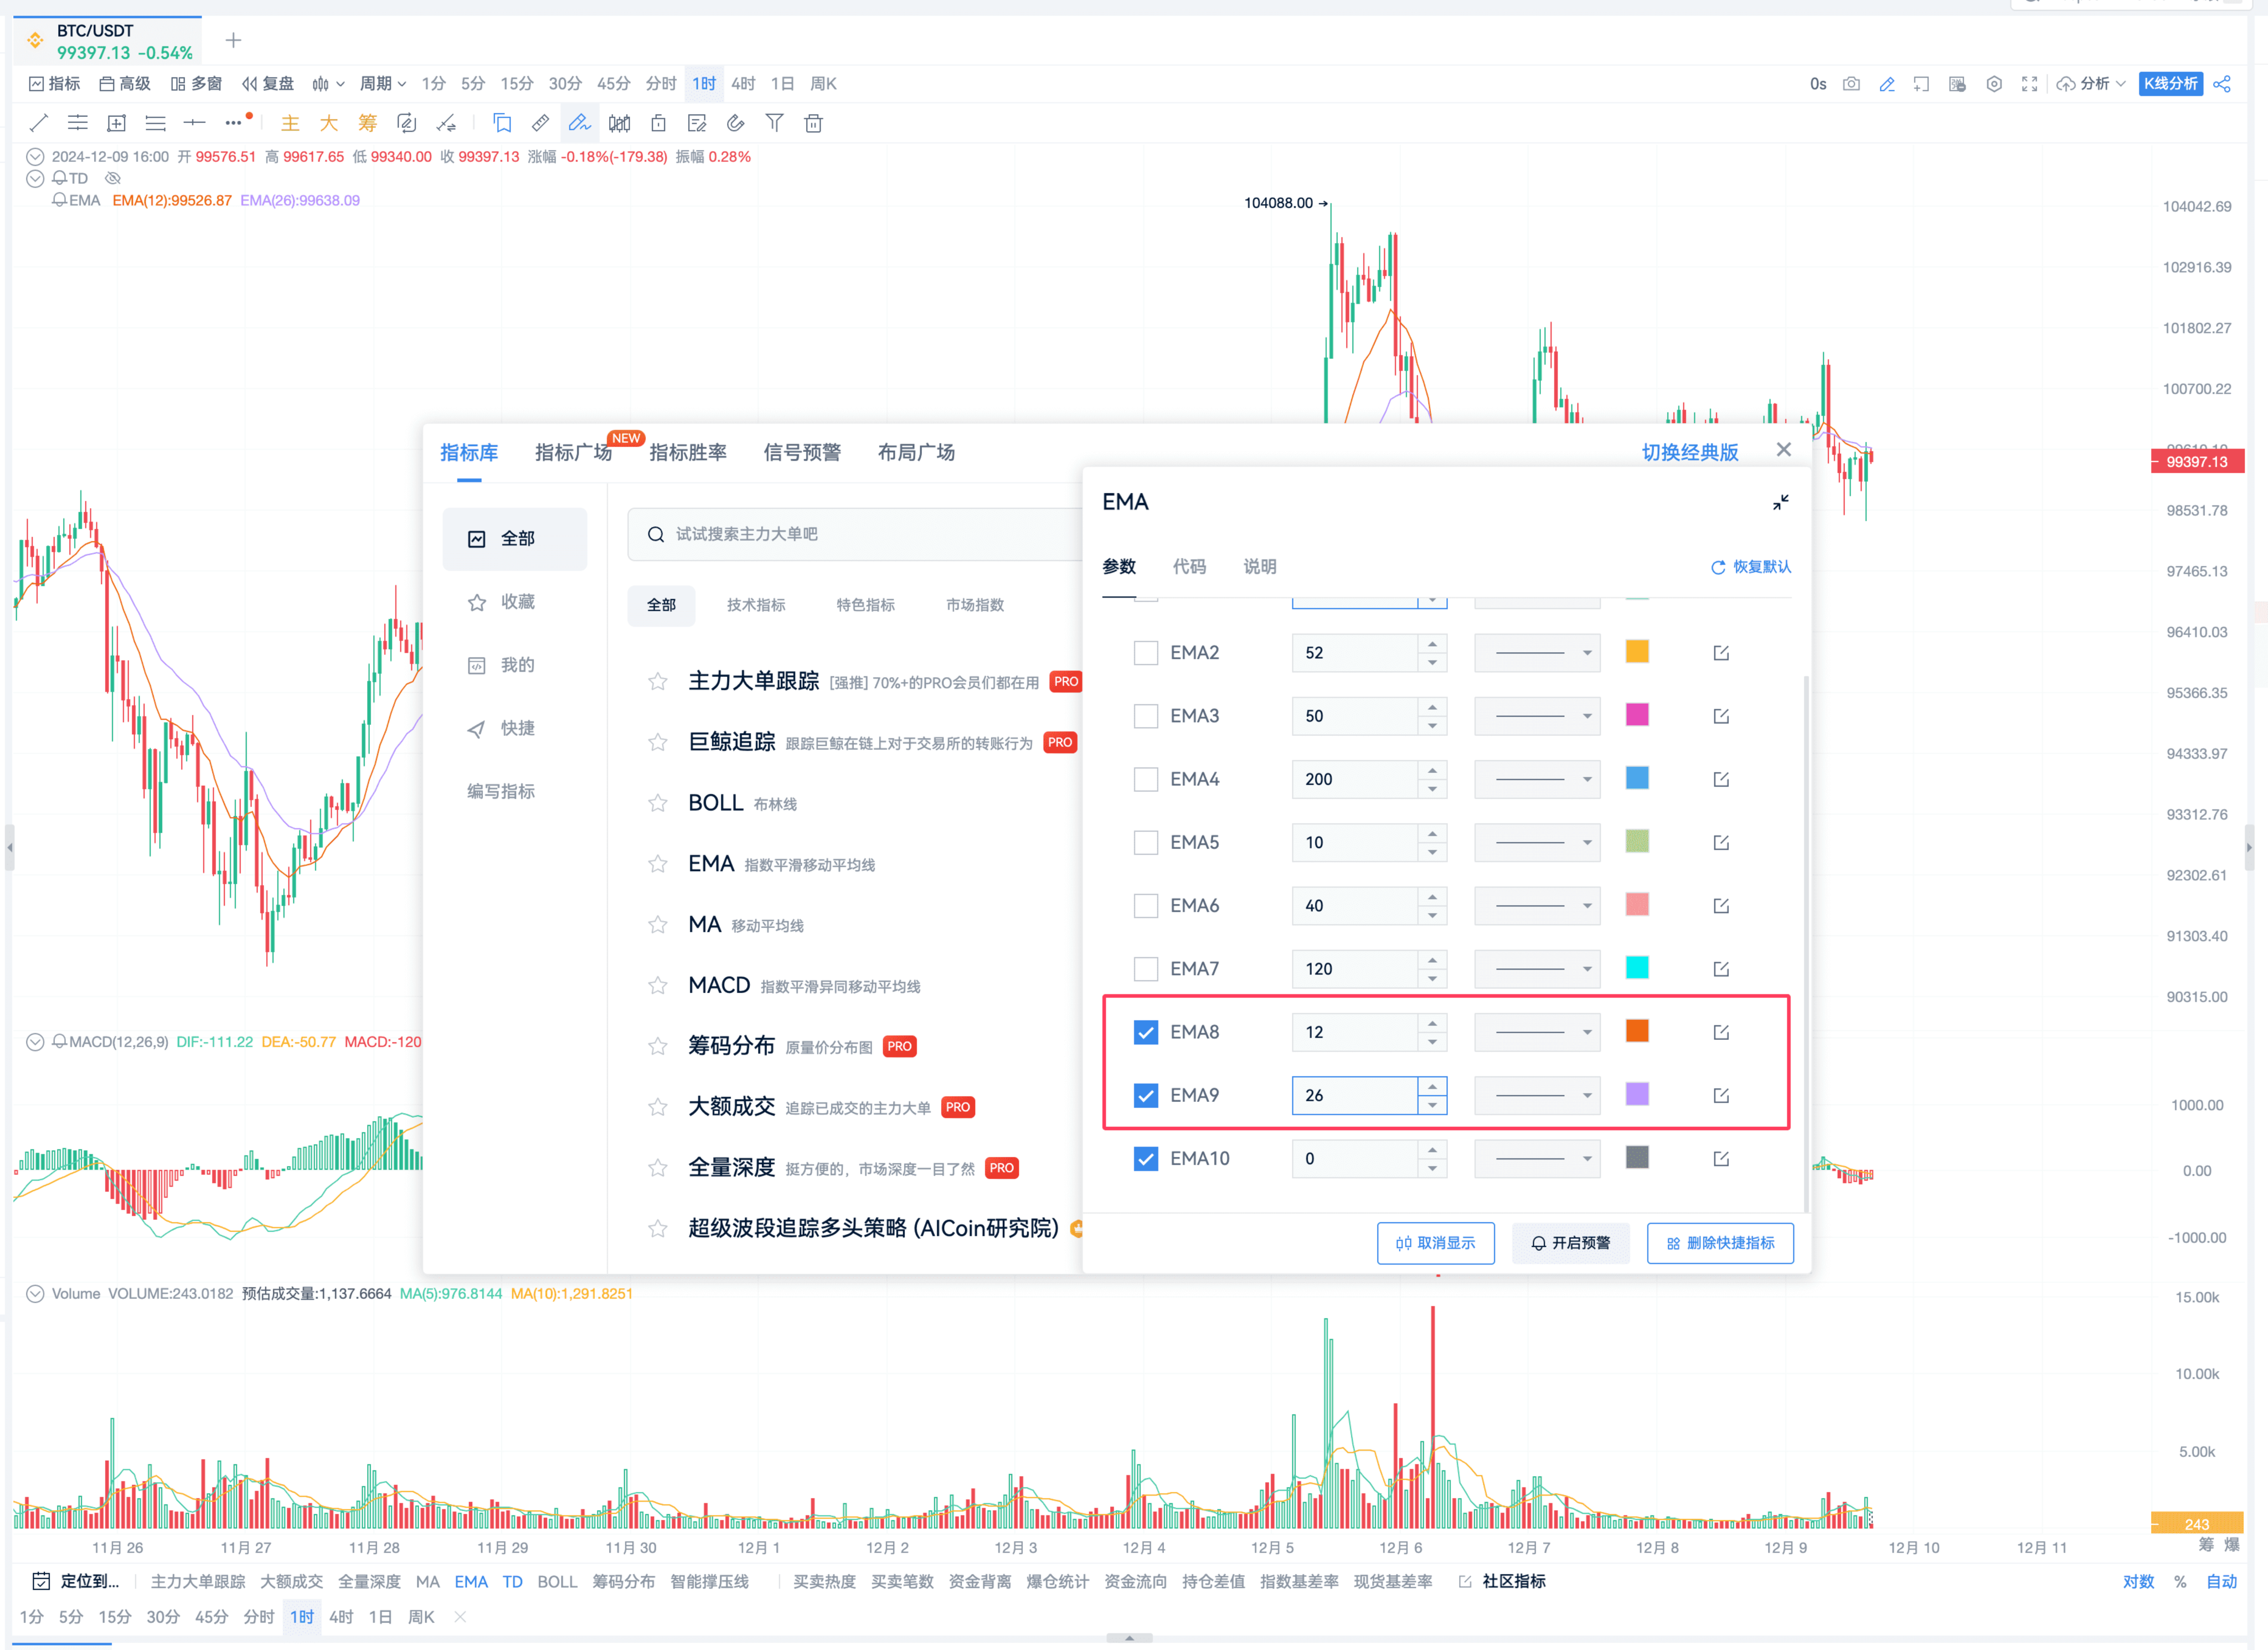
After adding it, we will analyze it using a 1-hour timeframe.
Here we can see that every golden cross is an opportunity to enter the market.
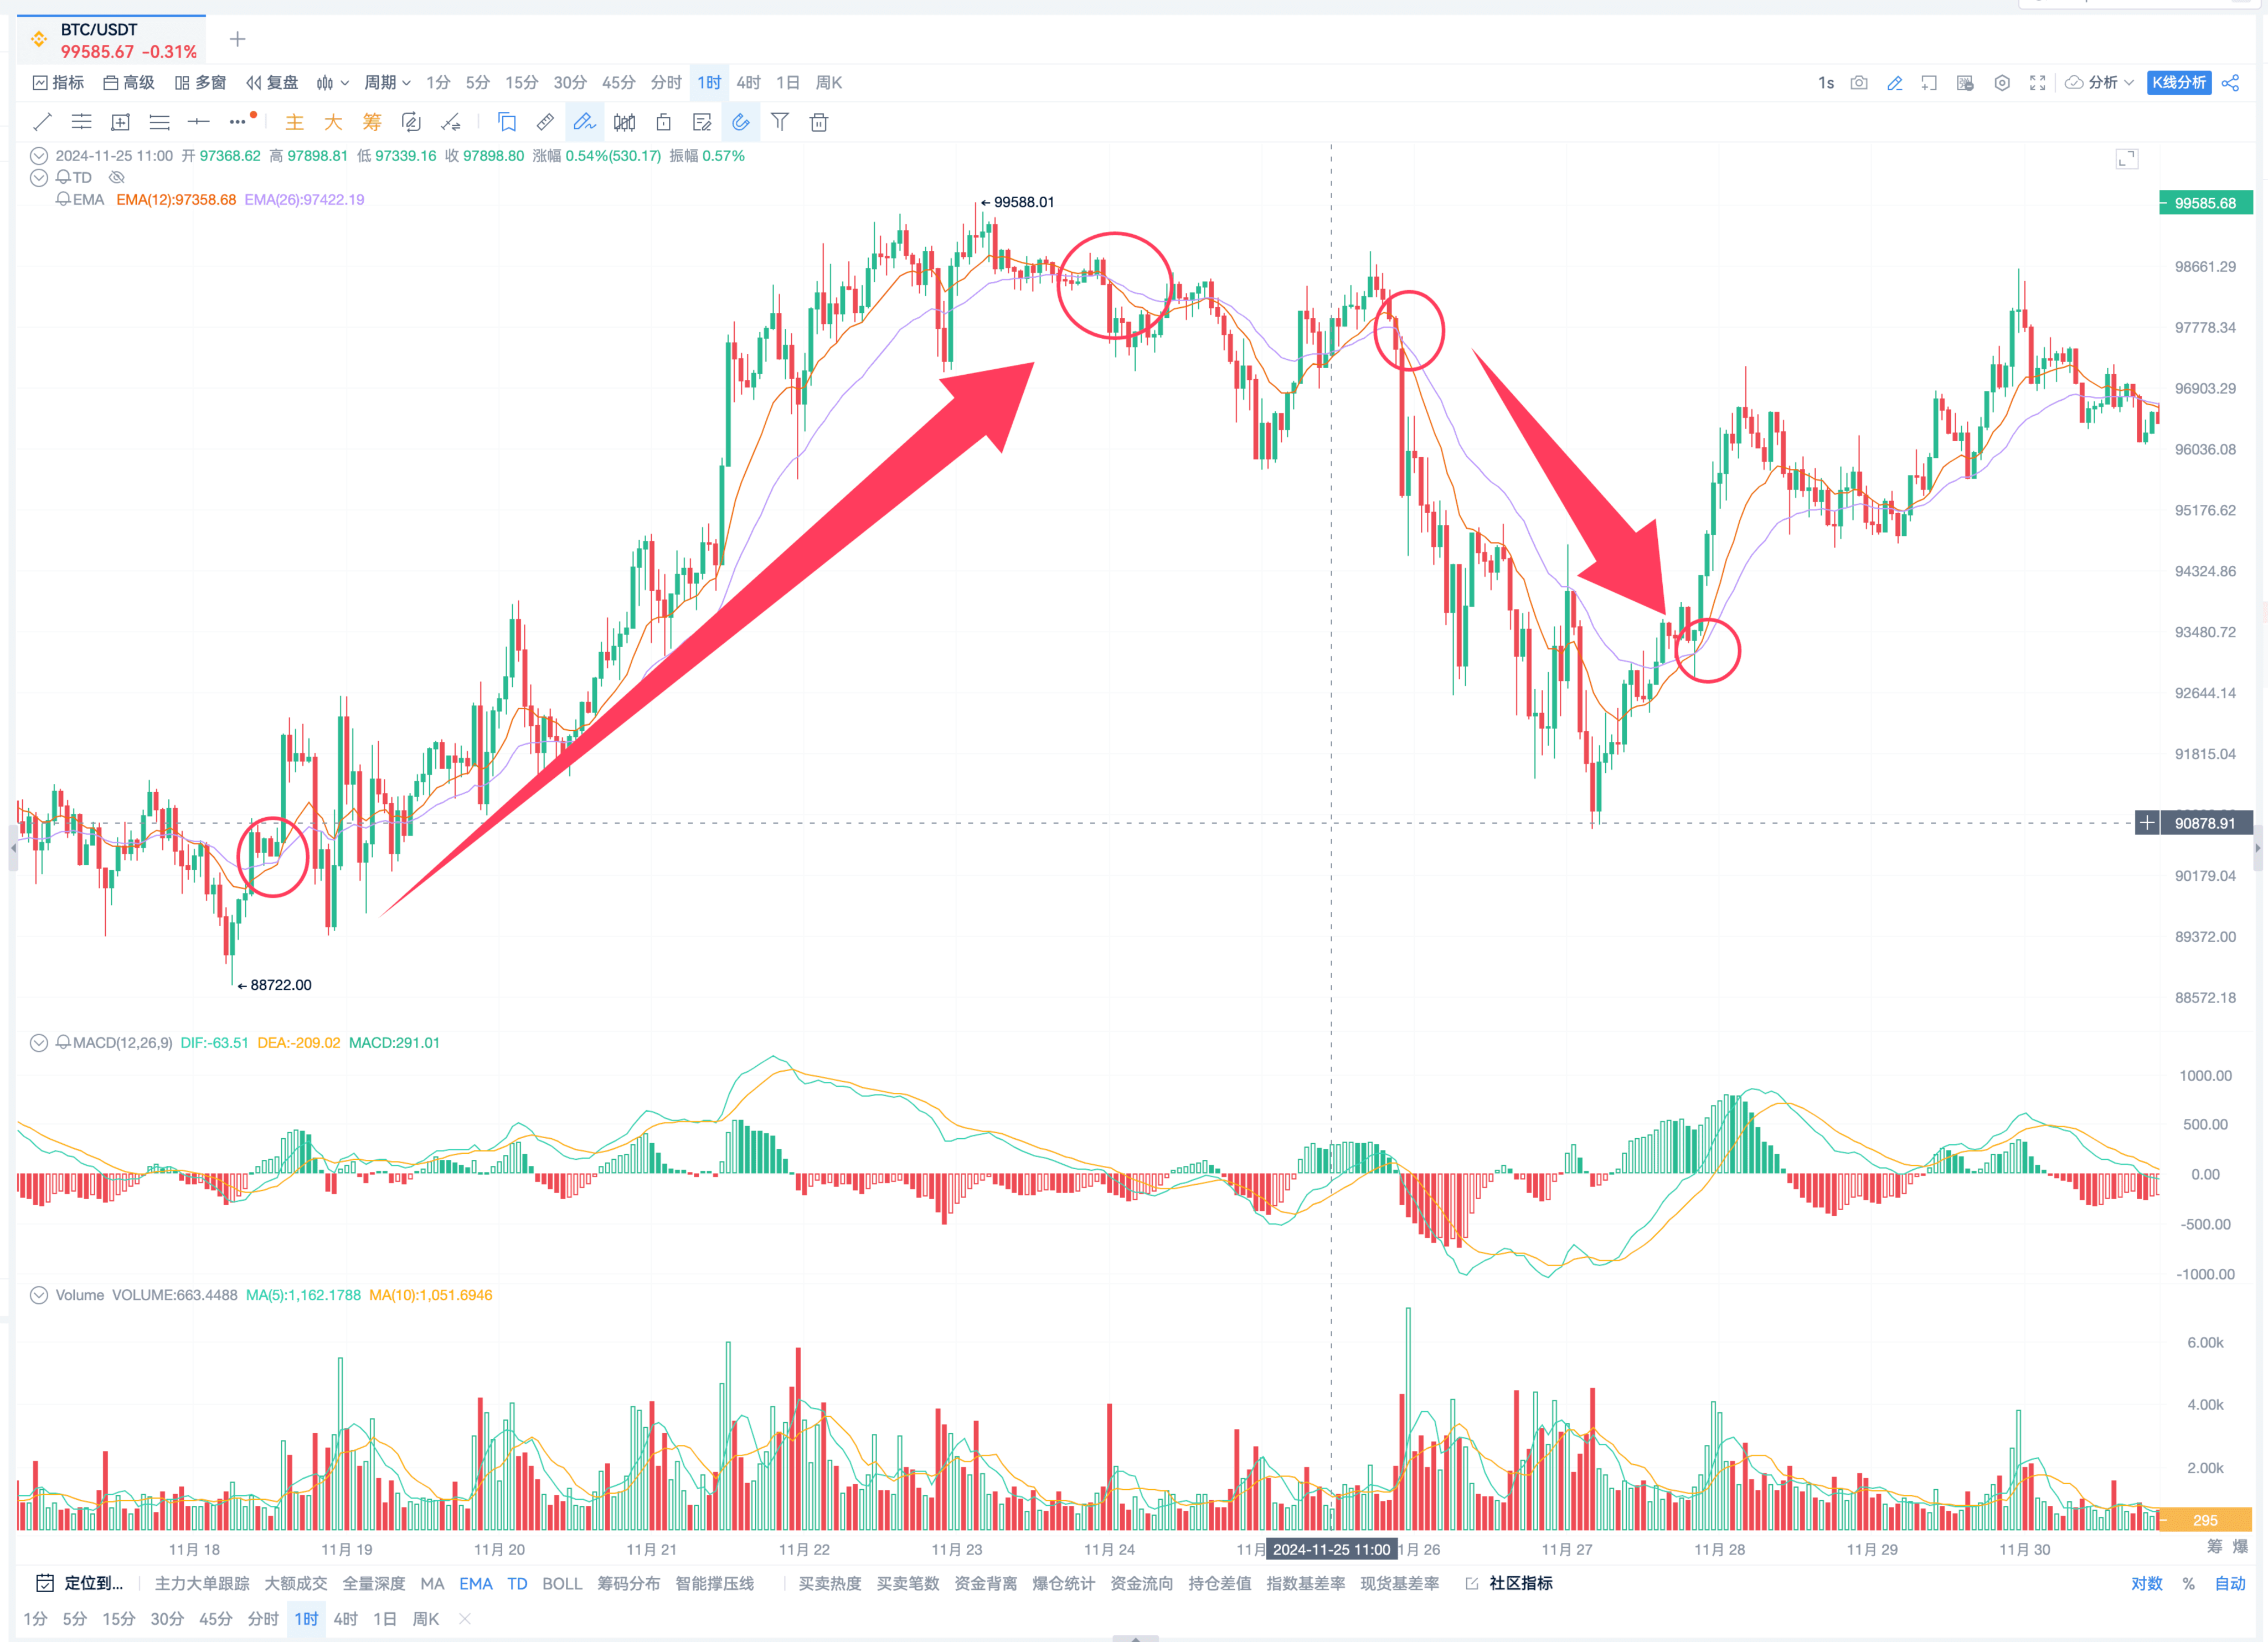
In simple terms, using the EMA indicator, the two parameters: 12 and 26 will form a DIF line.
This can identify medium-term trends.
Both golden crosses and dead crosses can lead to a good trend.
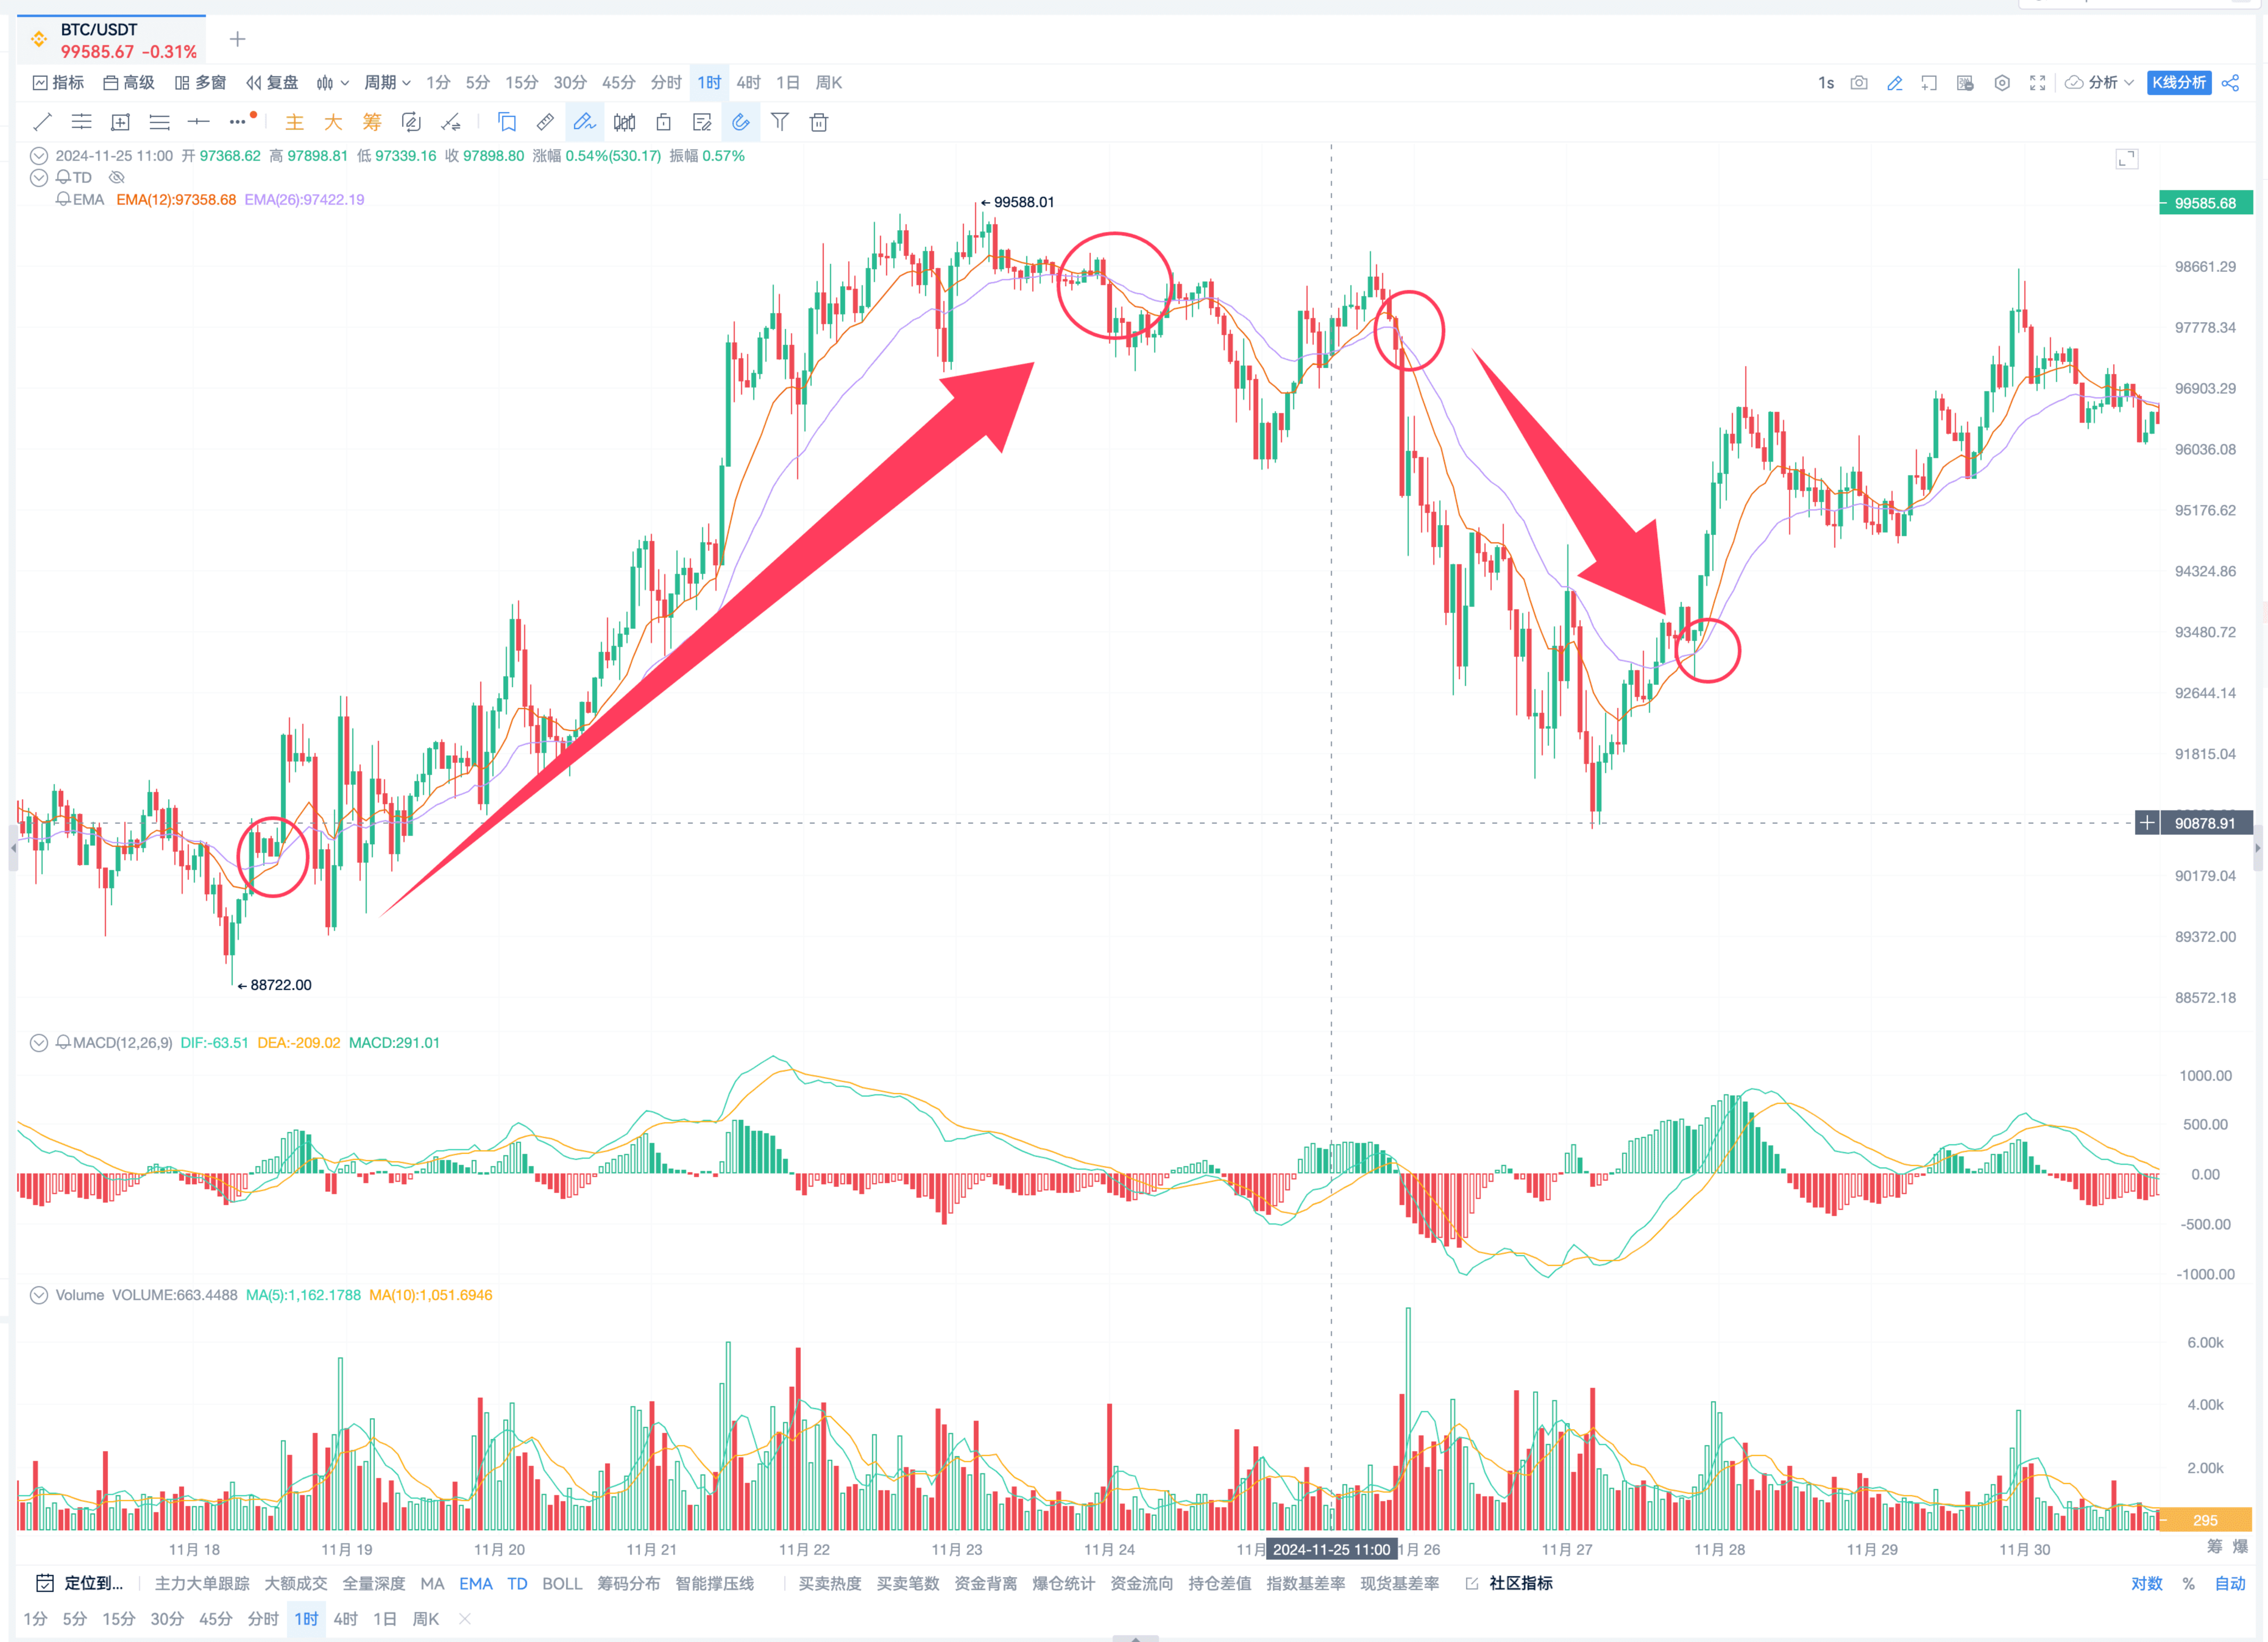
There is also a more convenient way to identify this set of indicator parameters.
The true performance of this set of indicator parameters is actually the DIF line of the MACD indicator.
Let's take a look at the calculation of the MACD indicator.
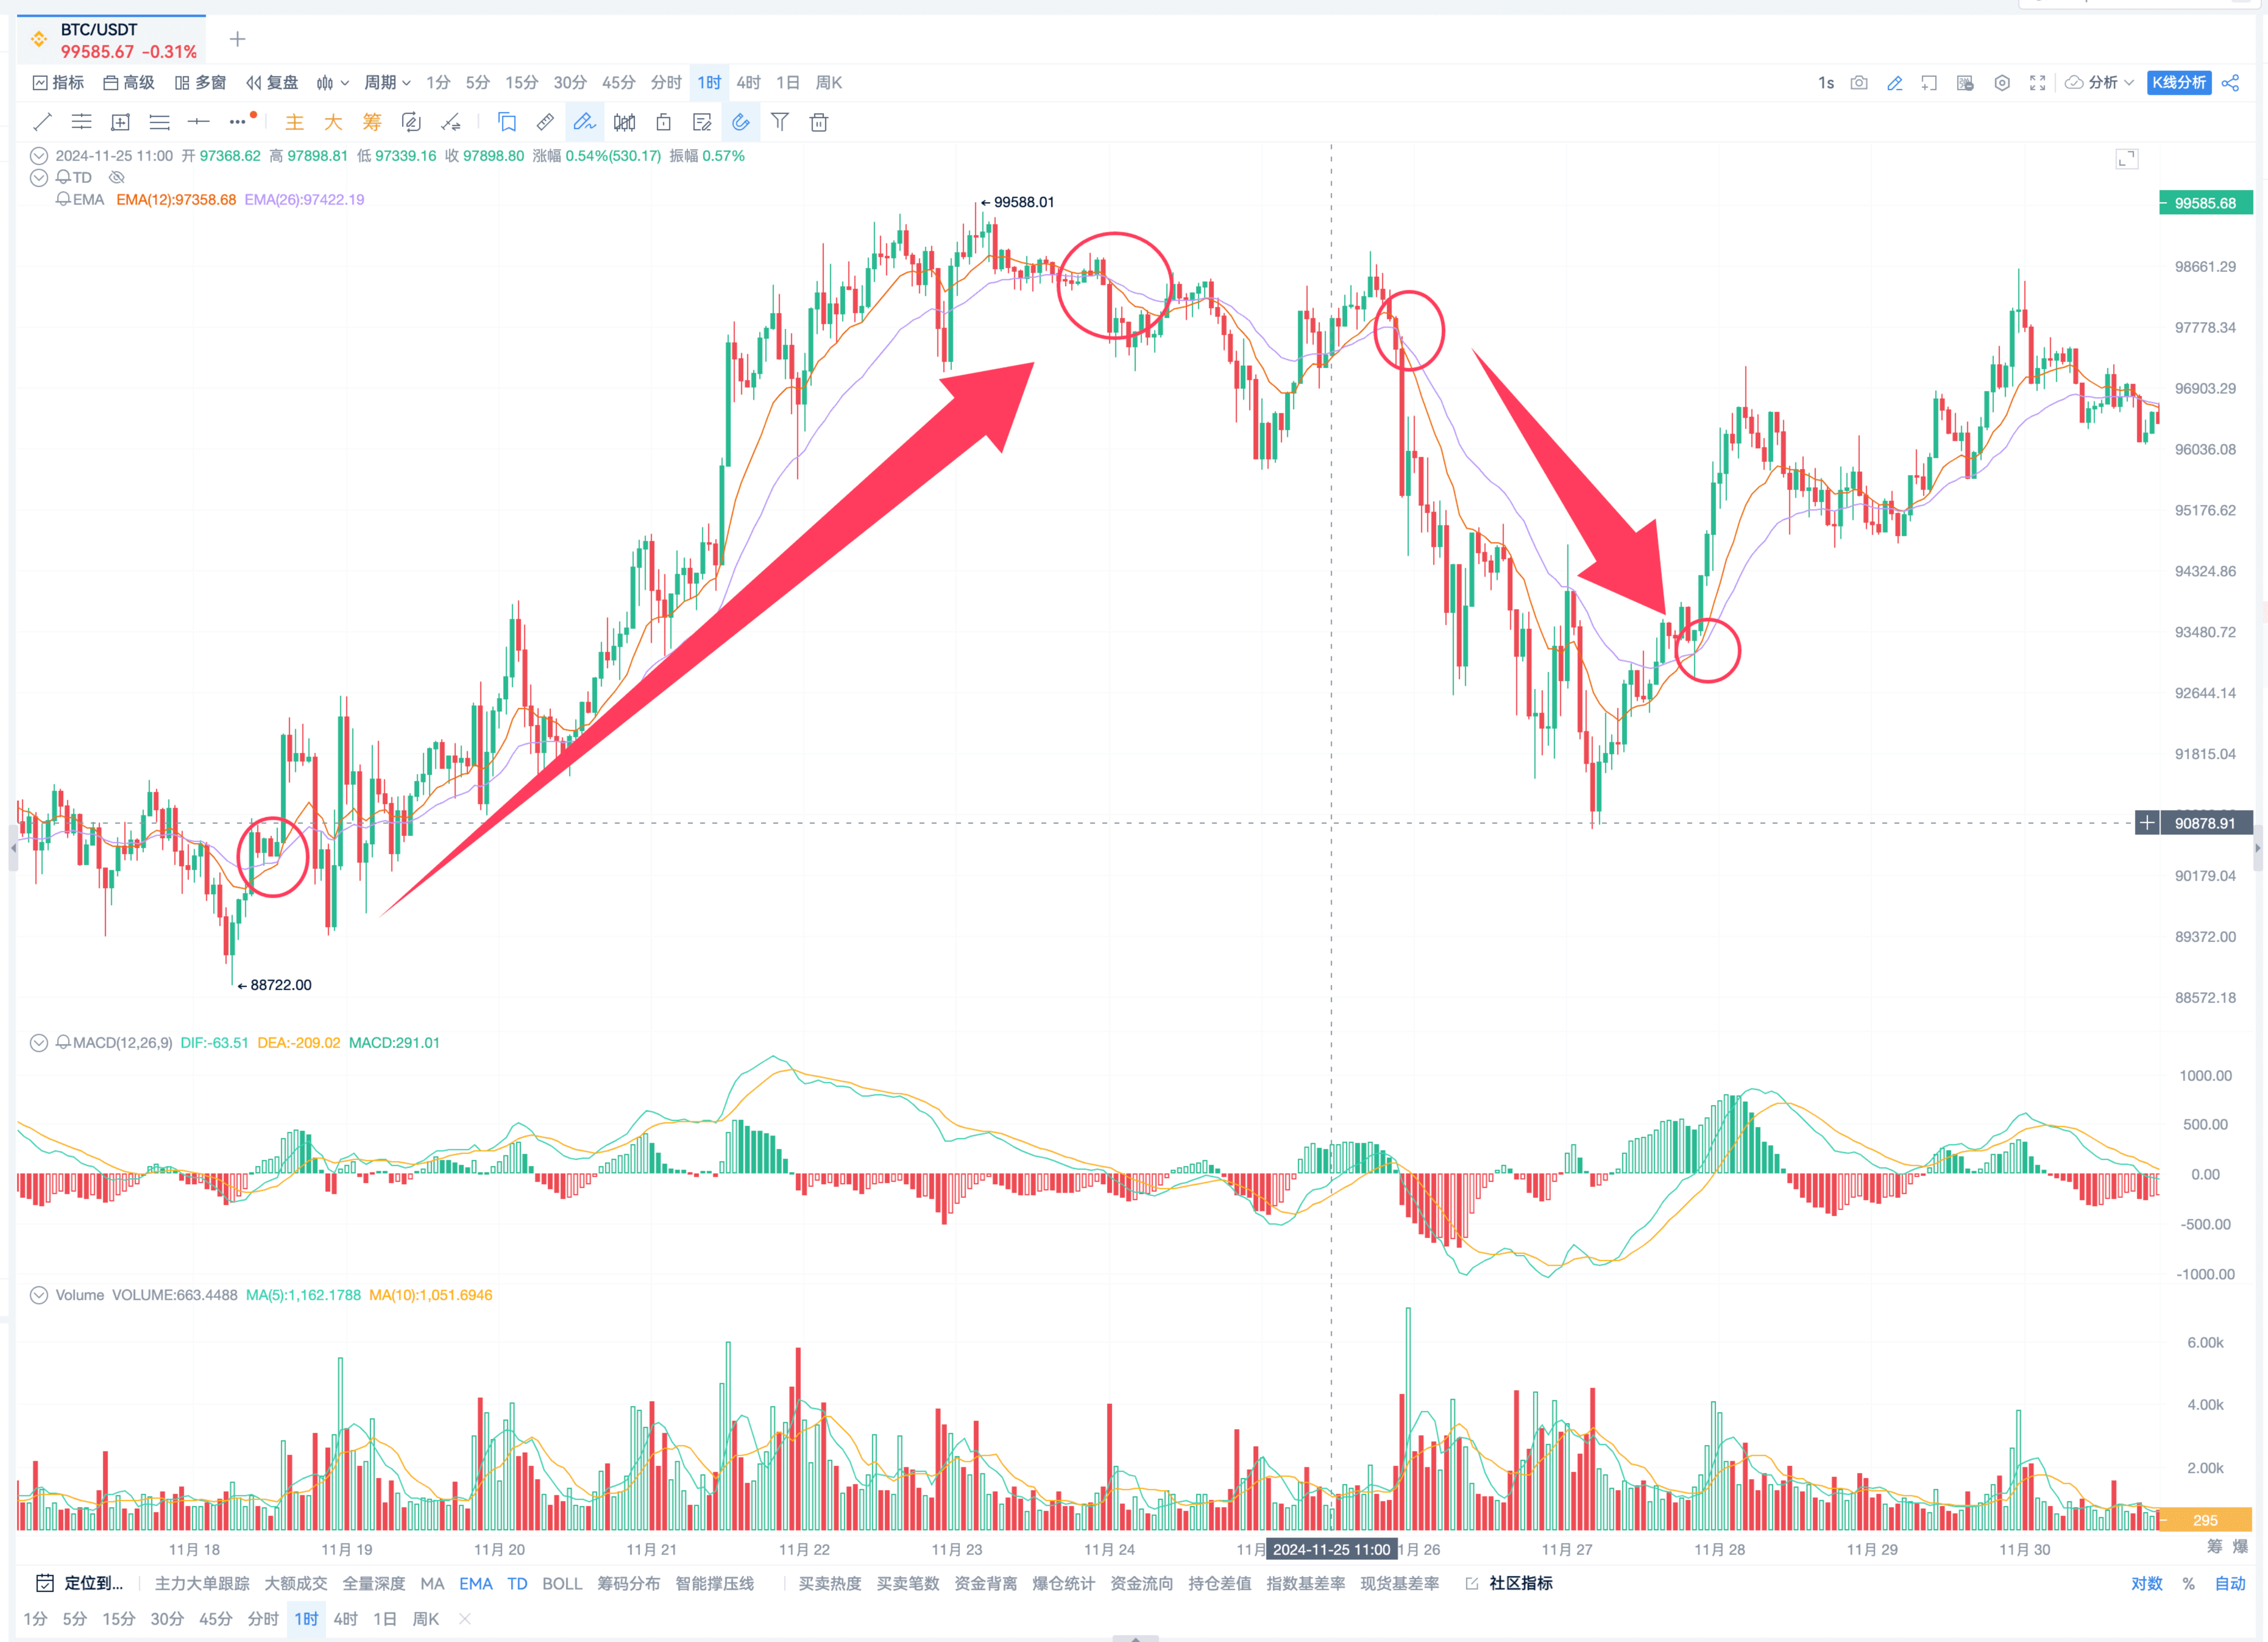
So, if you want to simplify, I also suggest that students can directly use one indicator line, which is the MACD's DIF line.
This is the function of the DIF line.
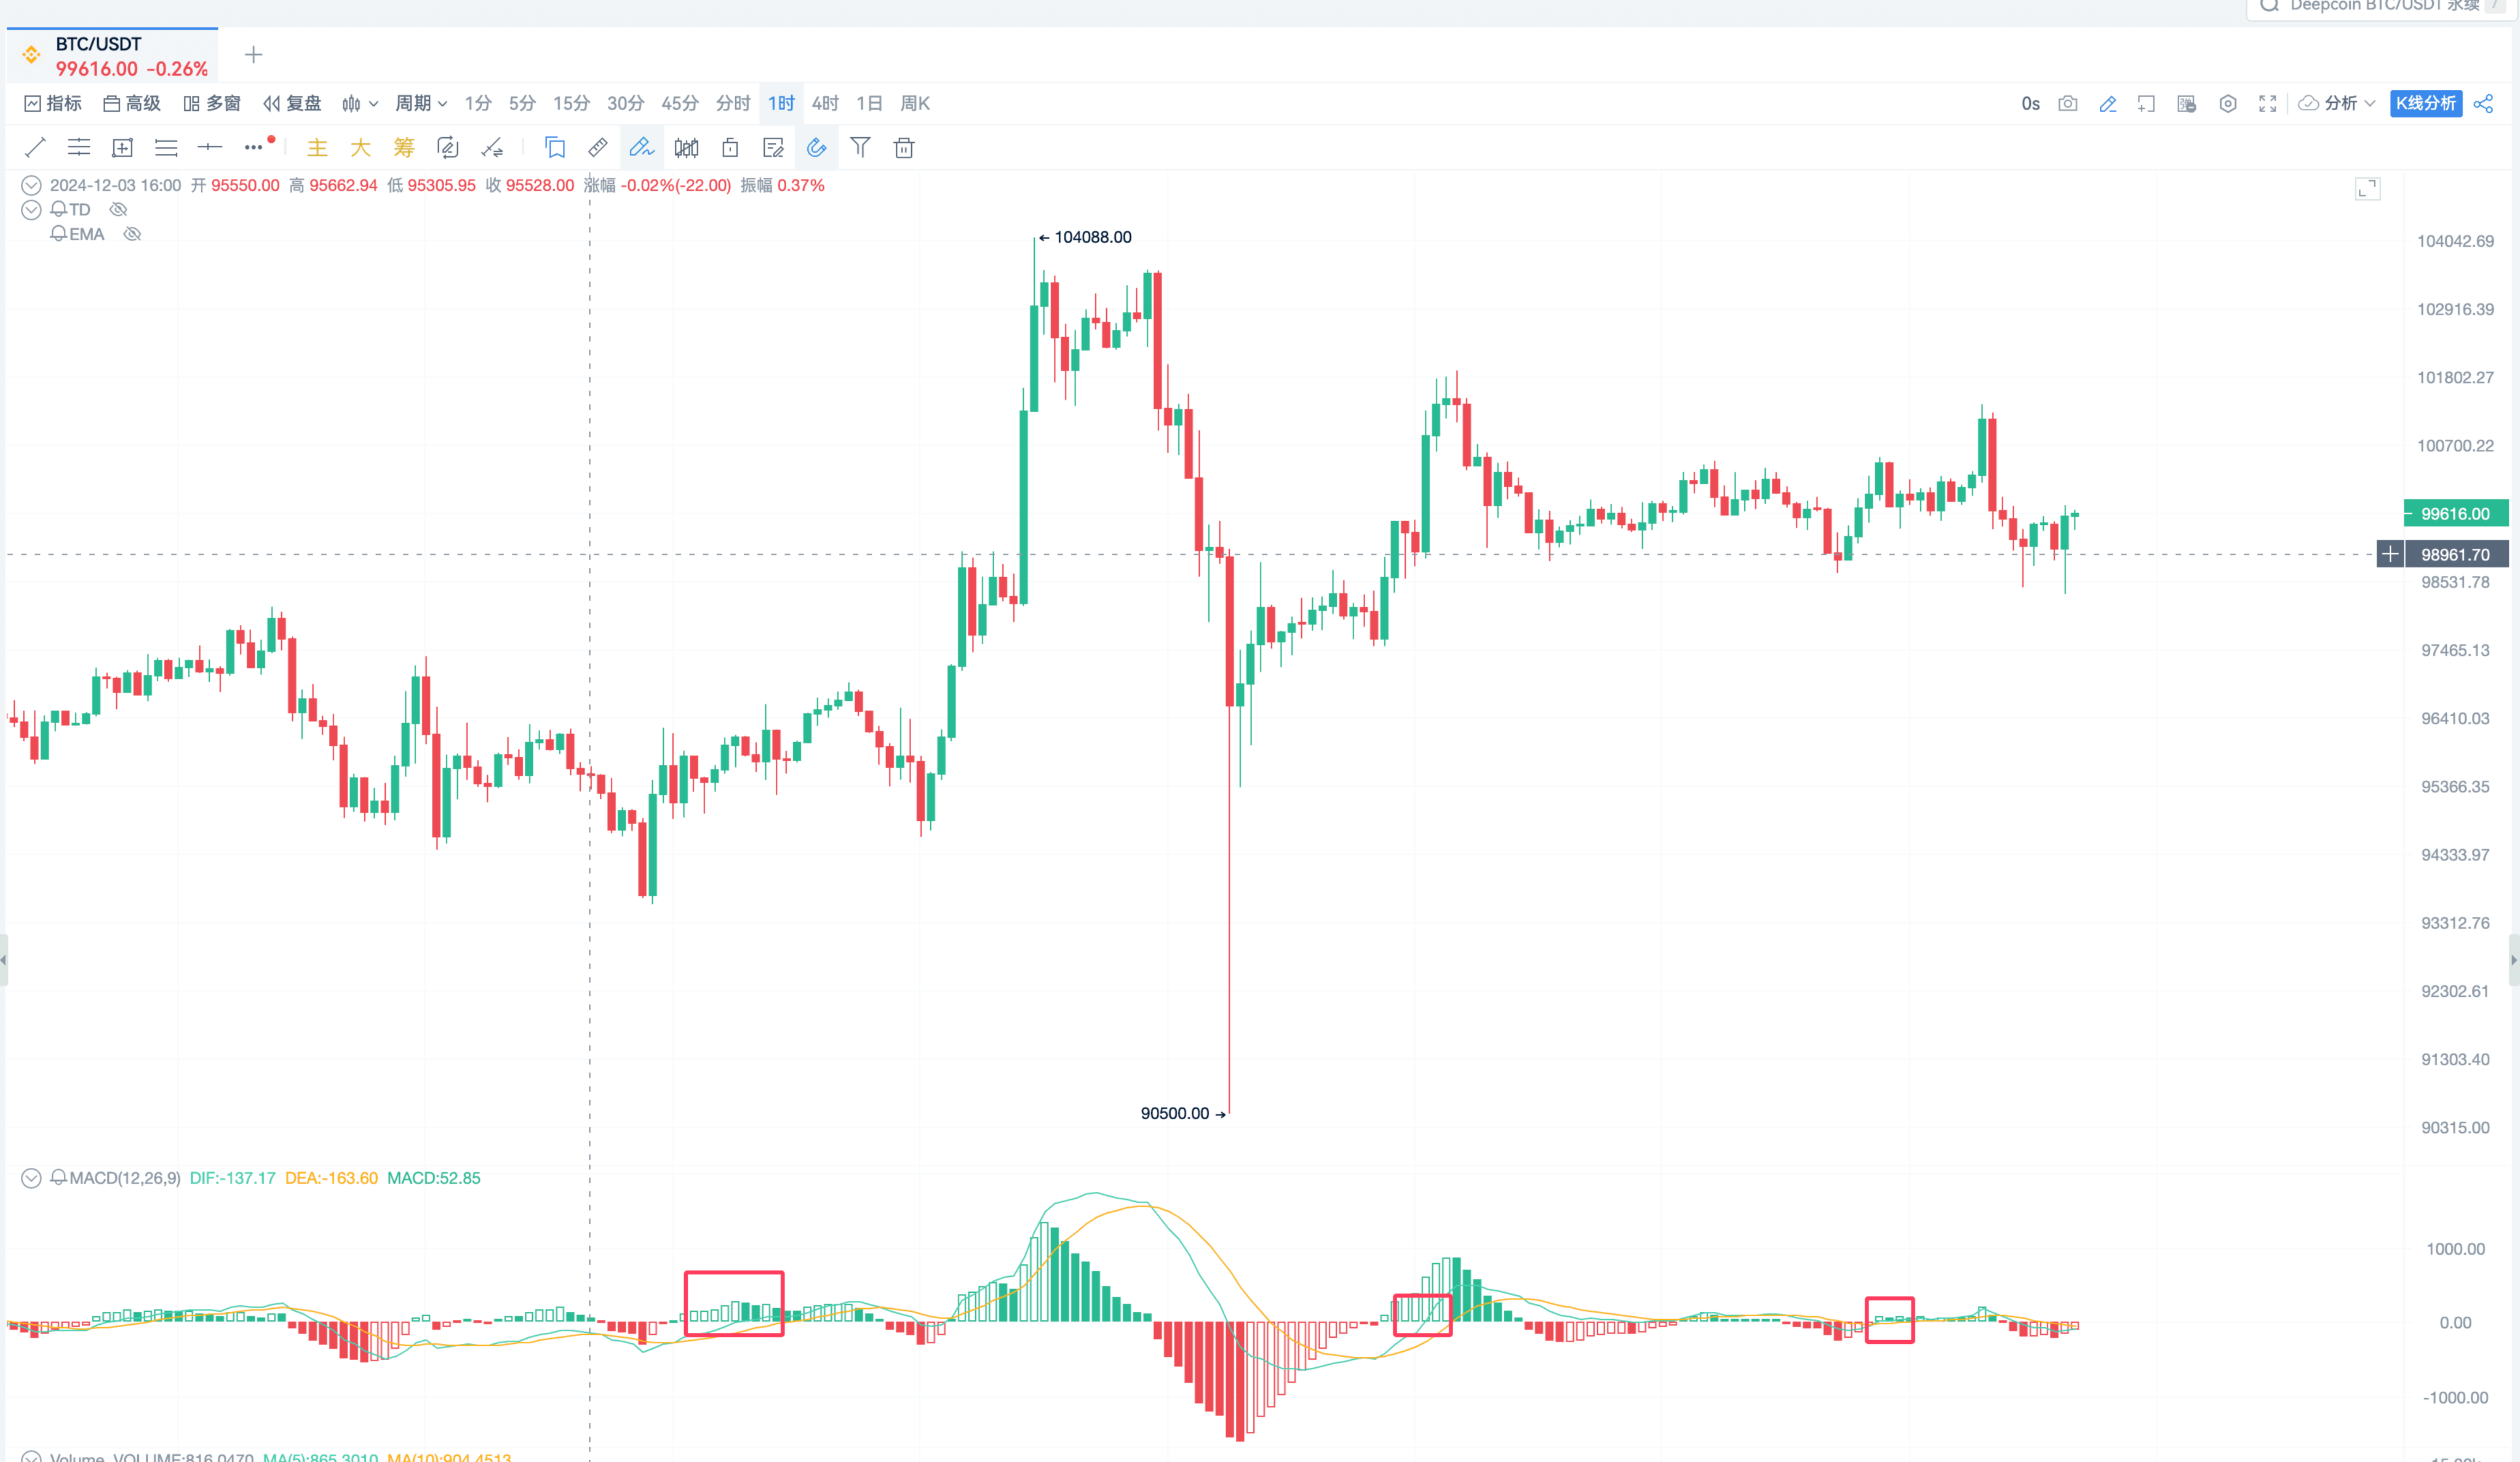
The larger the timeframe, the stronger its trend direction.
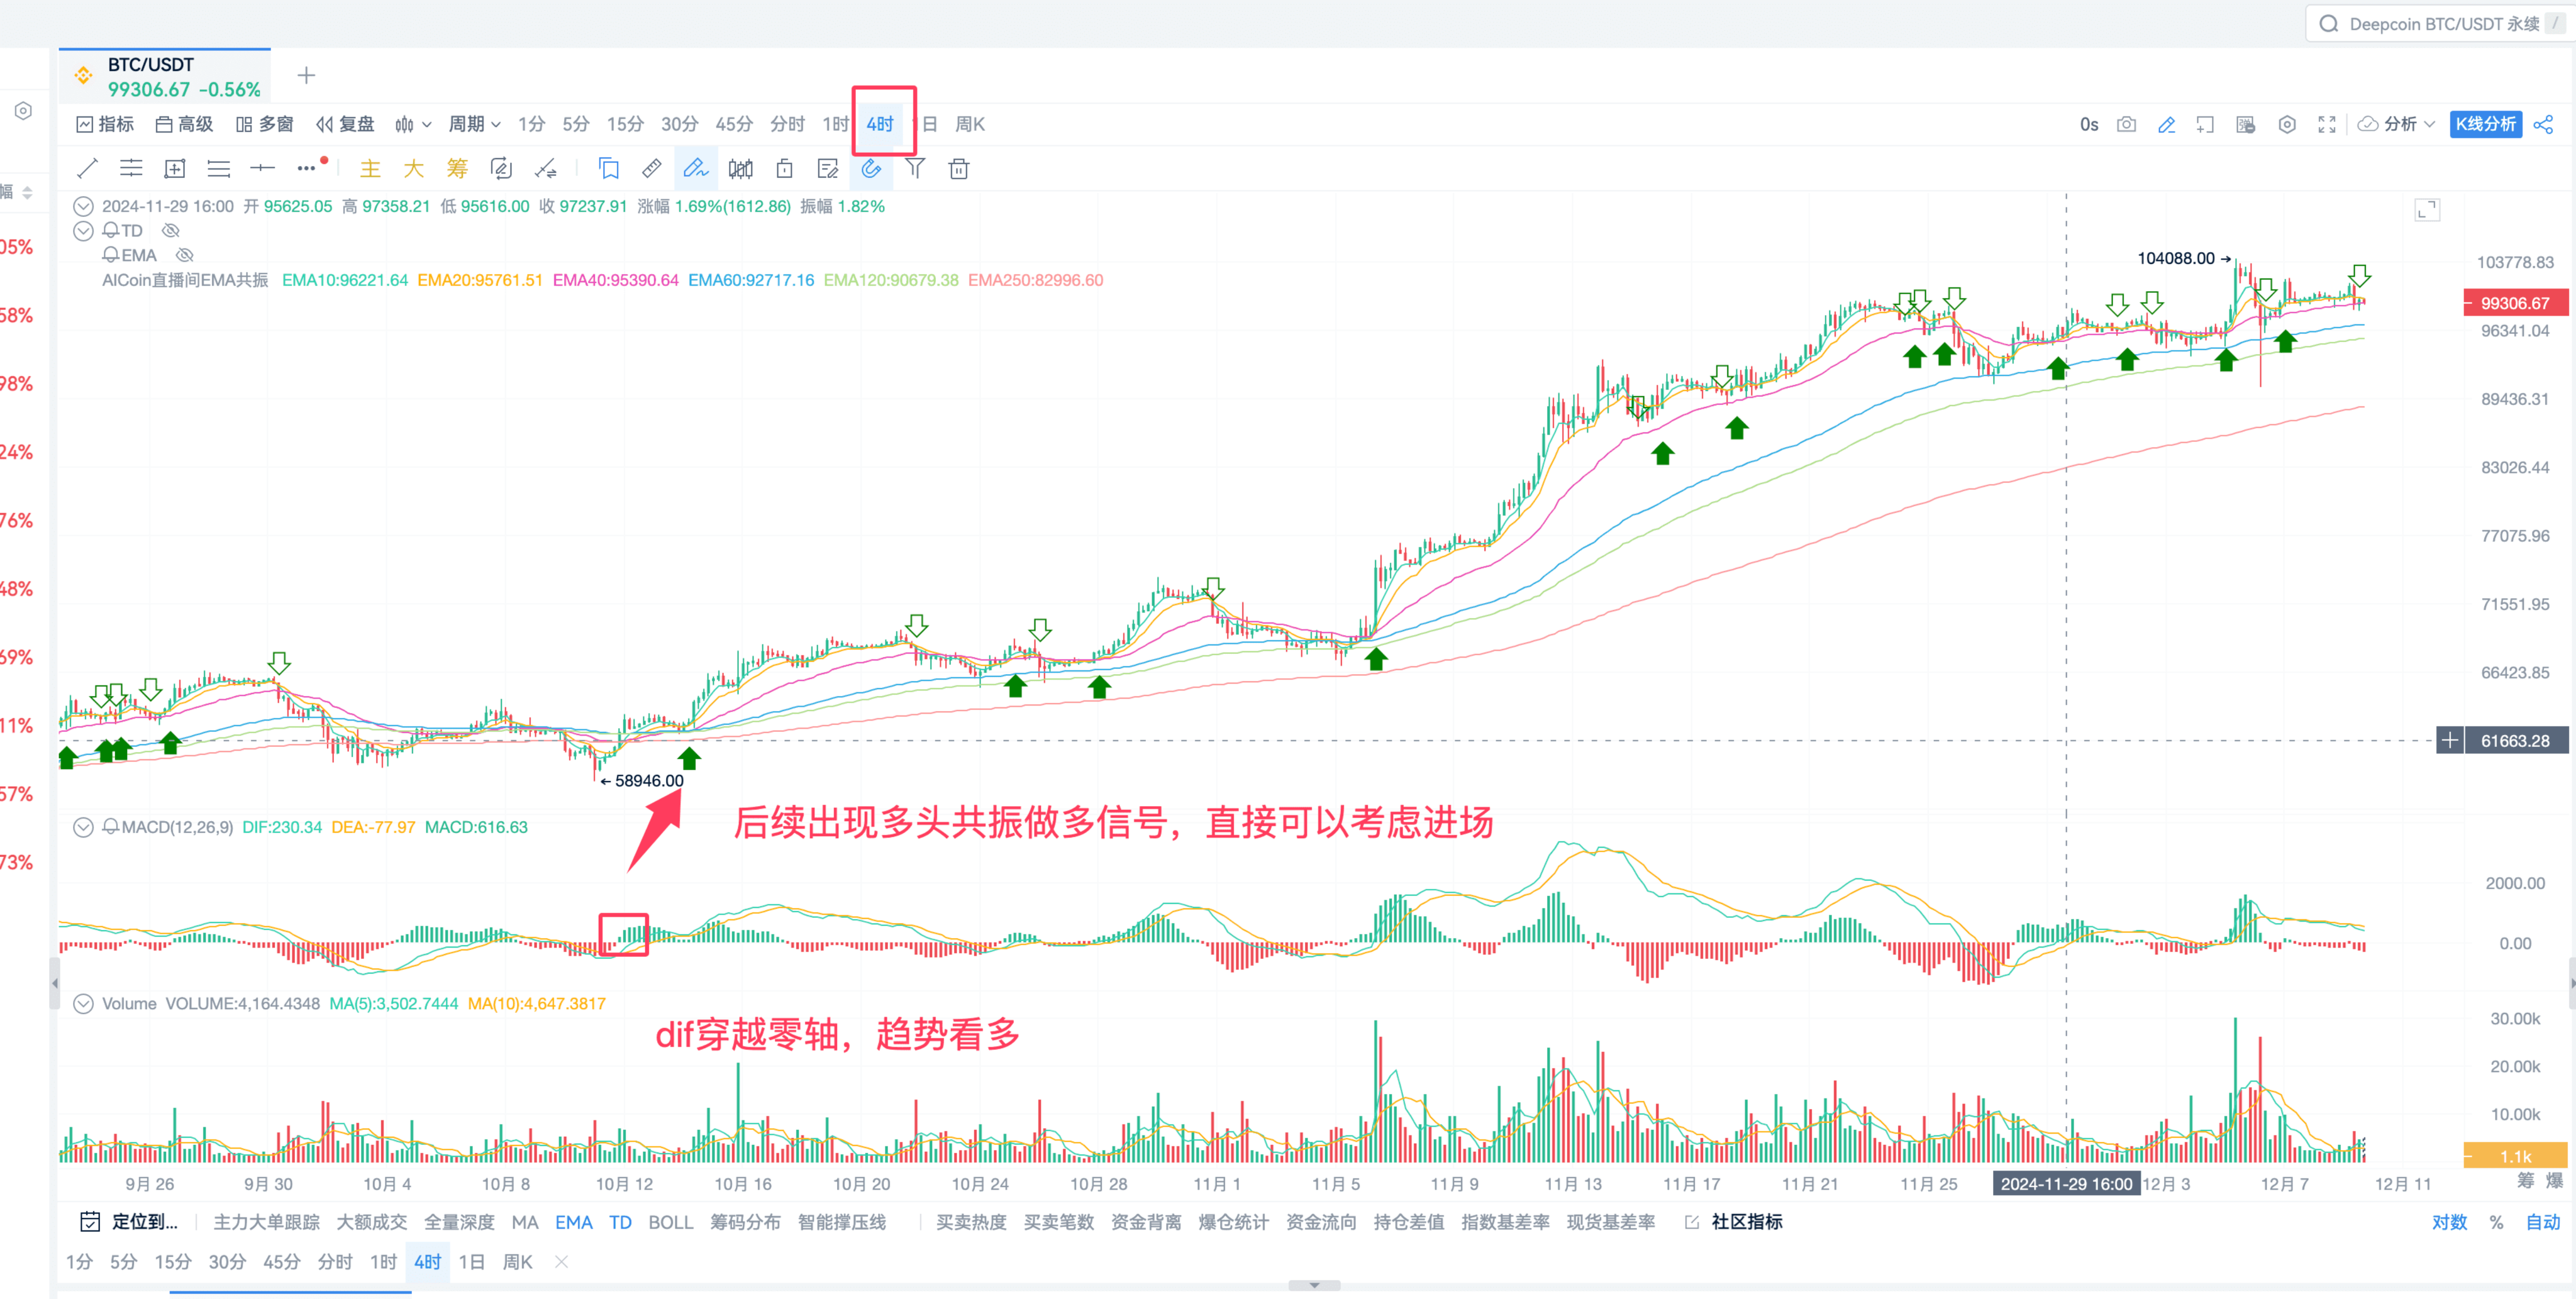
For example, we can choose a 4-hour timeframe to use the DIF line for trend direction identification.
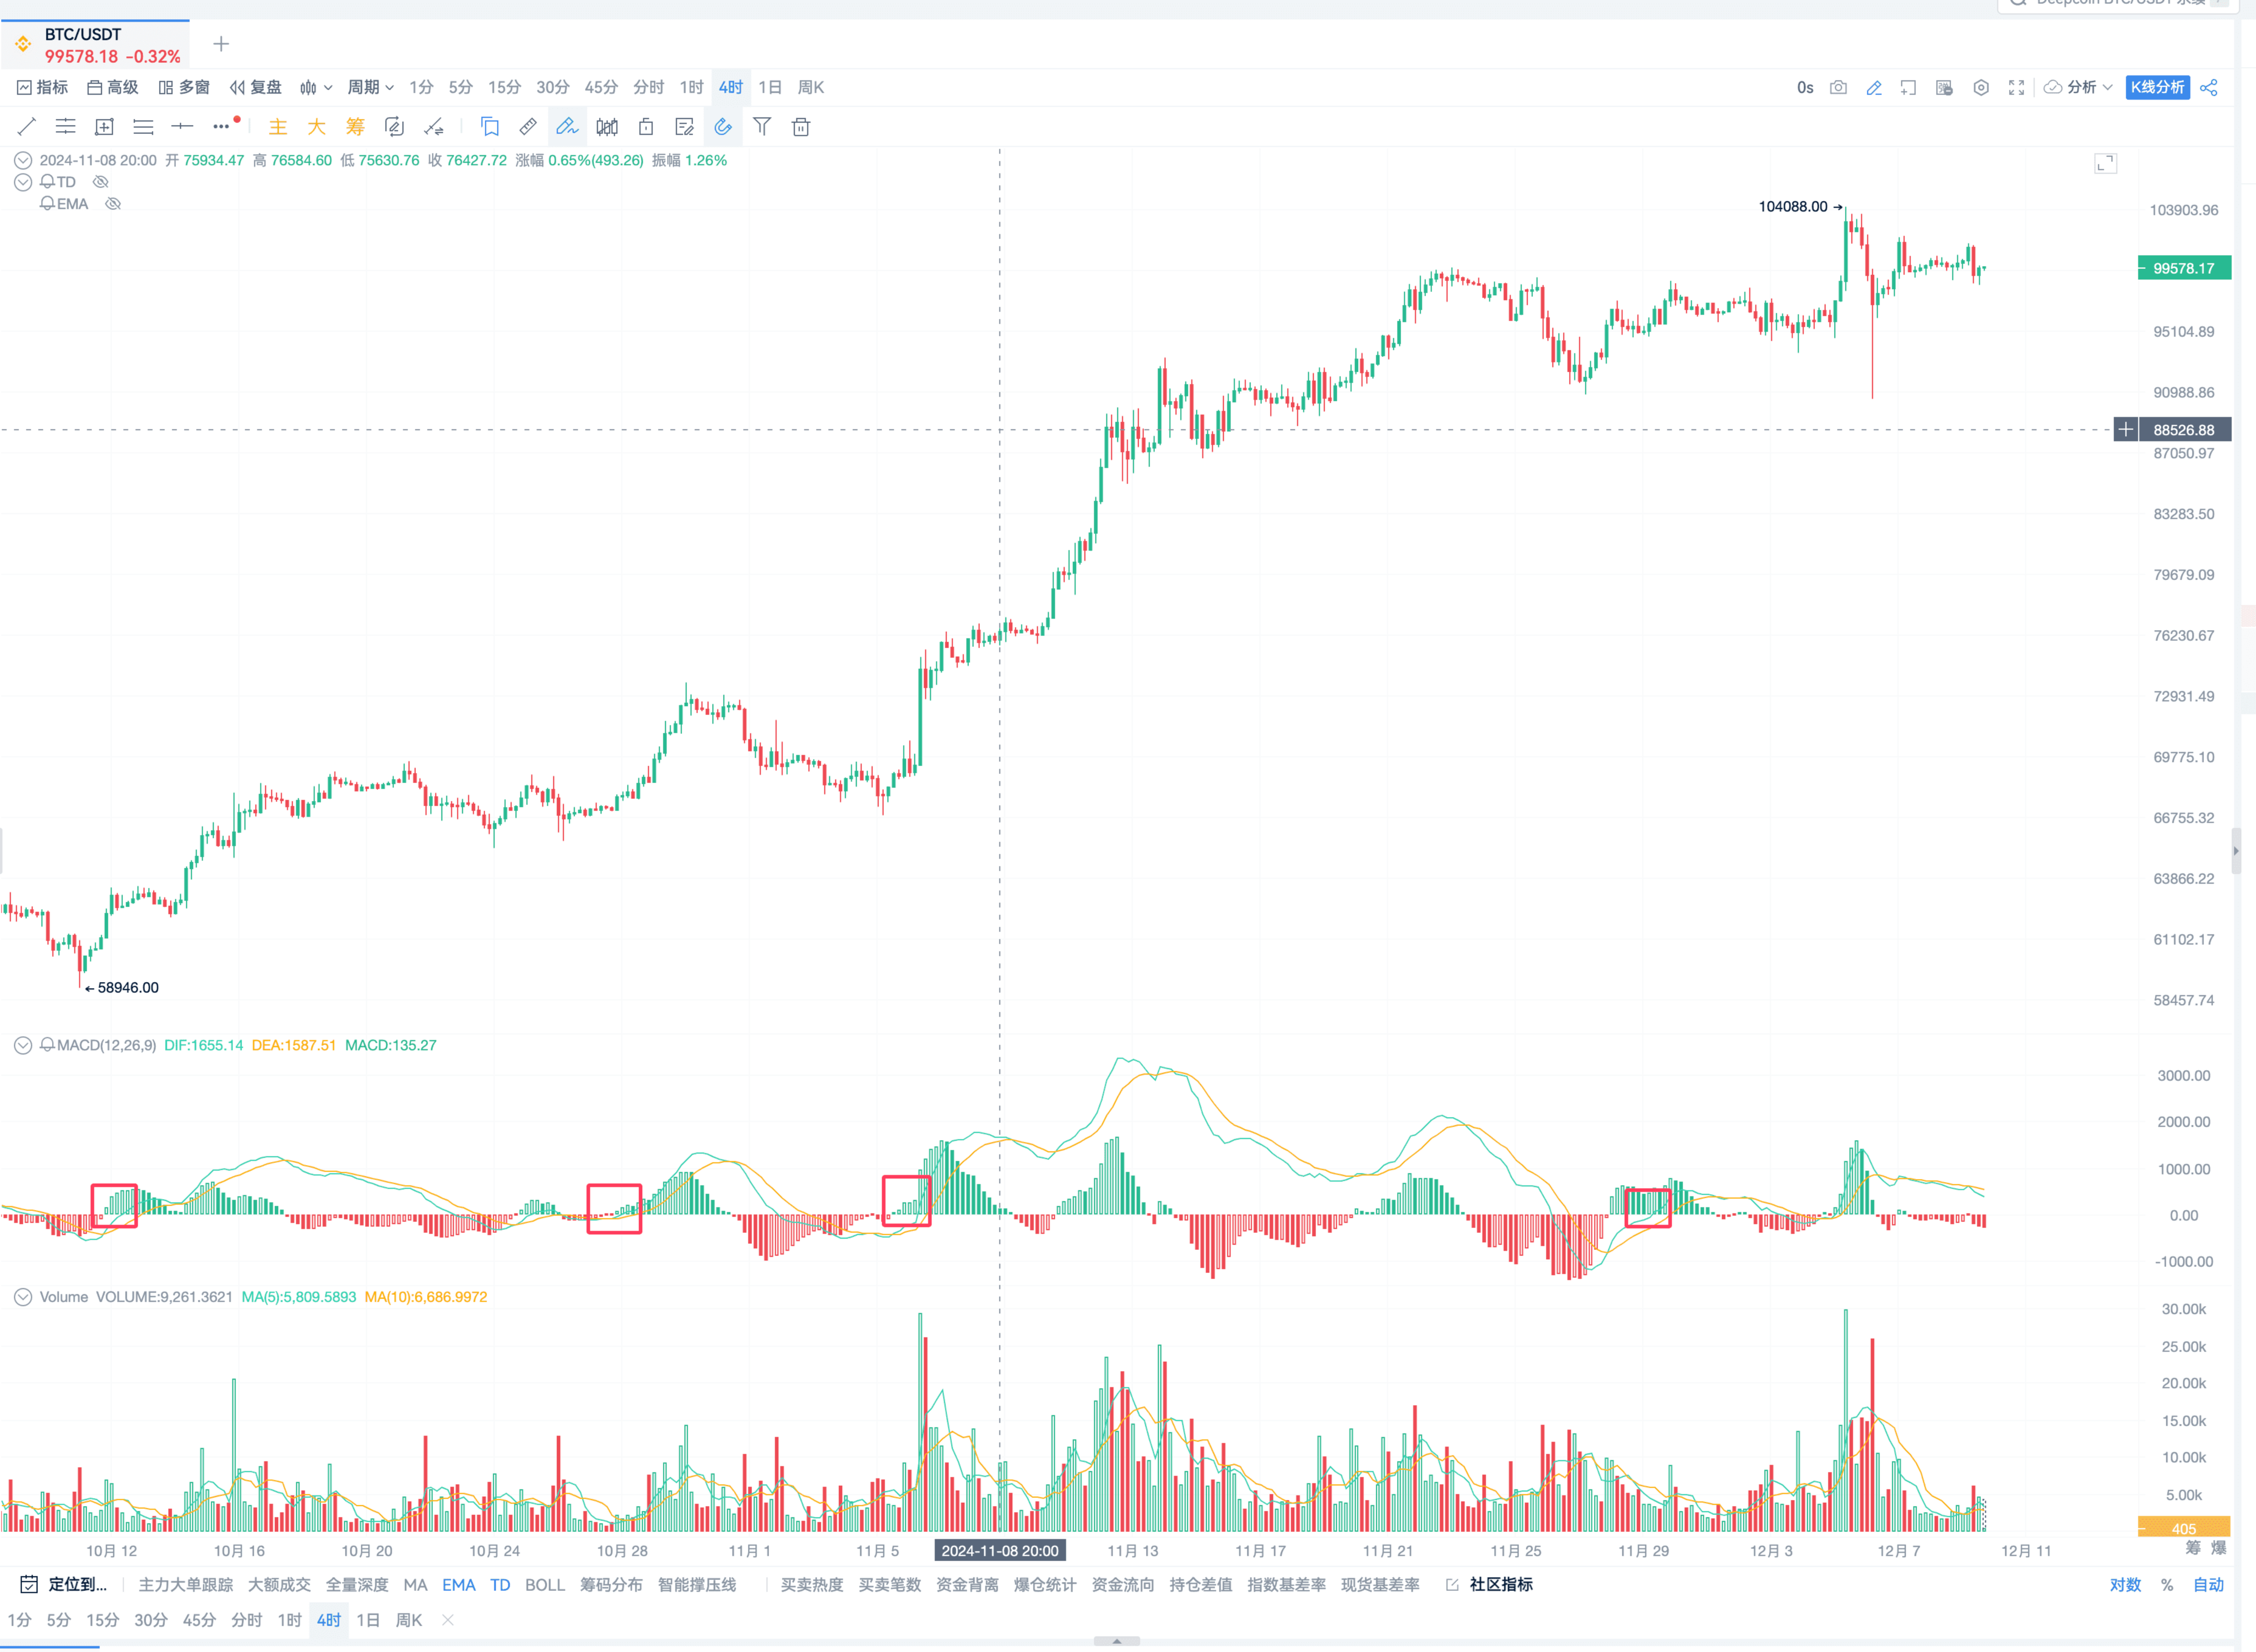
Using it for trend identification is possible.
For example, when it breaks below the zero line, shouldn't we take appropriate profits and be cautious about going long?
When it breaks above the zero line, then when we encounter a long signal, combined with other indicators and large order data, won't that make us bolder and more confident to go long?
That is definitely possible because you have a solid indicator foundation. When you see it crossing the zero line, the trend appears bullish.
Every trend will not end immediately; within this trend, there are mostly entry opportunities.
It is recommended to use the DIF line as a trend direction indicator; its underlying logic is constructed using EMA12 and EMA26.
In principle, it can be understood as part of the EMA indicator.
Let me share with you that the EMA indicator is not lagging. What everyone refers to as lagging is hindsight lagging.
The EMA indicator is originally designed to balance sensitivity.
Why do I say this? Because the EMA indicator uses a weighted average algorithm, giving more weight to recent prices. Therefore, recent price fluctuations will immediately be reflected in the EMA indicator.
Then, because it uses a weighted average over a period, it will also reflect the recent price level.
In fact, the EMA indicator is one that I highly recommend students in the live room to study.
It is not lagging; what people generally refer to as lagging is usually discussing the pin bar extreme value pattern, which are prices that are hard to come by. When encountering these prices, it is best to use the main force large orders, which is what the PRO member tools can help identify.
As a technical analysis tool, the most profound and stable is still using the EMA indicator.
This is the first recommendation. In summary: 4-hour timeframe to determine trends + DIF line crossing upwards indicates bullish, crossing downwards indicates bearish.
Finding EMA Signals
- Resonance Signals
This is a very robust method.
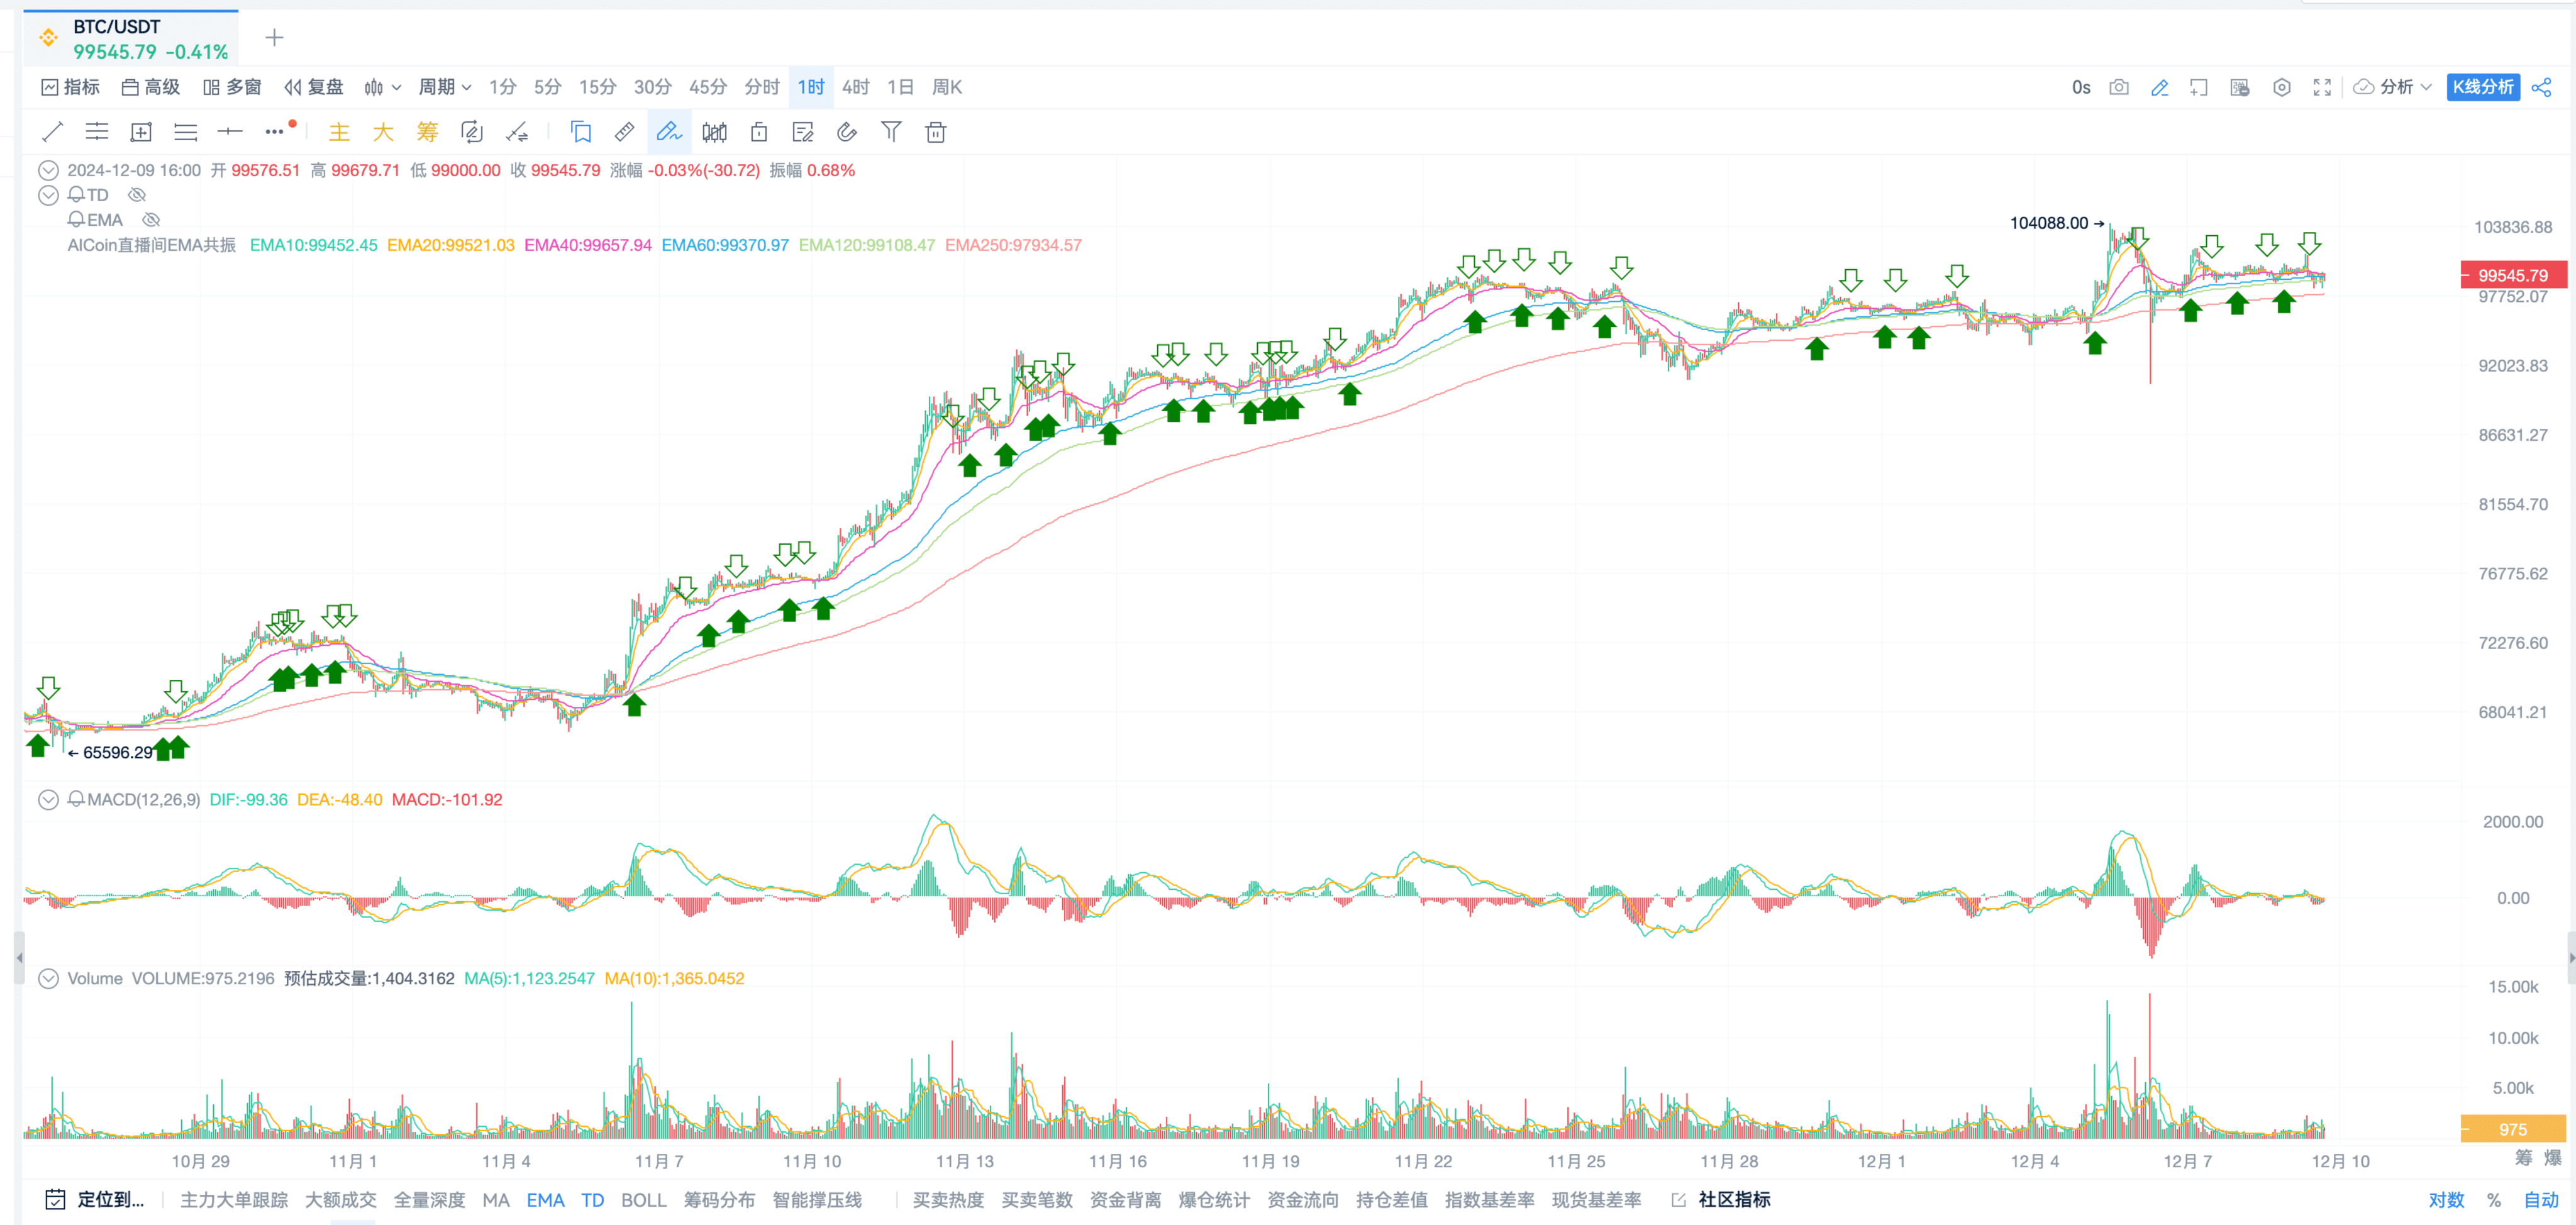
The host's EMA resonance algorithm: Many signals, accurate entries, quick exits.
The solid green arrow indicates the start of bullish resonance, while the hollow arrow indicates the end of bullish resonance.
If the trend is bullish, combined with the signals here, you can directly run into the market.
Pulling into a downtrend will also yield short signals.
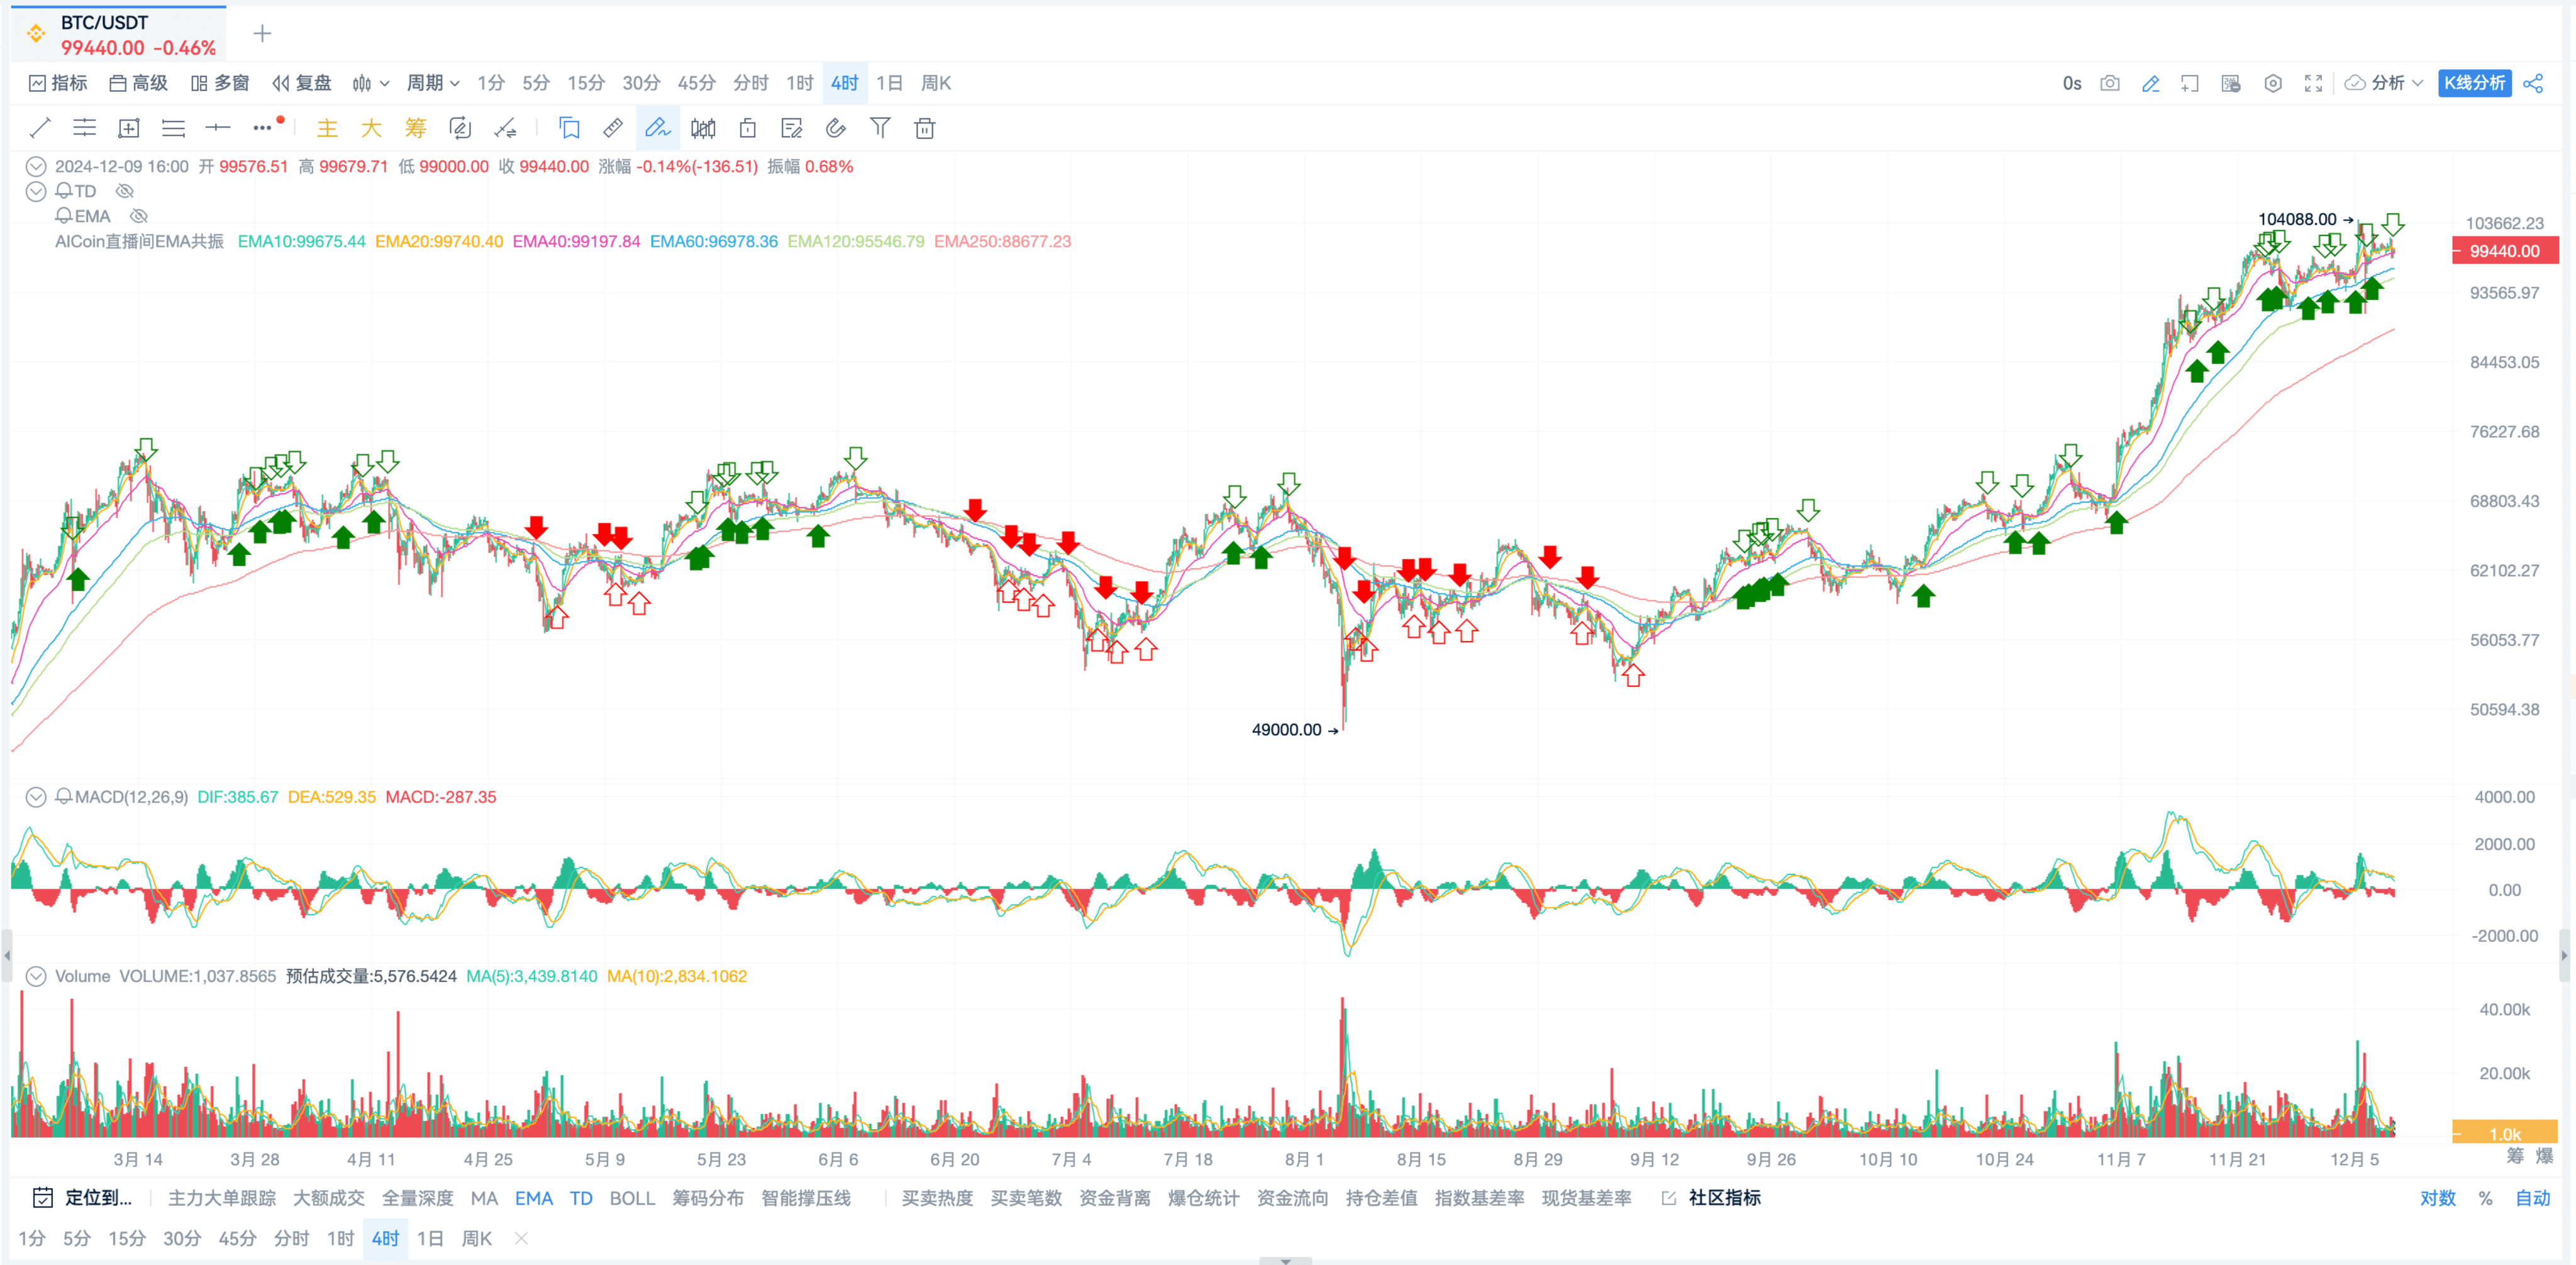
The host's suggestion is: After confirming the trend with the DIF line, you can try this set of indicators.
This set of indicators can be modified by the students themselves for resonance parameters.
Currently, the host's resonance parameters consist of 6 EMAs.
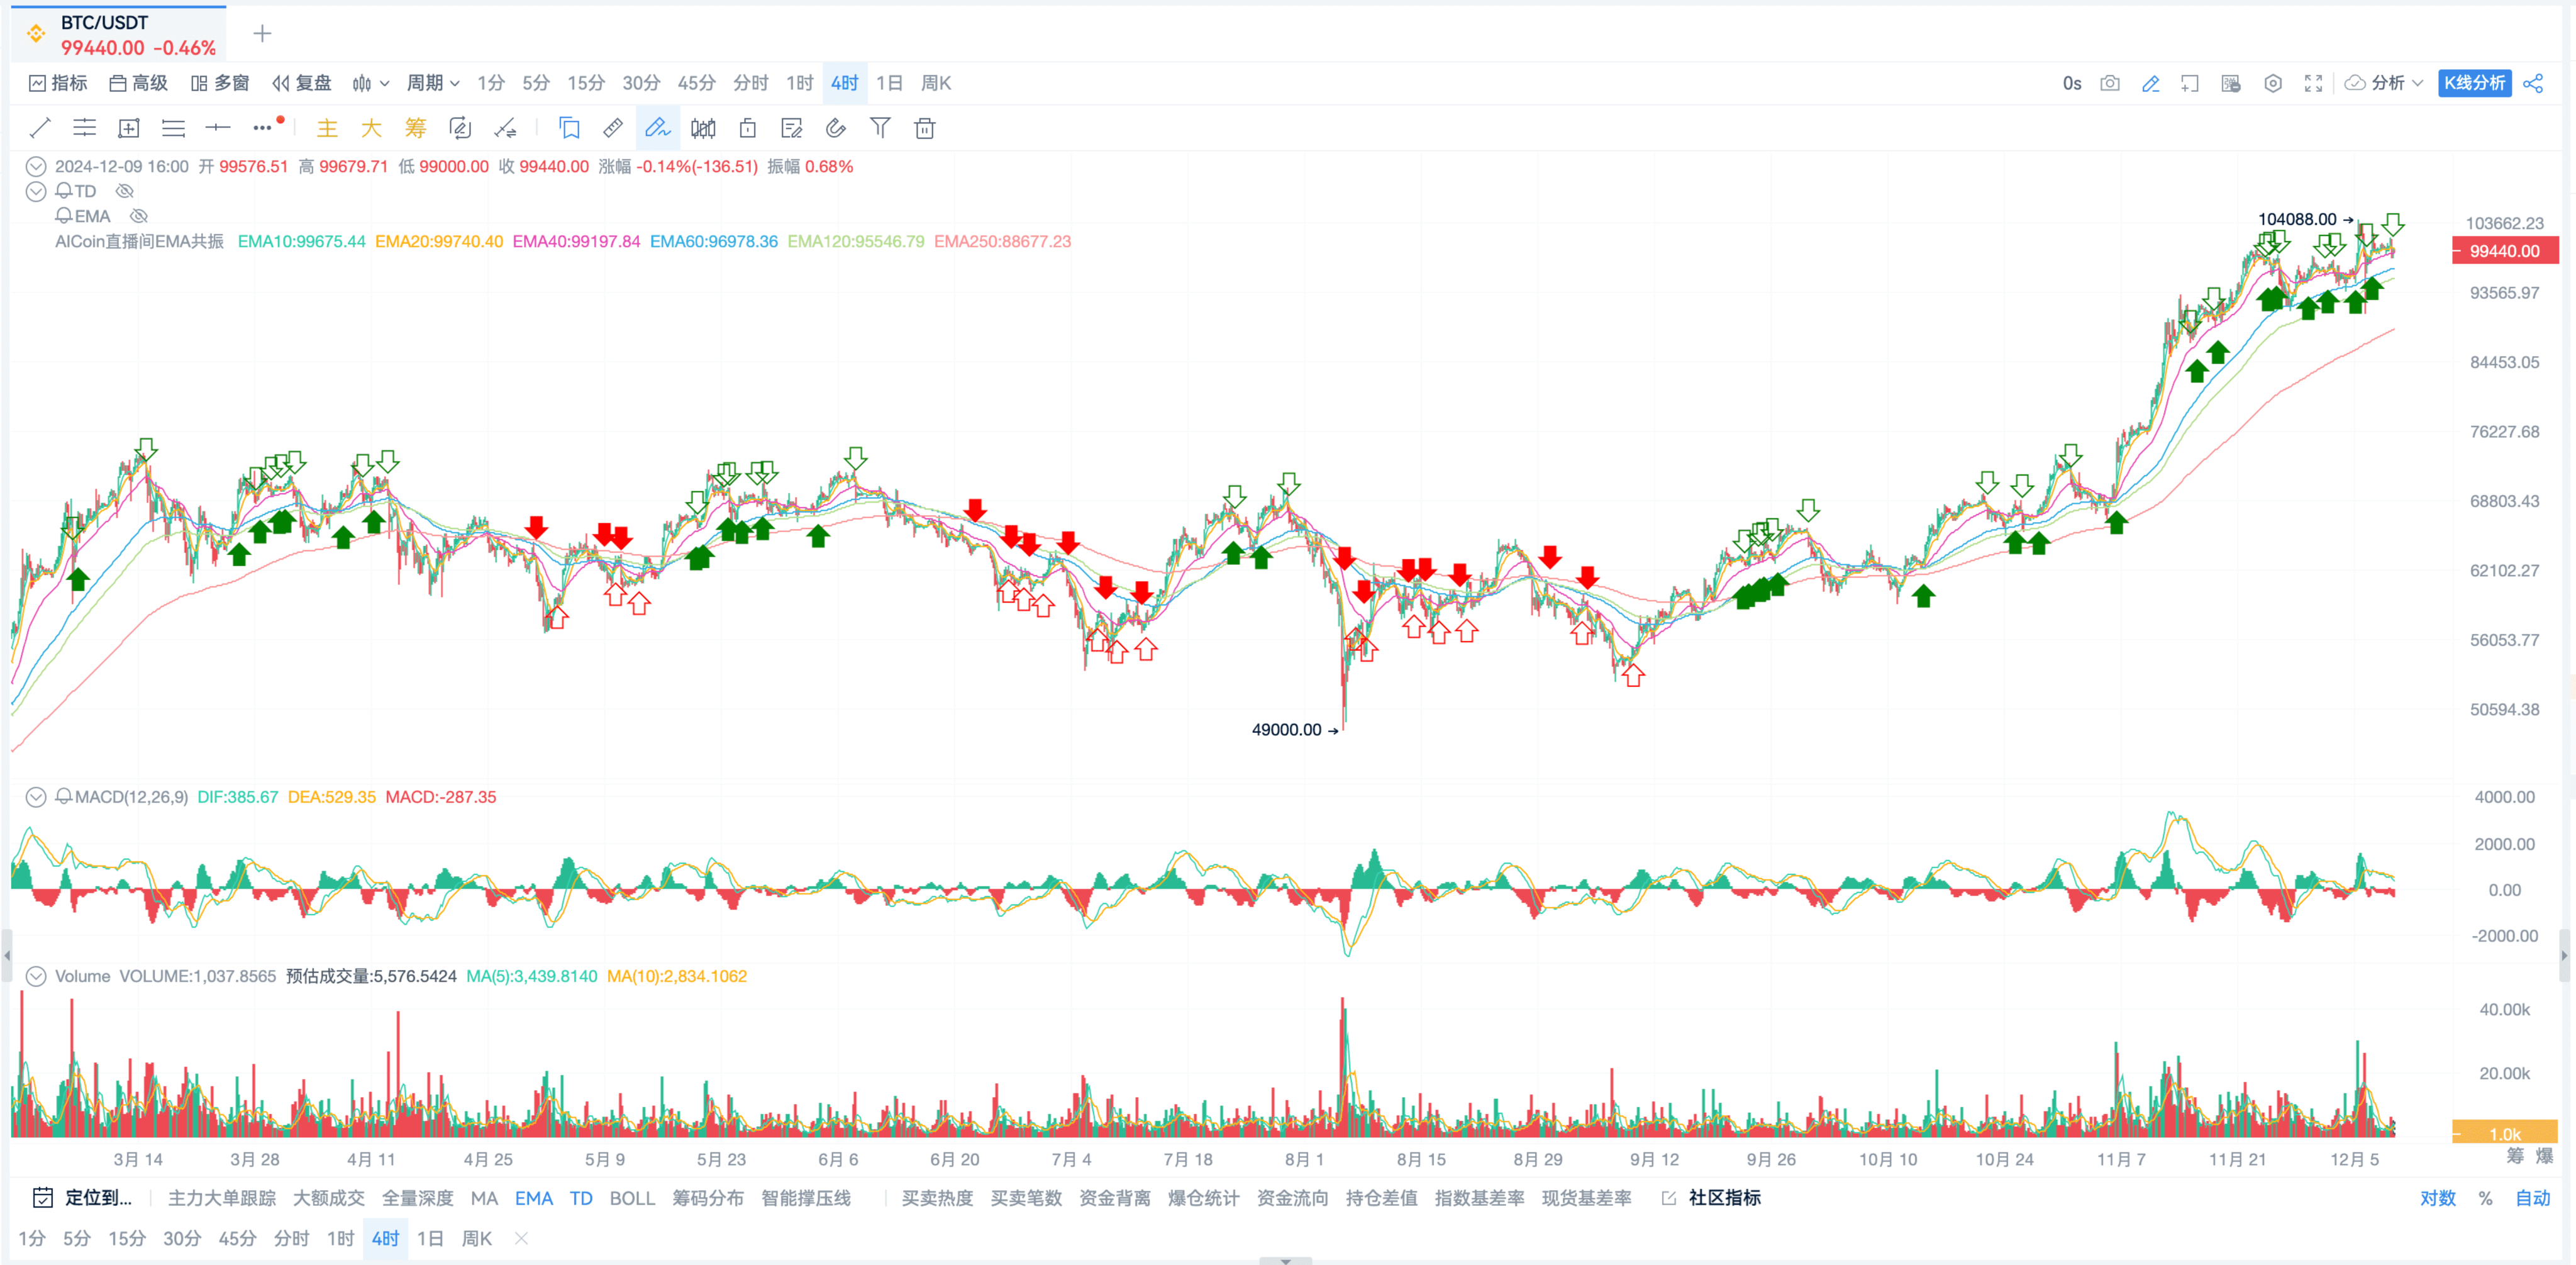
If any students are PRO members, you can directly contact our research institute to make changes.
Pure EMA bullish resonance.
The host's understanding of this resonance indicator is also very simple:
● All EMAs aligned in a bullish arrangement, go long.
● All EMAs aligned in a bearish arrangement, go short.
This provides very good entry and exit opportunities.
If students cannot find reasons to enter the market and feel very FOMO, wanting some signal support, the EMA bullish and bearish arrangement signals are quite suitable for everyone.
The benefit here is that you won't miss out, and it will help everyone find the best entry points.
Many students in the discussion area hope to make this set of signals public.
The host has previously shared a basic template, and everyone can modify that template; the main parameters may not be the same.
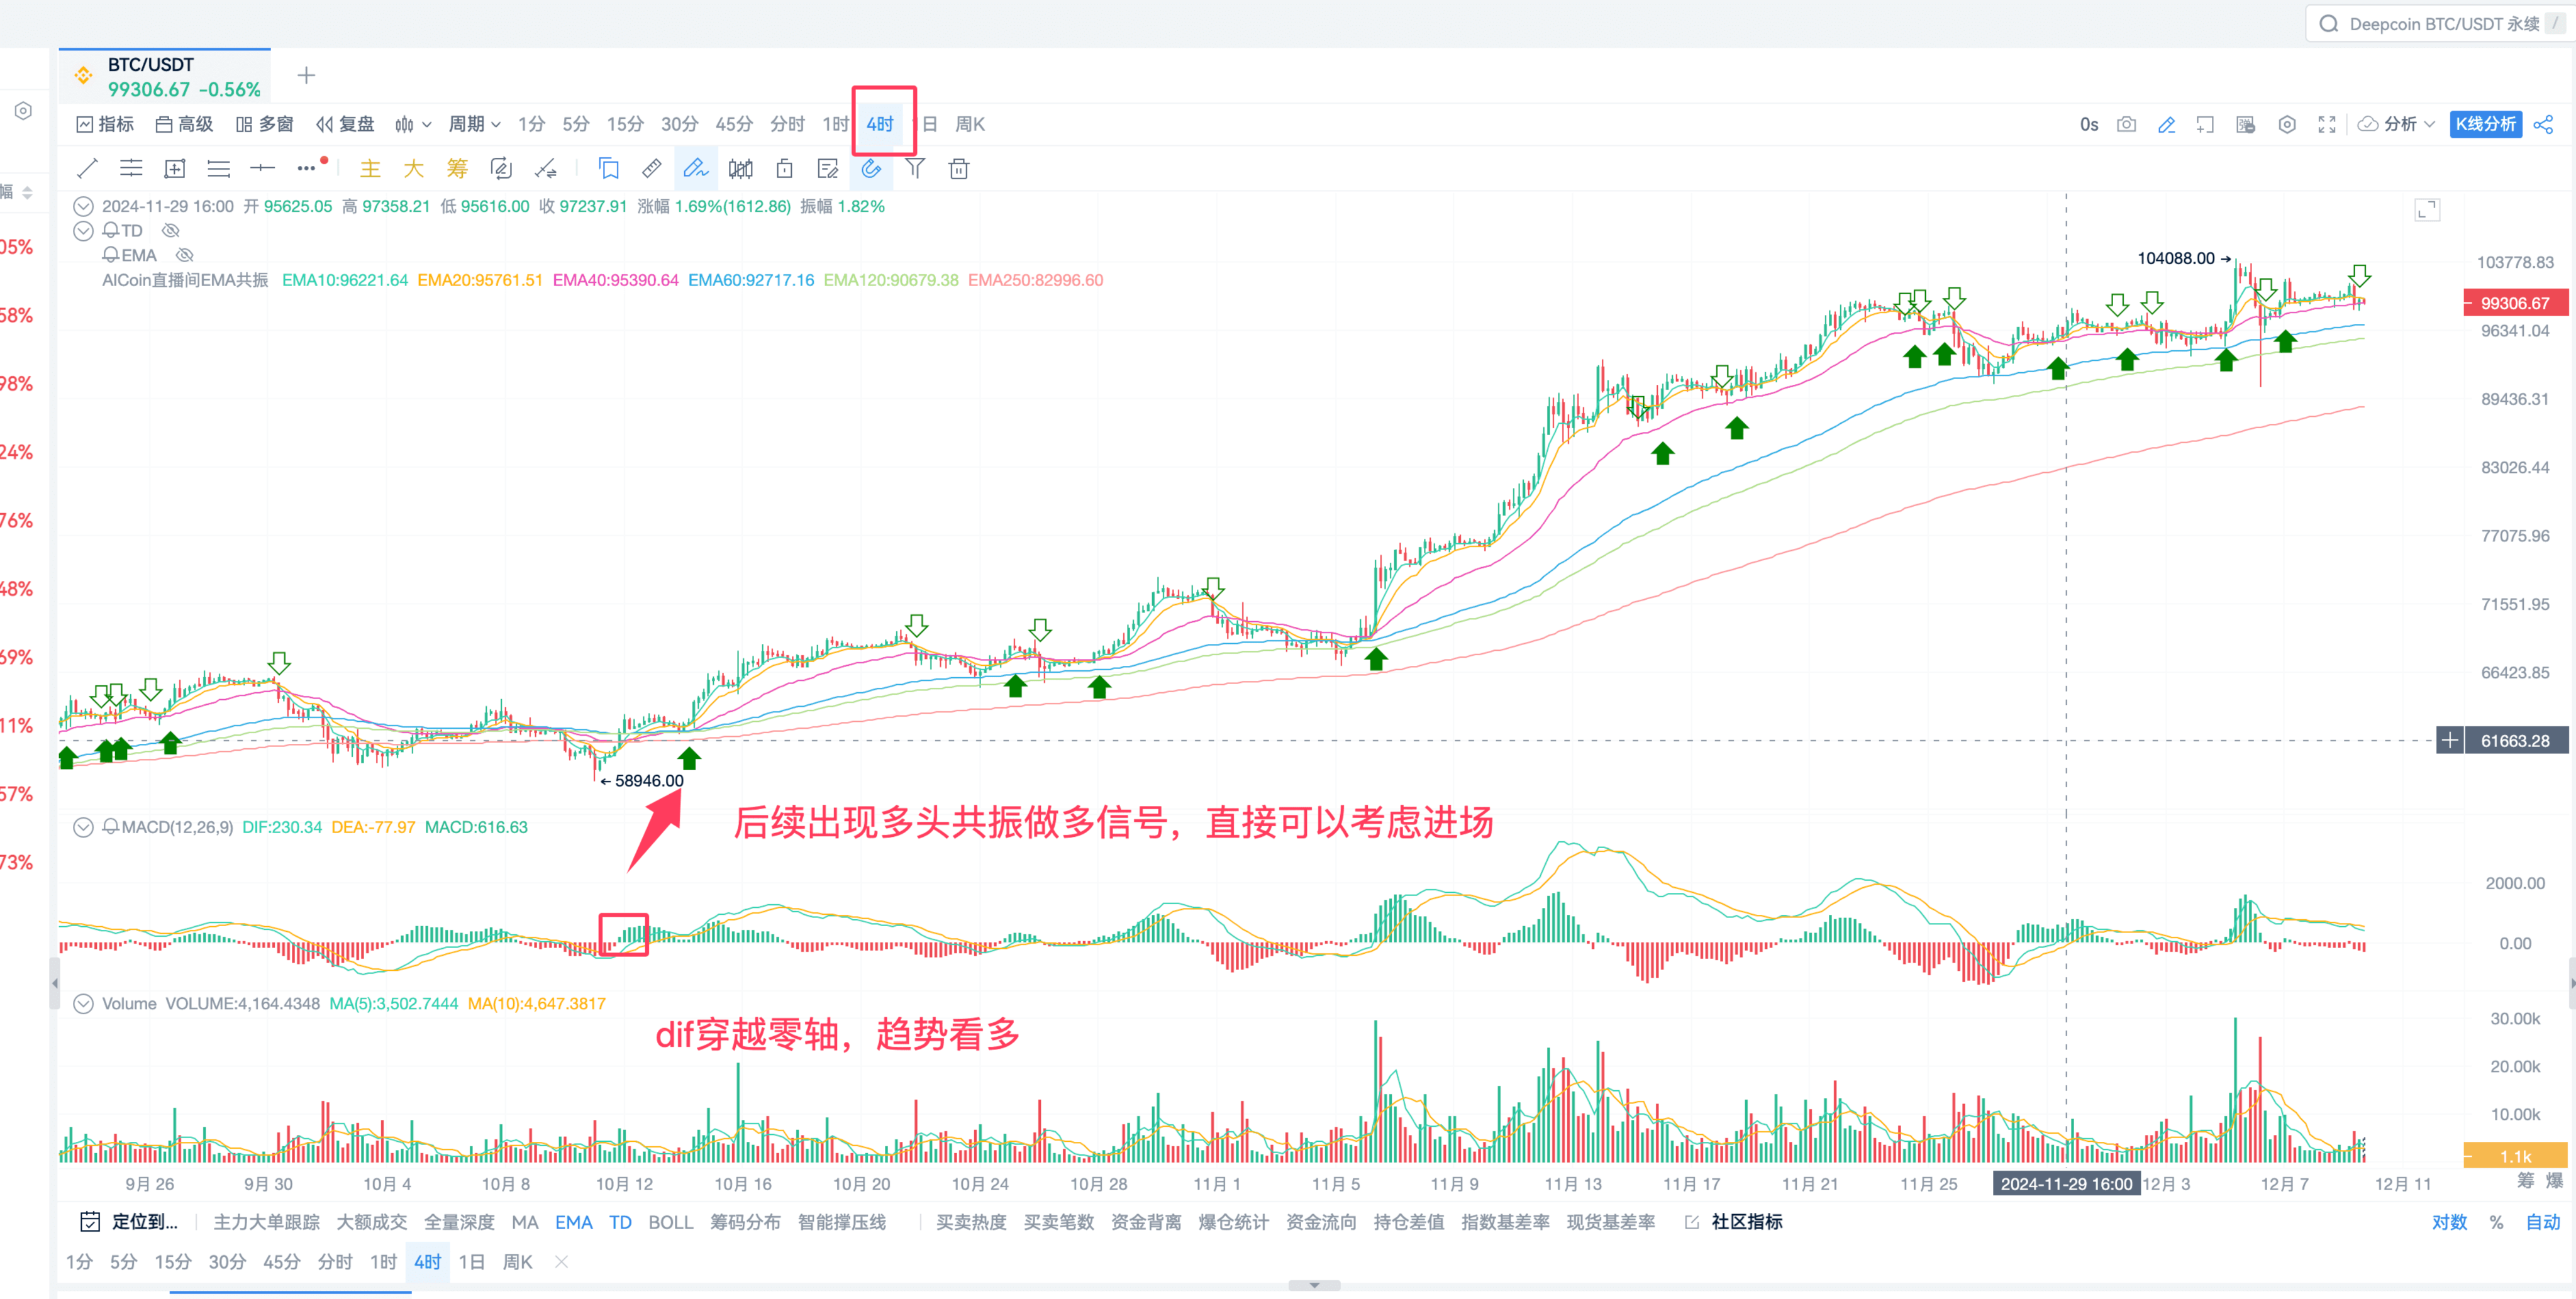
Here, students can subscribe and modify it to create their desired EMA resonance indicator.
That's the third thing done!
This time, I recommend everyone to try this set.
DIF line determines the trend, resonance signals find the entry, and together they make money.
Homework
Next, let’s take a look at what our research institute students are trading in the real market and making recommendations.
First Recommendation: AI Grid
Recommendation Reason: After breaking new highs, it will currently experience a period of small fluctuations, making it very suitable for grid trading. Automated low buying and high selling, earning while lying down.
Why does the host recommend this? Because the host has been using AICoin's AI grid for trading.
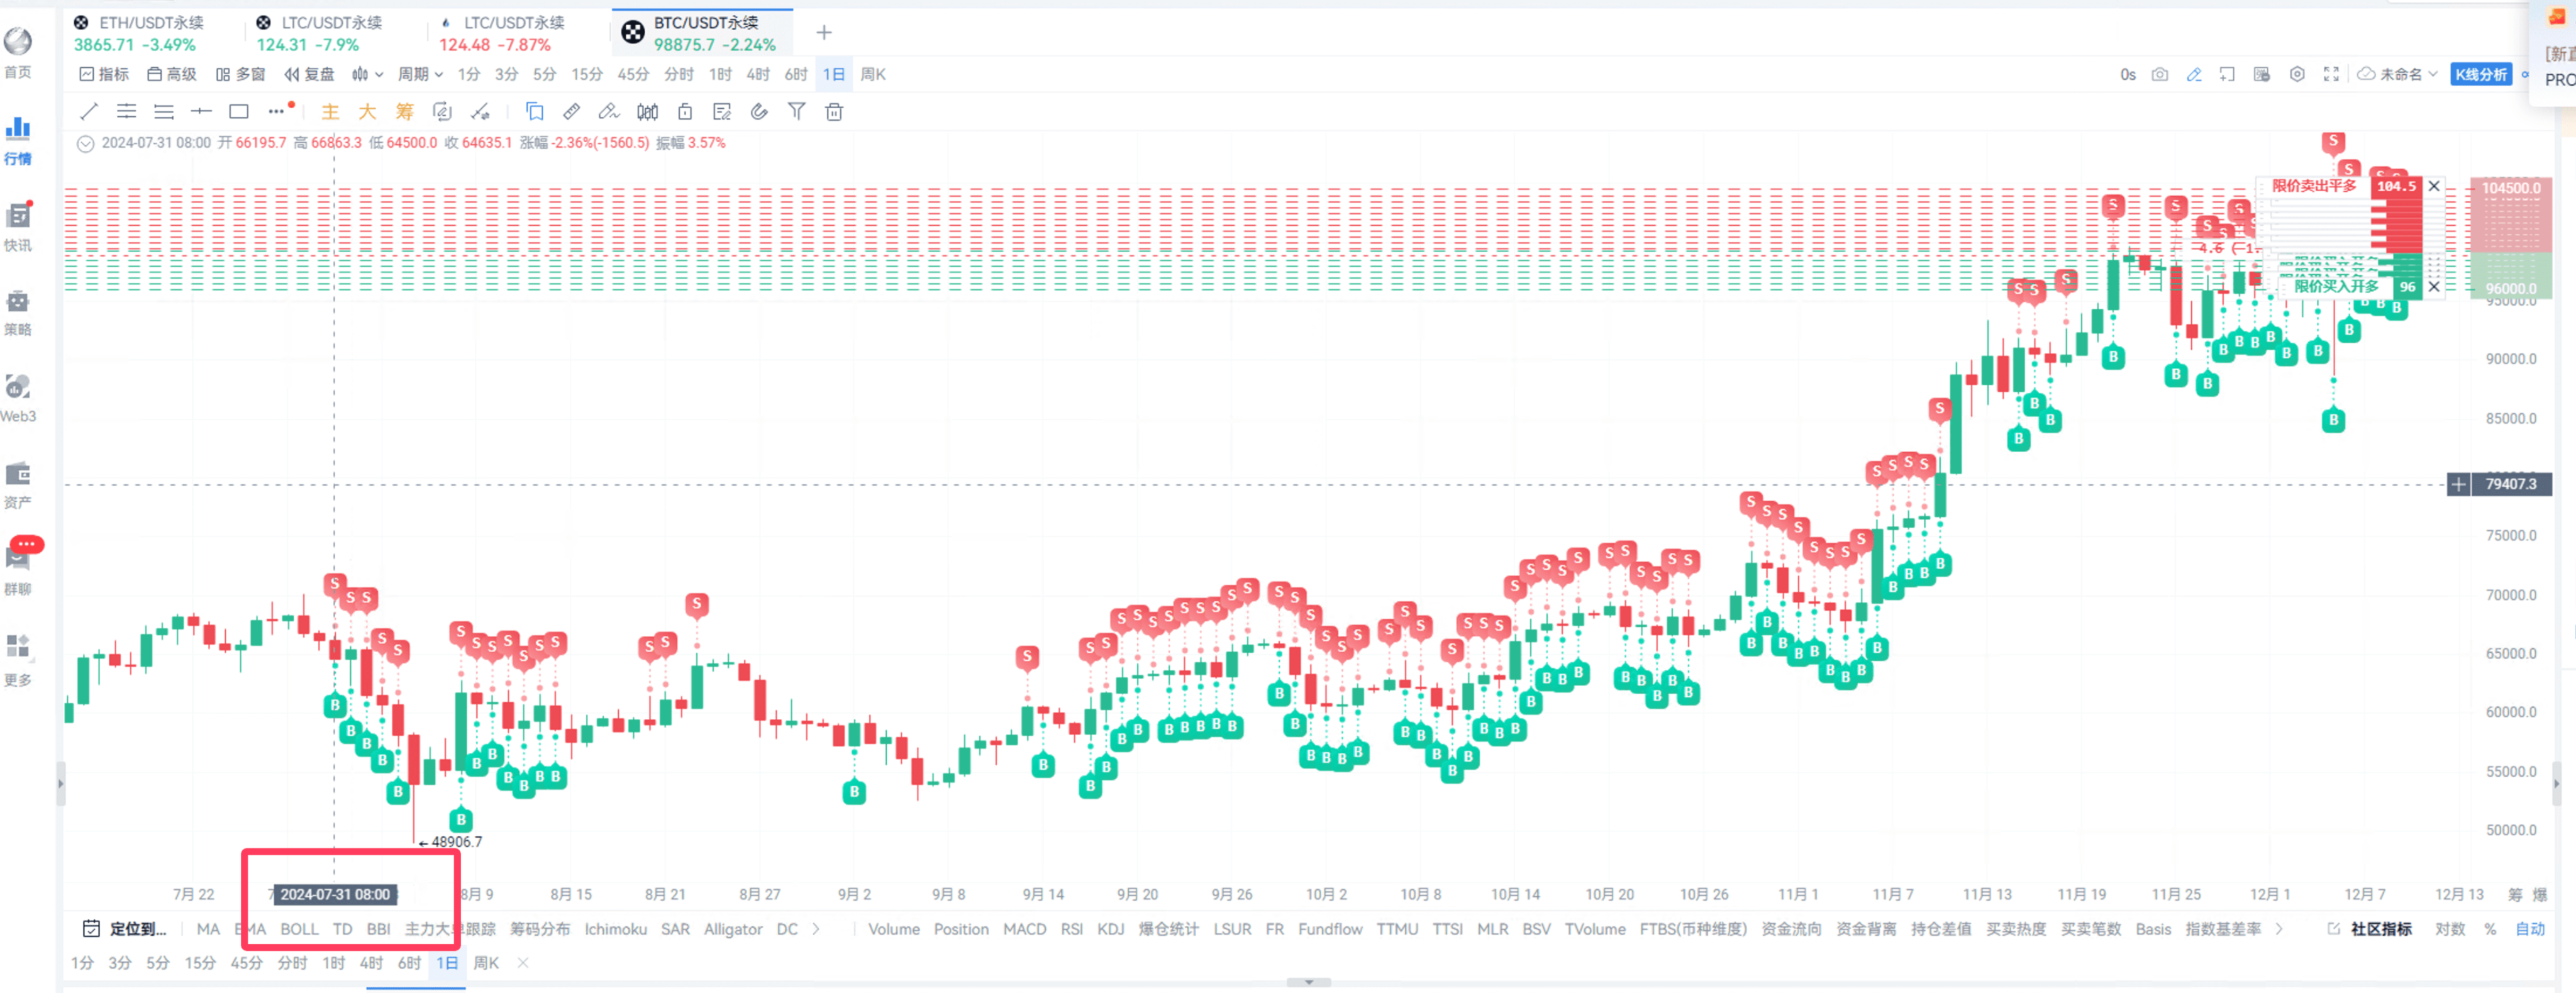
Running the grid since July 31, 2024.
It is important to note that if there is a period where it breaks above or below the grid, we need to readjust the upper and lower limits.
This is the new upper and lower limit range set by the host after breaking new highs.
Of course, the host's grid capital is not very large, only 700 USDT, but the effect is very good, and the returns are basically continuously increasing.
Because the returns are continuously increasing, it is worth sharing homework with everyone in the live room!
Everyone can also learn about and try using AICOIN's grid tool.
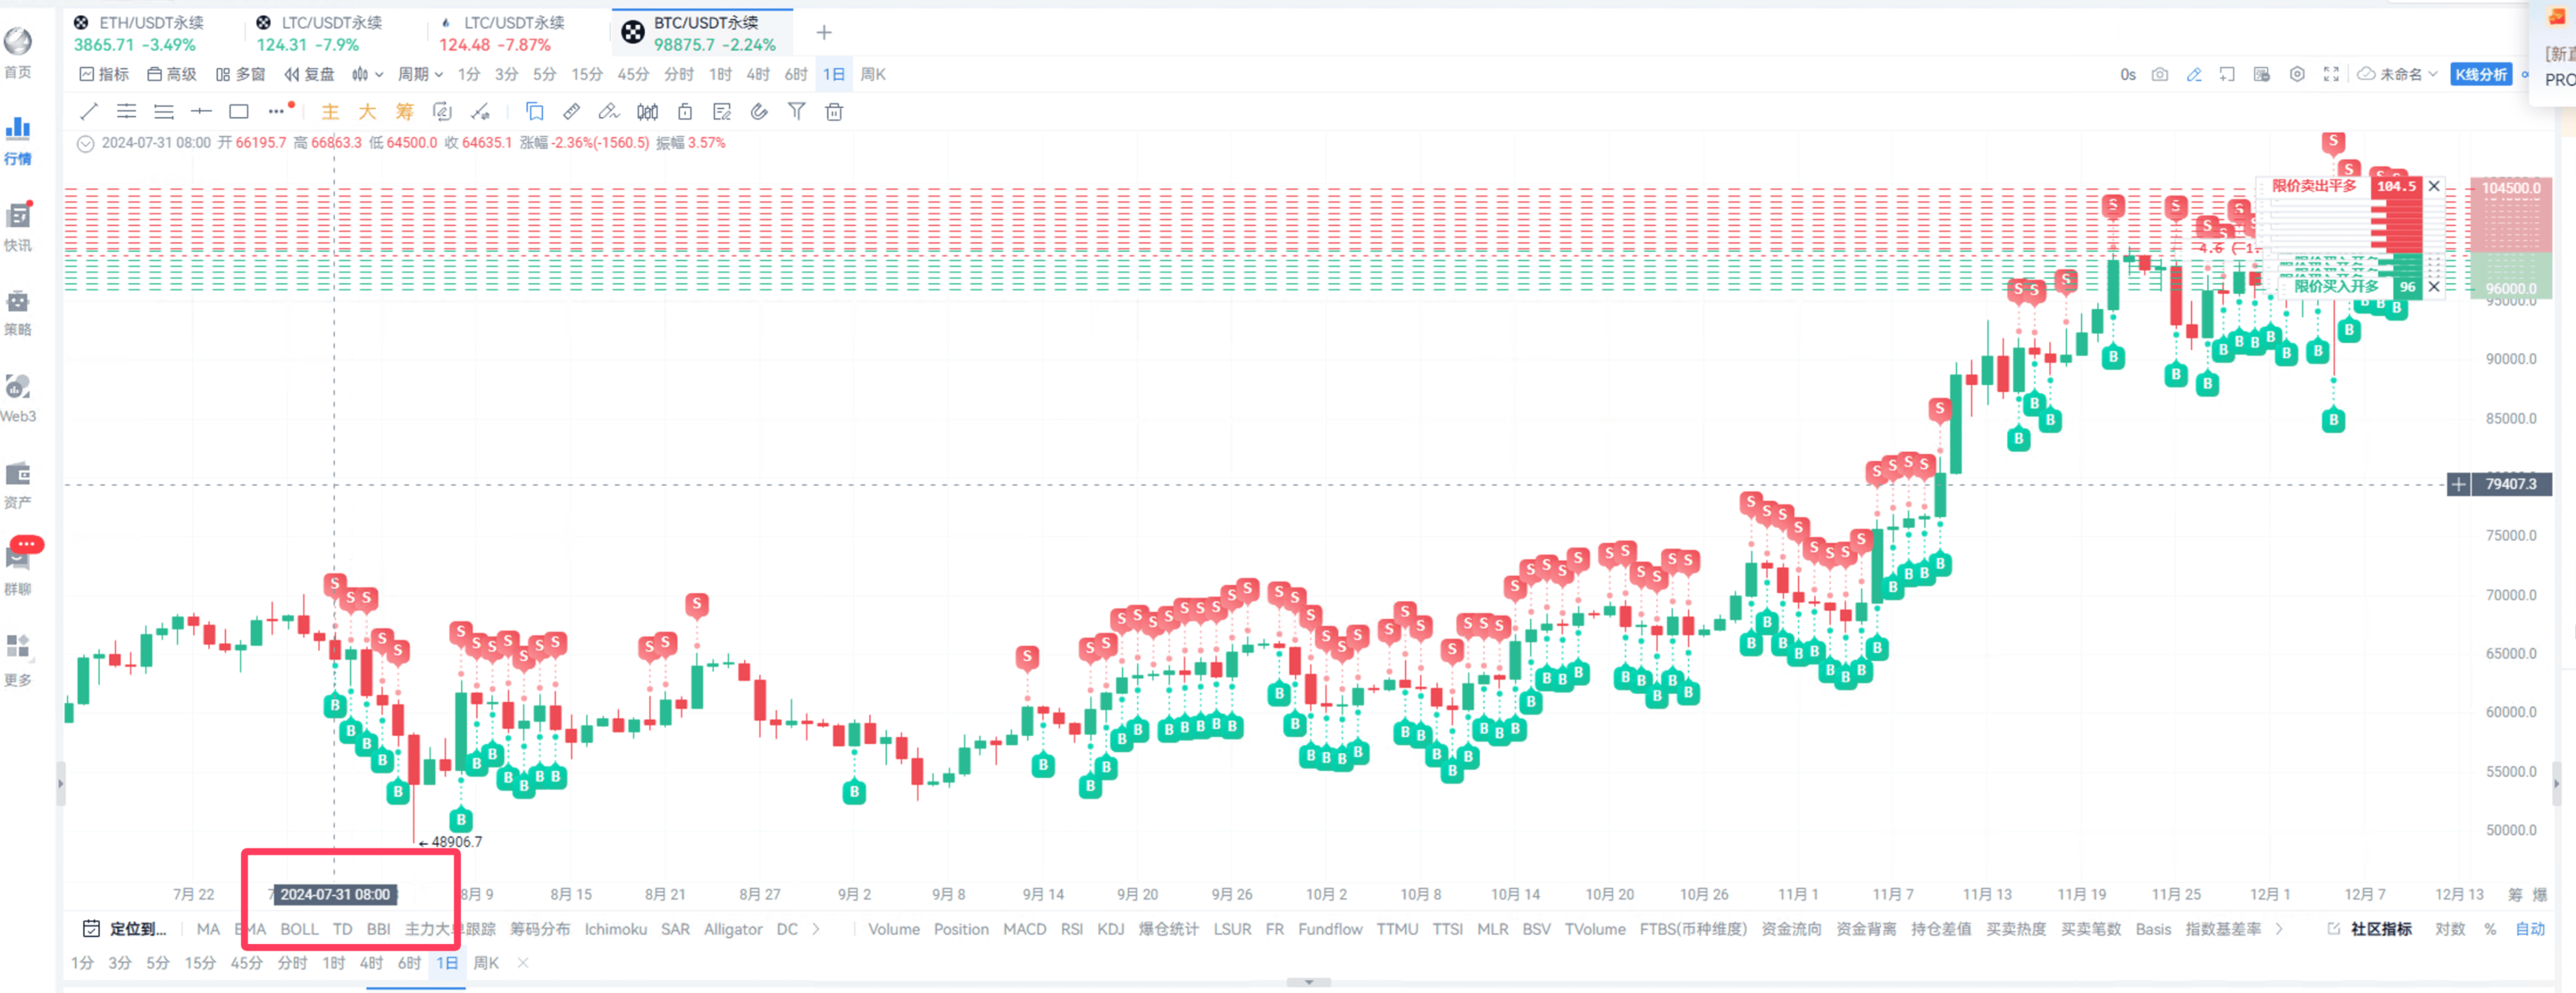
The host is currently running a long grid.
Second Recommendation: Arbitrage
The host has been running positive arbitrage, making money from funding fees.
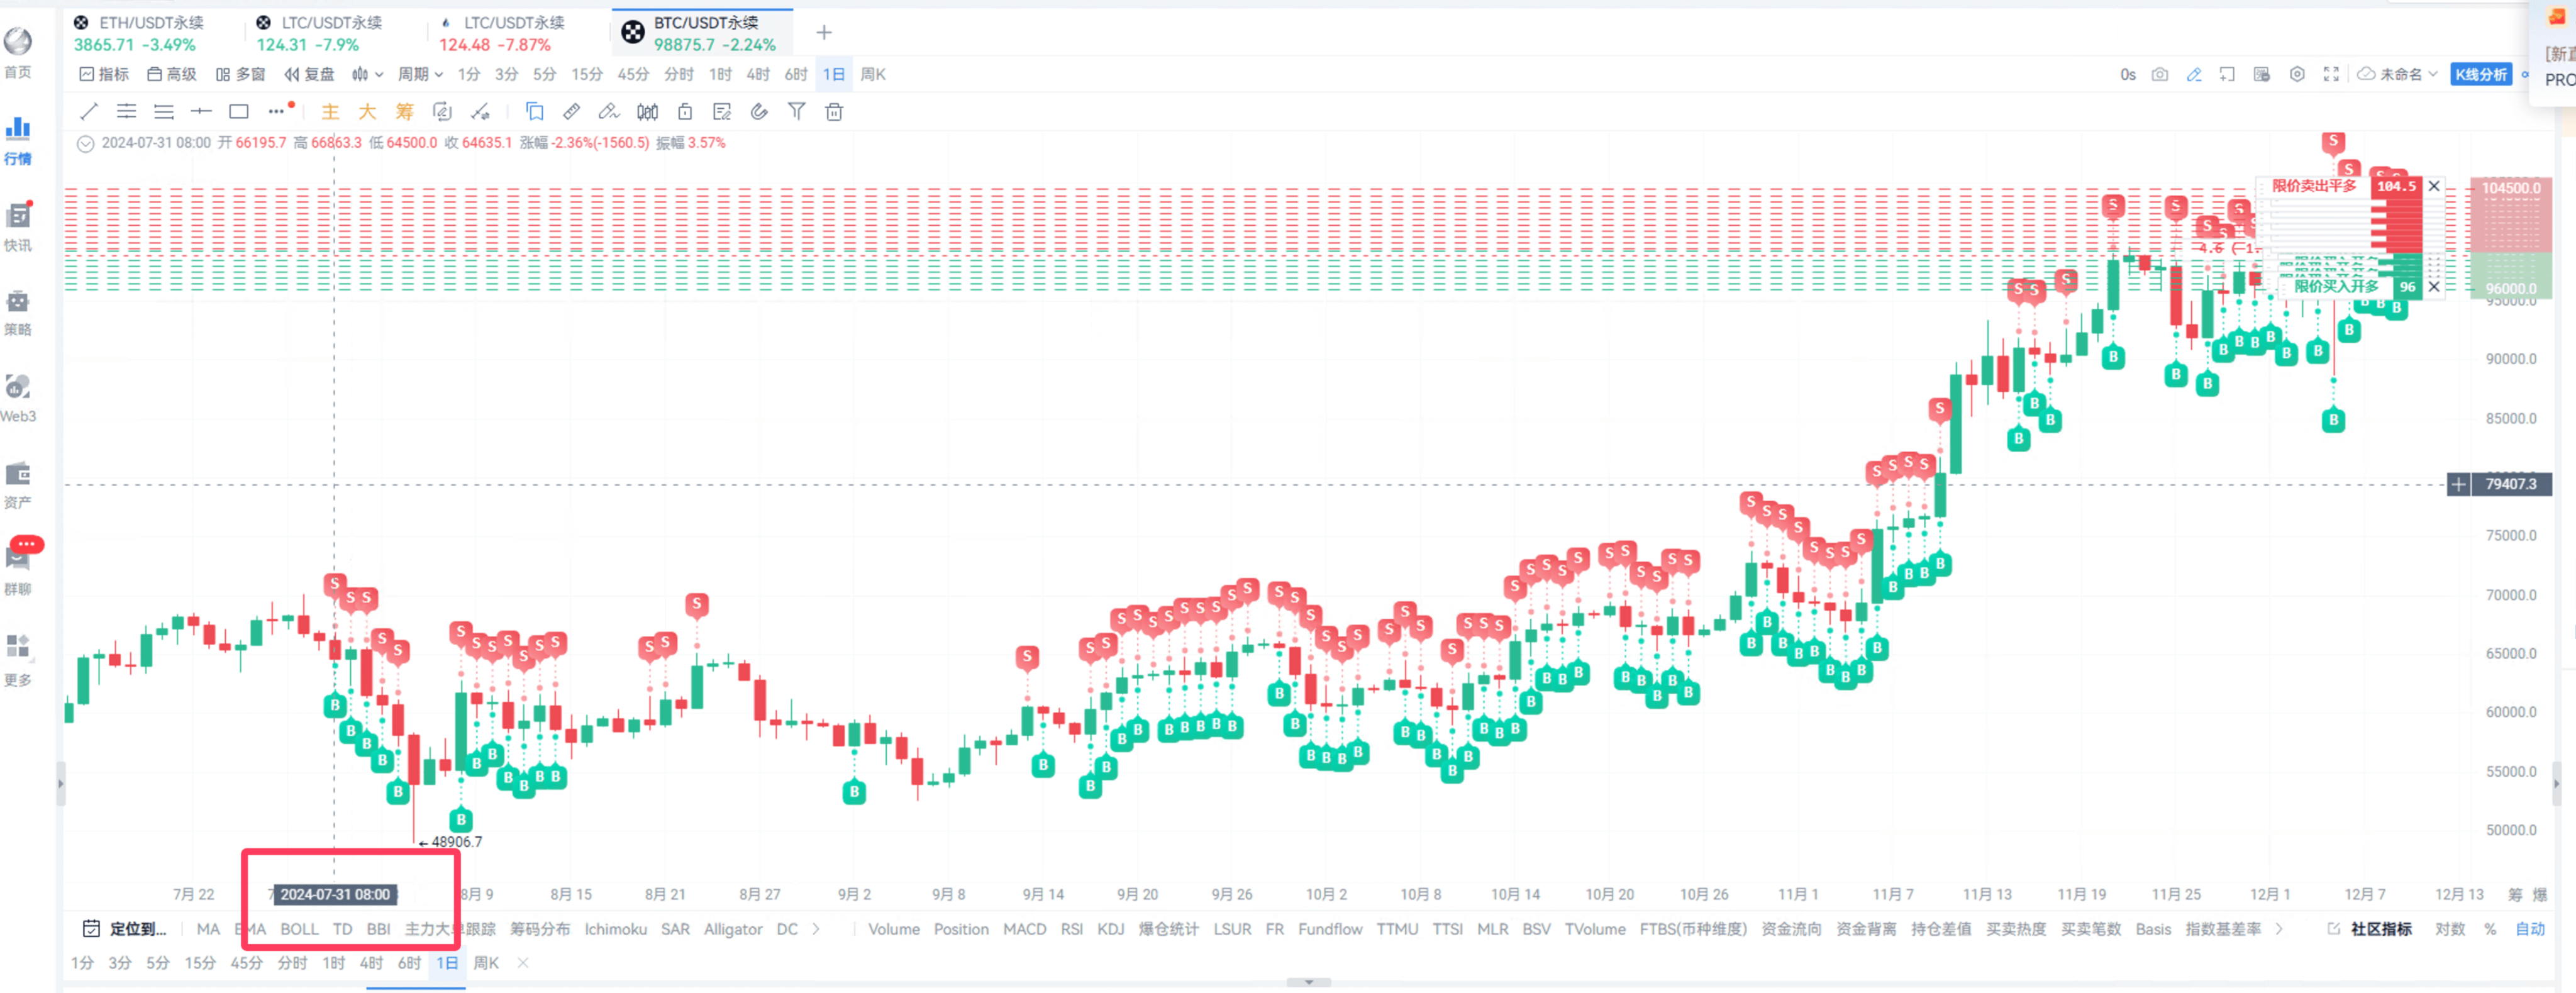
Here, the host's cost is around 30,000 USDT, and basically, they can receive profits three times a day, and can cash out at the right time.
If everyone has a larger amount of capital, you can try arbitrage; its advantage is stability, and you can definitely make money!
Because it is stable, it is very suitable for large funds.
These are some friends with large capital running arbitrage, earning a lot, and earning very quickly and steadily.
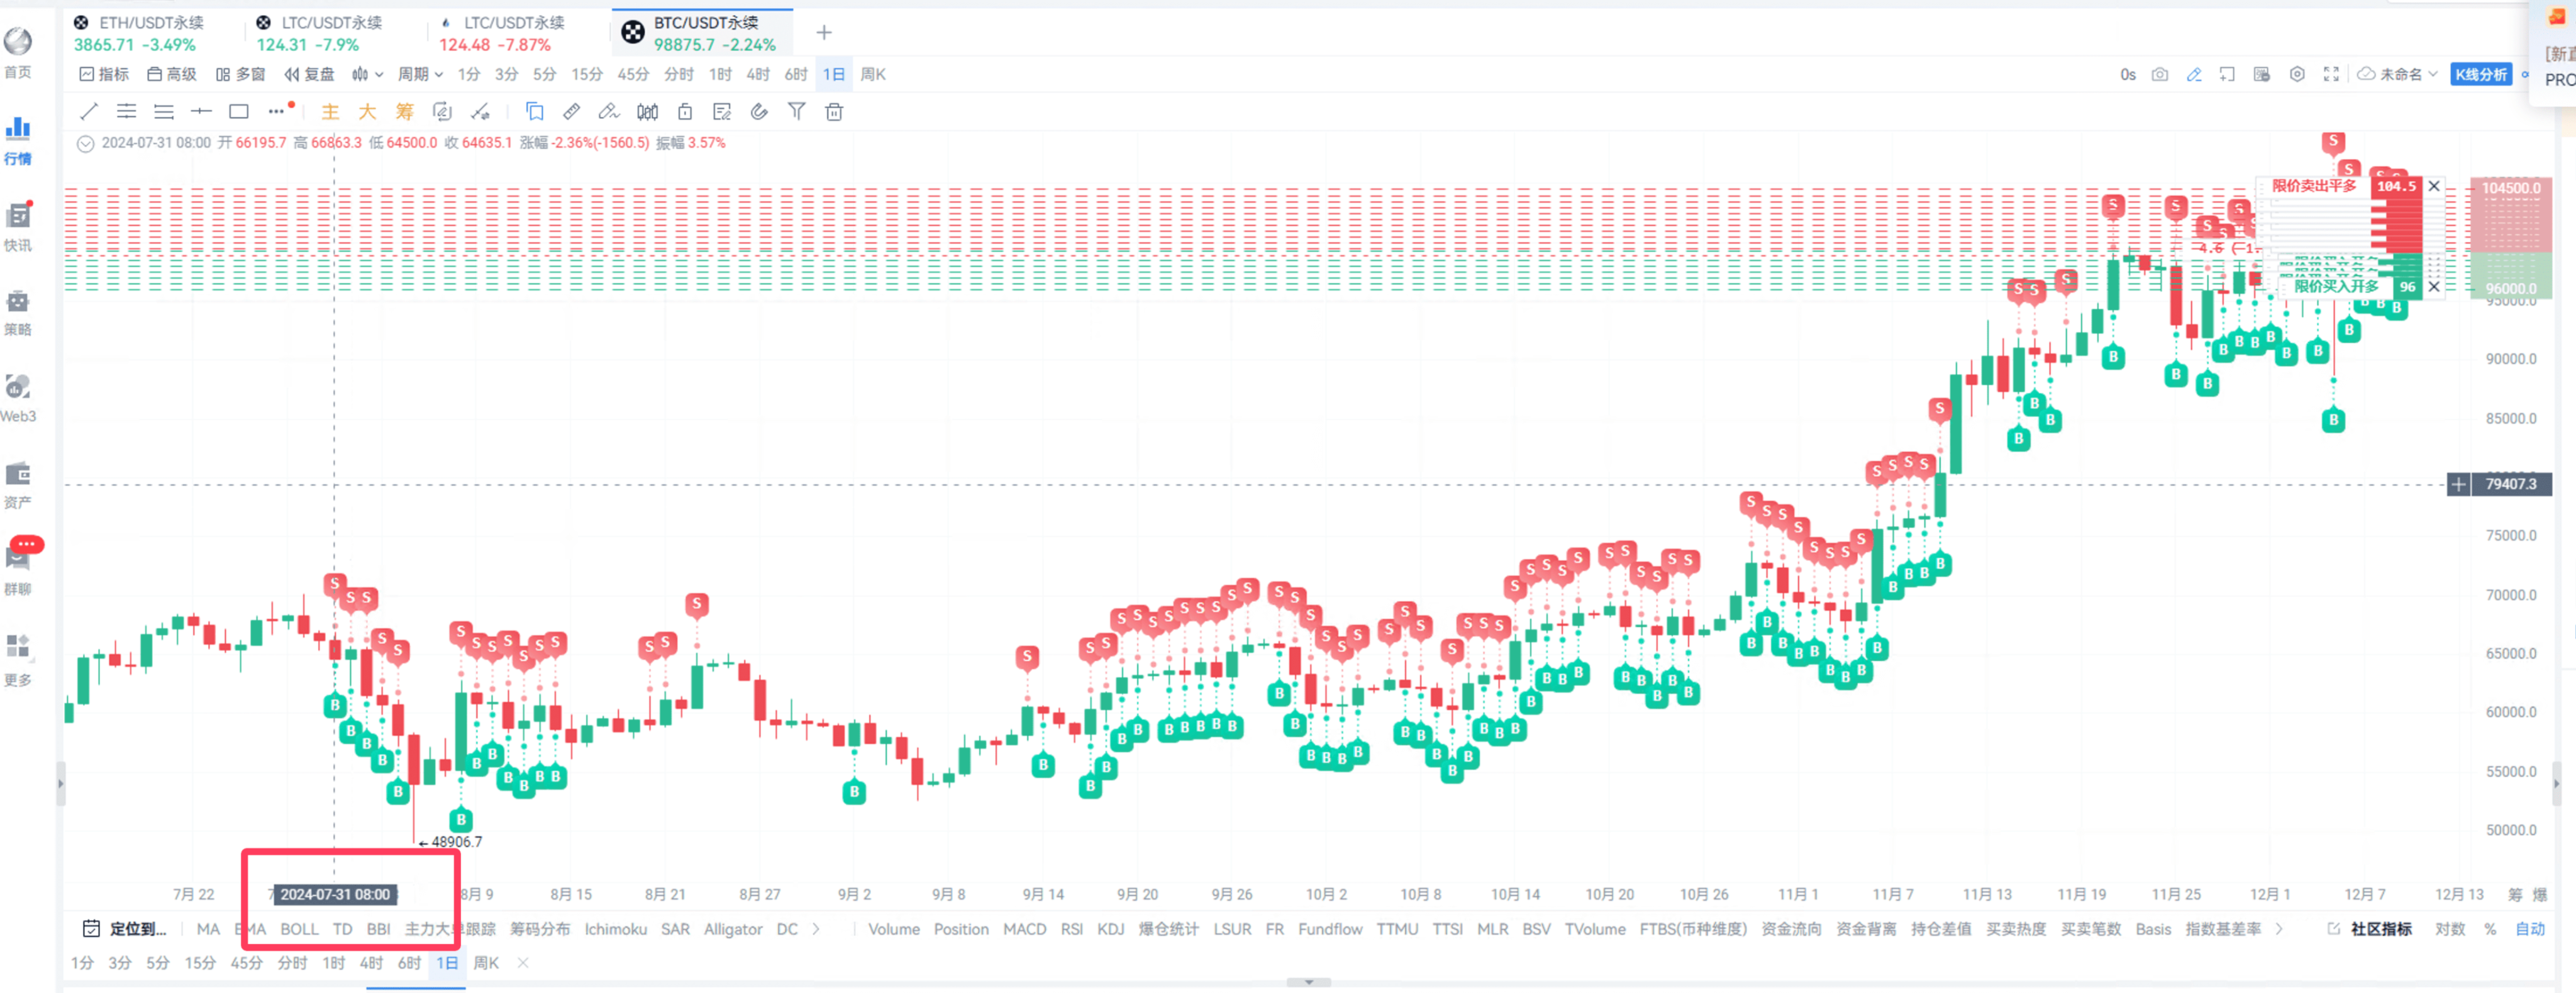
The arbitrage capital here is expected to be over 100,000 USDT, also generated using AICoin's arbitrage module.
In summary, there are many opportunities to make money here. Arbitrage is currently very suitable for large funds to engage in, allowing you to find returns in the market, and this sense of certainty is very satisfying.
Summary:
Homework 1: Recommend AI Grid, which the host has used, is profitable in real trading, and the returns are good.
Homework 2: Recommend the arbitrage section, utilizing funding fee arbitrage. Large funds make big money, while small funds earn small amounts and gain experience.
If anyone wants to discuss other information, feel free to join as a PRO member and chat with our editors about the market to get more trading information.
That concludes all the content from the live session!
Thank you all for your attention, and stay tuned to our live room.
In a bull market, let's explore the market together and find trading opportunities! Use AICoin well to earn a free life.
Recommended Reading
For more valuable live content, please follow AICoin's “AICoin - Leading Data Market and Intelligent Tool Platform” section, and feel free to download AICoin - Leading Data Market and Intelligent Tool Platform.
免责声明:本文章仅代表作者个人观点,不代表本平台的立场和观点。本文章仅供信息分享,不构成对任何人的任何投资建议。用户与作者之间的任何争议,与本平台无关。如网页中刊载的文章或图片涉及侵权,请提供相关的权利证明和身份证明发送邮件到support@aicoin.com,本平台相关工作人员将会进行核查。

