# AICoin Introduction to Technical Analysis ③ K-Line Chart Quick Understanding Tutorial
Understanding K-line charts is one of the essential skills for traders in the cryptocurrency market!
This issue explains the "Naked K-line."
What will the subsequent trend be? Where are the buy and sell points? This article clarifies everything!
1)BTC Real-time Analysis:
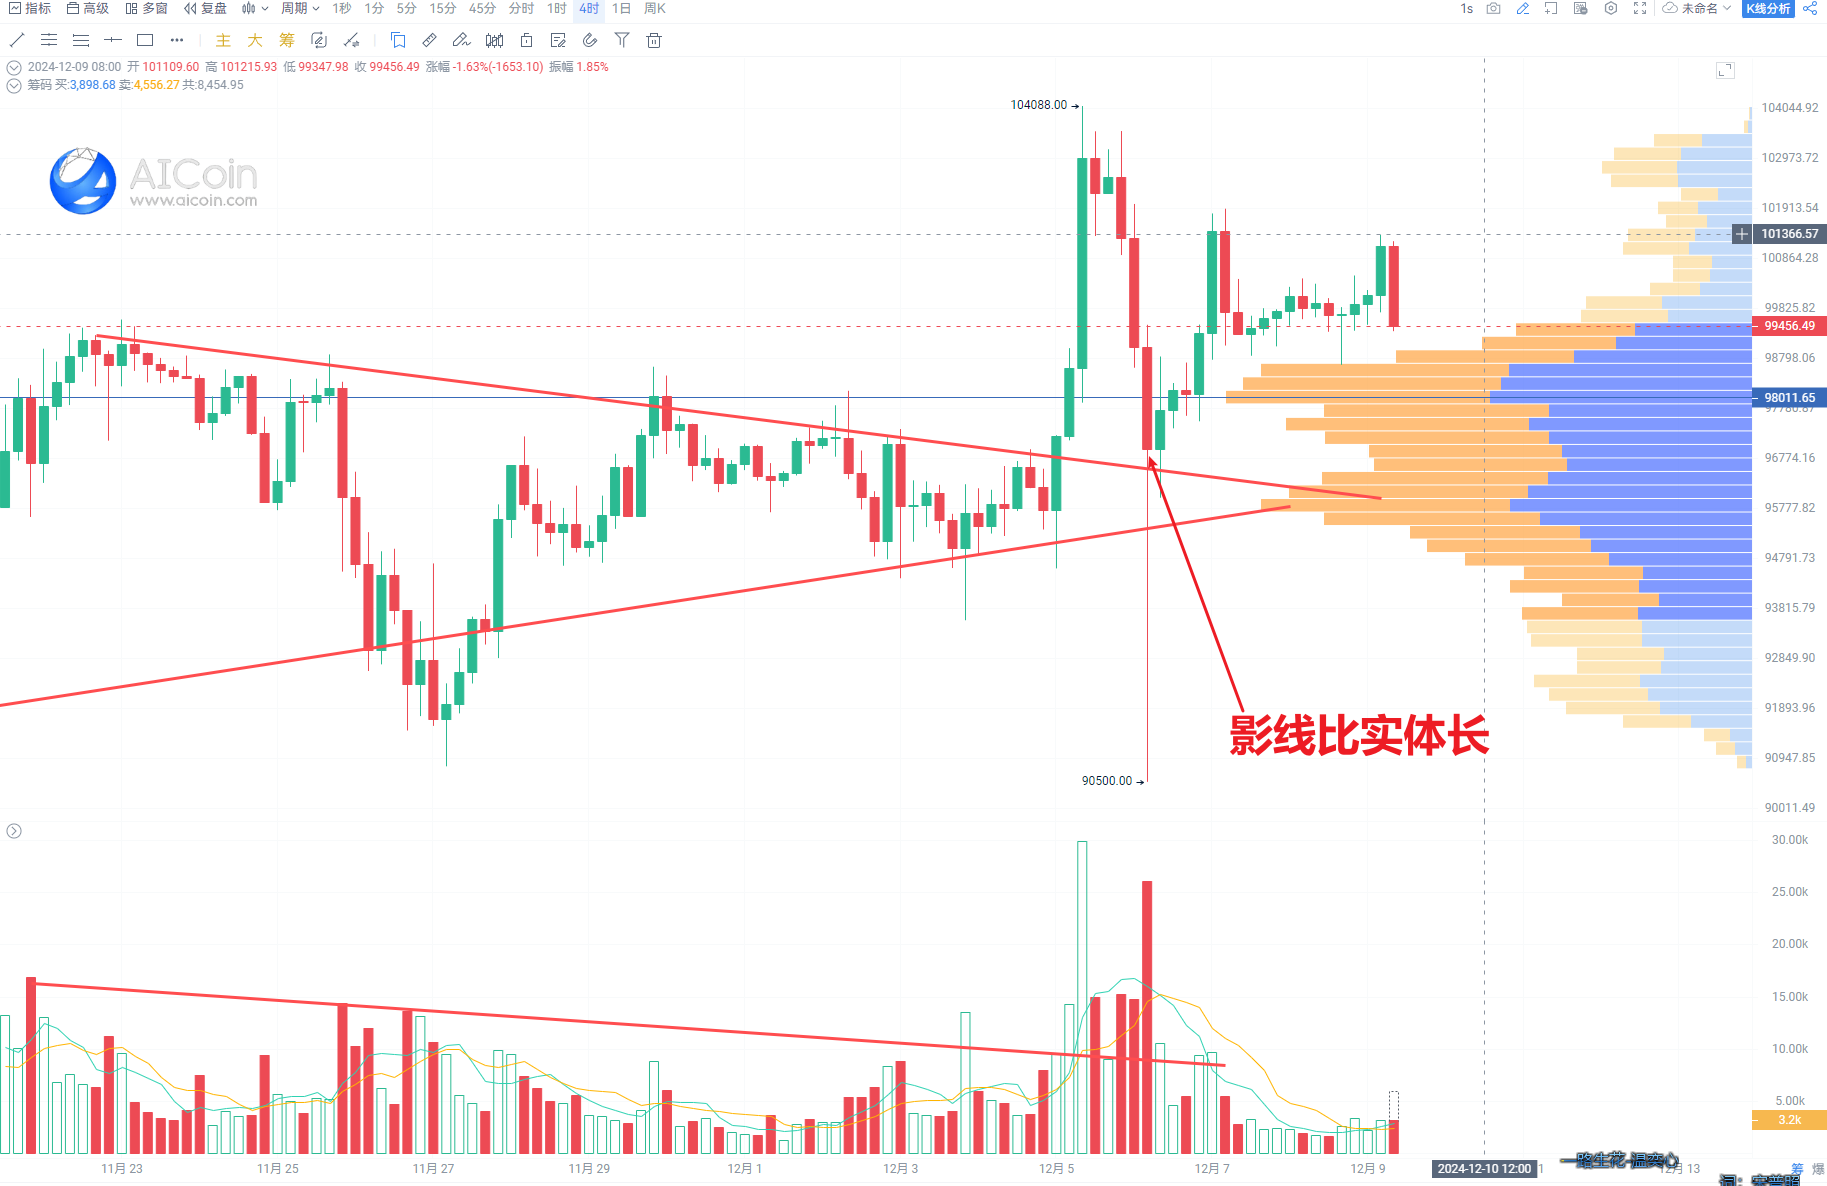
Continuing from the previous analysis, we predict a quick pullback after #BTC reaches 100,000, with strong support at the triangular support level.
We observed that the K-line's body immediately rebounded after crossing the support line, which aligns with our expectations. However, it encountered a relatively rare large spike, causing most leveraged investors to be unable to escape.
From this, we can see the necessity of having a reasonable stop-loss price; without it, the consequences could be dire, returning to square one overnight!
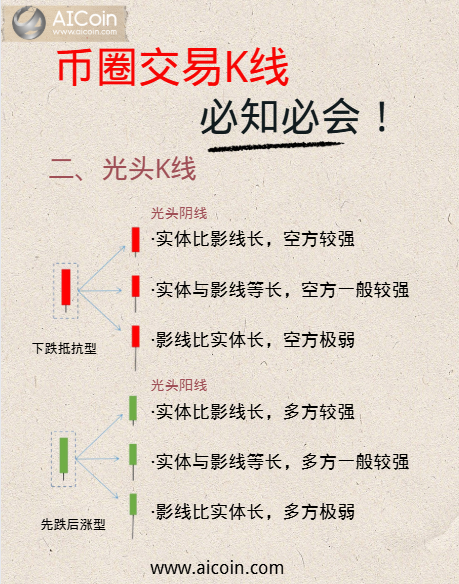
On December 6, a "Naked Bearish Line" pattern appeared, fitting our "downward resistance type" third model, where the "shadow is longer than the body," and the longer the shadow, the stronger the support.
So how was this K-line formed? Why is it "strong resistance, strong support"?
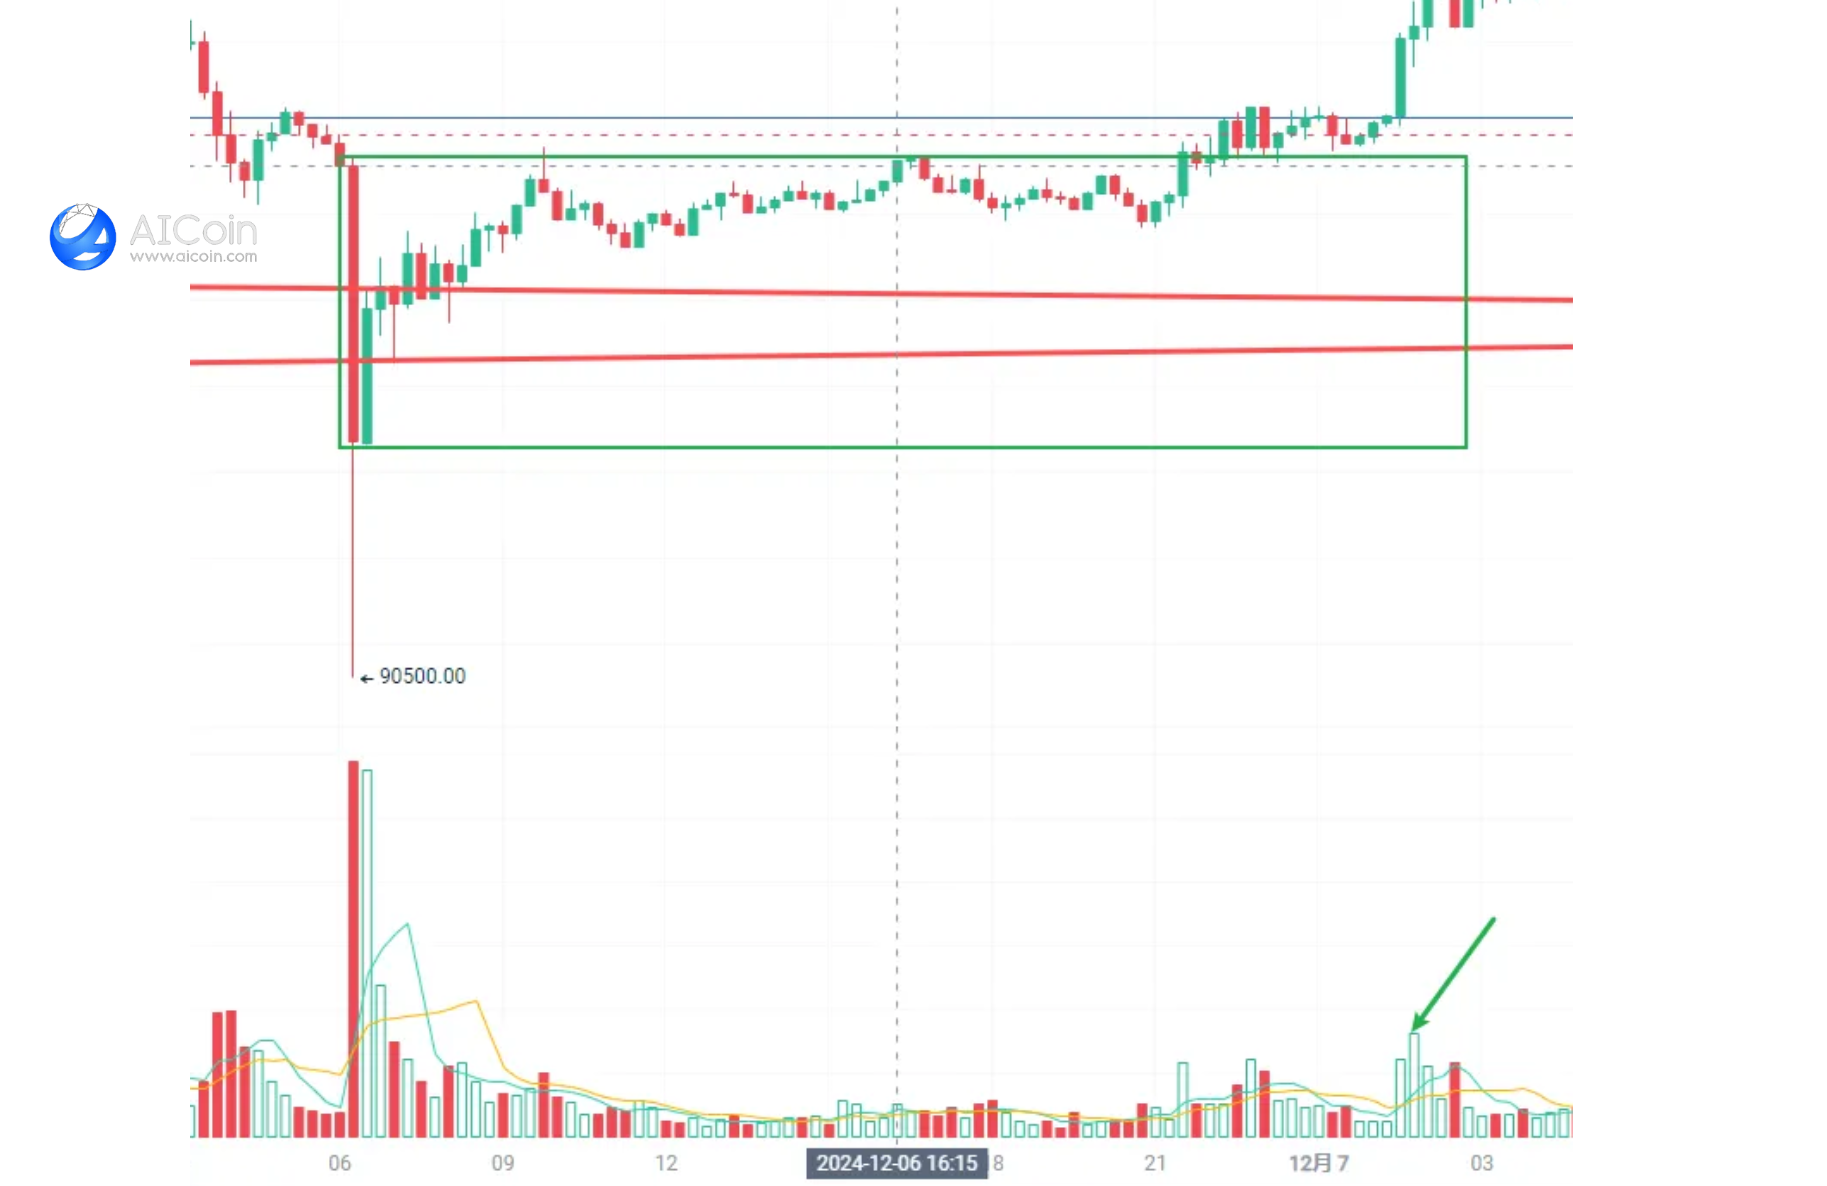
We can break it down using the 15-minute chart to analyze how this spike in the battle between bulls and bears occurred.
First, the bears quickly smashed the price down to 90,000, leading to a massive liquidation of leveraged traders.
Then a green K-line appeared, with bulls aggressively buying the dip, consuming some of the bears.
In the following hours, the long red line was gradually consumed, eventually breaking through with increased volume. The bears were basically exhausted, and the bulls temporarily took control, with the bull's cost price within the green box range, forming strong support.
12.10 4-hour real-time
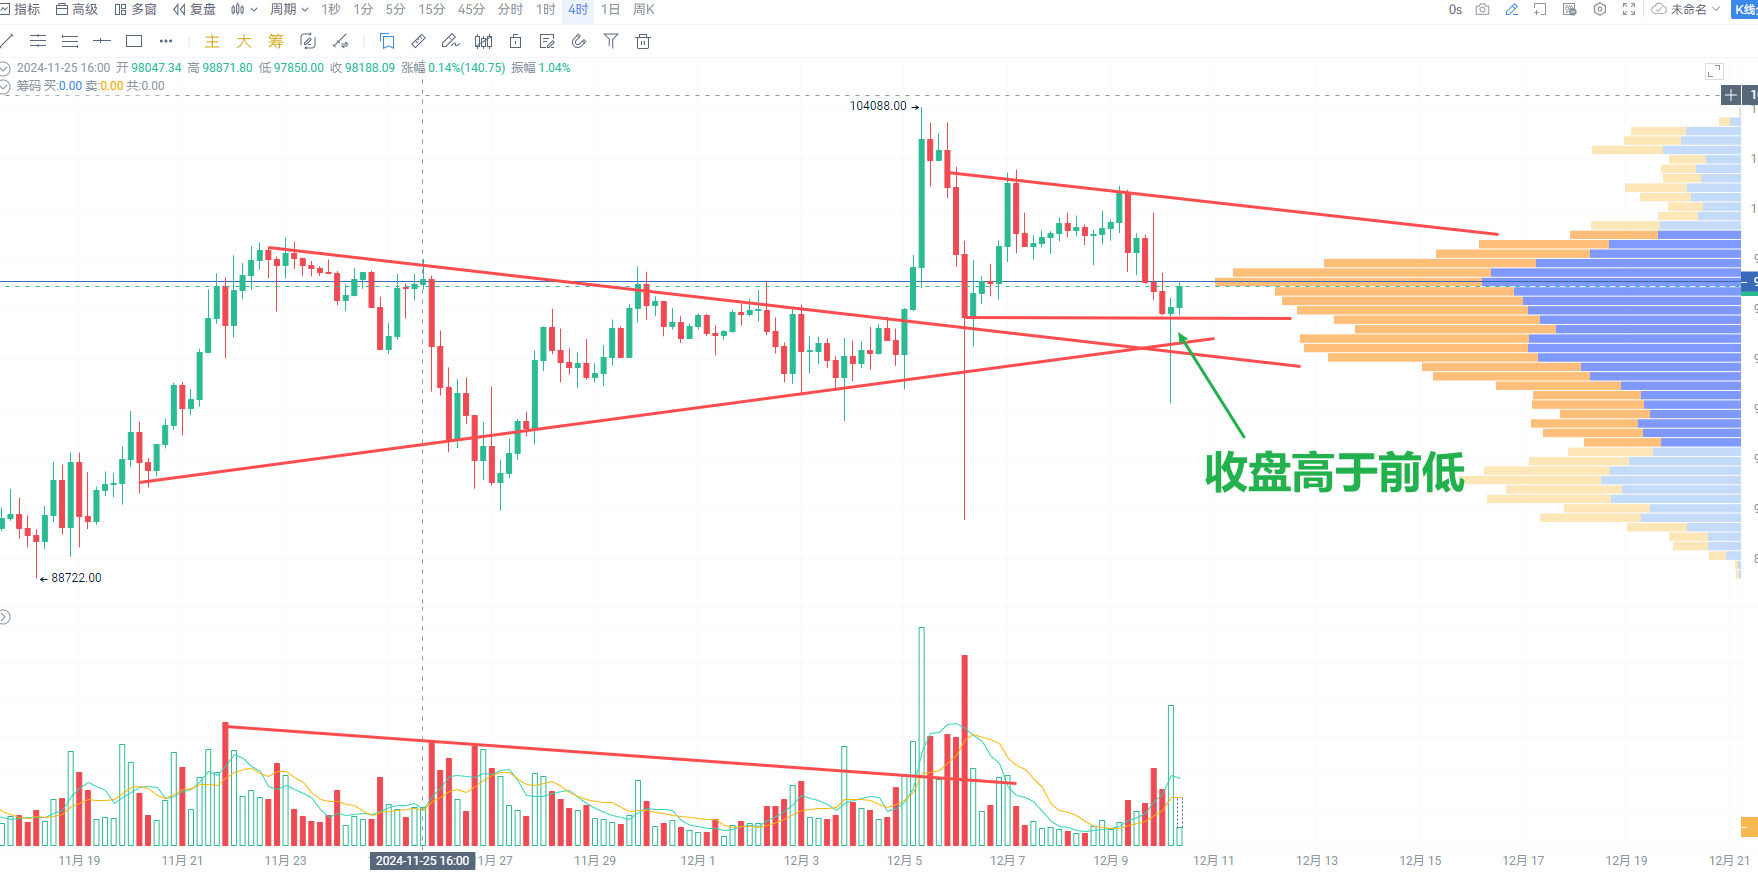
2)Buy and Sell Point Recommendations (from Ace Smart Analysis):
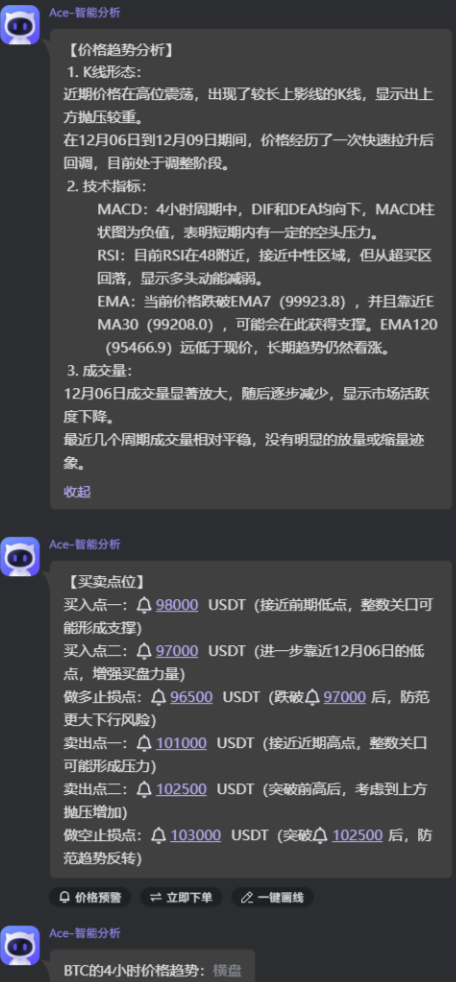
Summary:
For downward resistance type red K-line:
The battle between bulls and bears, first down then up, with bulls having the upper hand, high probability of continued rise the next day;
The longer the lower shadow, the greater the strength of the bulls below.
Overall, when a first down then up type appears, the buying power is strong, but the lengths of the body and lower shadow differ, indicating a different comparison of buying and selling power.
For first down then up type green K-line:
The battle between bulls and bears, with bears having the advantage, but after the drop, support is gained, and a rebound may occur;
The longer the lower shadow, the greater the resistance of the bulls below;
If it appears at a relatively low level, the probability of rising is high;
If it appears at a relatively high level with high volume, the probability of falling is high.
⚠ Note: The above operational suggestions do not constitute investment advice and do not recommend any cryptocurrency. All investors are advised to trade rationally within their capabilities!
Recently, there have been many counterfeit AICoin websites. Please only recognize the ".com" domain.
Free Experience Entry 👉 aicoin.com
免责声明:本文章仅代表作者个人观点,不代表本平台的立场和观点。本文章仅供信息分享,不构成对任何人的任何投资建议。用户与作者之间的任何争议,与本平台无关。如网页中刊载的文章或图片涉及侵权,请提供相关的权利证明和身份证明发送邮件到support@aicoin.com,本平台相关工作人员将会进行核查。


