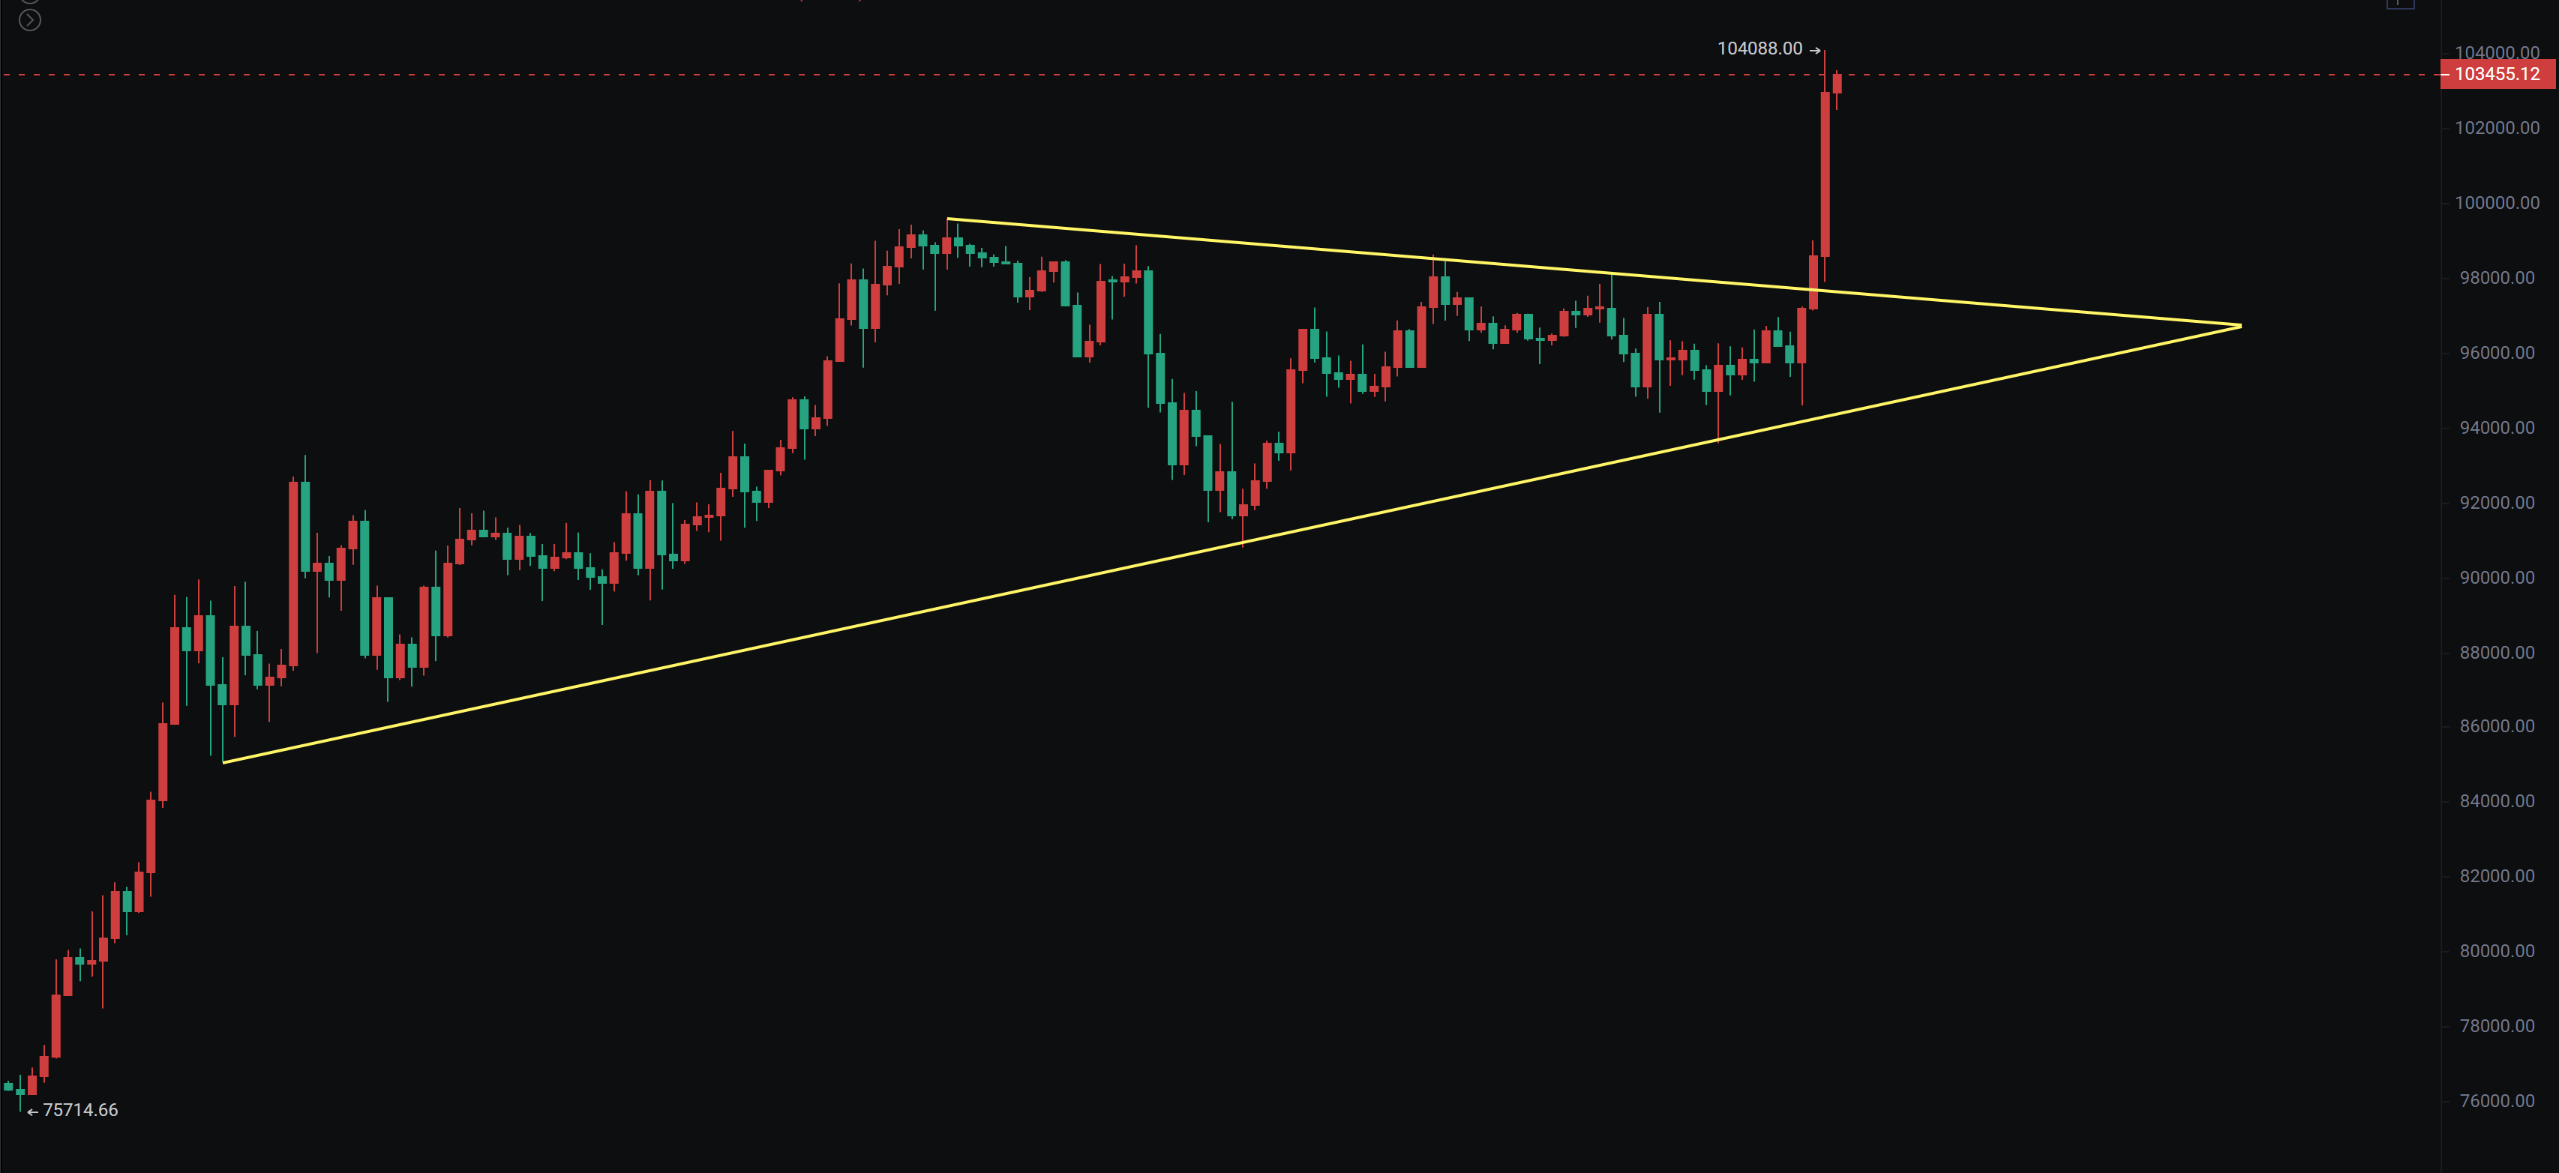
On December 2, it was noted that a BTC head and shoulders bottom may form, and the market continues to look bullish towards 107,000. Yesterday, it was mentioned that the 4-hour chart showed a massive volume, forming a triangular convergence structure, with a potential MACD bottom divergence expected. It all depends on whether the rebound can effectively break the key resistance at 97,200—98,600.
In a bull market, we don't talk about tops and we don't short. Even when there is a demand for a decline, I have always reminded not to short. Once the pullback is in place, we can increase our positions. Being stuck is temporary, but a liquidation is irreversible. Bitcoin broke through the converging triangle this morning, reaching 100,000 USD, peaking at 104,088, reigniting the market. Ethereum broke through 3,800 last night, and after a short-term pullback, it rebounded this morning, influenced by Bitcoin's rise, reaching 3,905, while altcoins experienced significant declines. This is a normal situation as funds continue to flow in the market, with external funds also continuously inflowing.
Powell: Bitcoin is like gold, existing in digital form. Trump confirmed Paul Atkins was selected as the new SEC chairman. Bitcoin's market cap ranks seventh globally, soon to surpass the total market cap of the UK's FTSE 100, still 7 times away from gold. This bull market could reach 150,000 to 200,000 without difficulty, but never FOMO; a pullback is an opportunity to increase positions!
Bitcoin
Previously, we mentioned that the weekly Fibonacci extension line breaking 94,800 looks towards around 107,000. As of the time of writing, it reached a high of 104,088, oscillating for 11 days before breaking upwards again. The BOLL contraction price line has consistently maintained above the MA20, rebounding after a spike, with the overall pullback still weak above the Fibonacci 0.236.
The daily RSI divergence did not drop but was instead broken through. The 4-hour MACD also indicated a potential bottom divergence last night, with a massive volume increase on the 4-hour chart, breaking through the converging triangle for a follow-up operation. Support: Resistance:

Ethereum
There isn't much to say technically; we previously mentioned that 2,800 is the dividing line between bullish and bearish for Ethereum. Currently, the weekly chart has broken the downward trend line from 4,093 to 3,977. A few days ago, we warned that if this line was not broken, it would lead to a decline, pulling back to 3,500. Last night, it continued to break through 3,800, and today it broke through 3,900, completely surpassing this resistance line. If it does not drop back, we still look bullish. Bitcoin's rise is linked to Ethereum and altcoins taking turns to catch up, with altcoin volatility increasing, so manage accordingly.
Support: Resistance:

If you like my views, please like, comment, and share. Let's navigate through the bull and bear markets together!!!
The article is time-sensitive and for reference only, updated in real-time.
Focusing on K-line technical research, sharing global investment opportunities. Public account: Trading Prince Fusu

免责声明:本文章仅代表作者个人观点,不代表本平台的立场和观点。本文章仅供信息分享,不构成对任何人的任何投资建议。用户与作者之间的任何争议,与本平台无关。如网页中刊载的文章或图片涉及侵权,请提供相关的权利证明和身份证明发送邮件到support@aicoin.com,本平台相关工作人员将会进行核查。


