Understanding candlestick charts is one of the essential skills for cryptocurrency traders!
Hello everyone, I am Teacher J. I have carefully organized basic knowledge of candlesticks for beginners and will provide some possible trading suggestions based on real market analysis, so please be patient and read on~
Teaching someone to fish is better than giving them fish!
I will continue to update related content, including naked candlesticks, chart patterns, technical indicators, and other practical techniques.
Whether you are a beginner or an experienced trader, there is always something to learn and review!
You don't need to learn a lot; focus on mastering the essentials! Always maintain a humble attitude towards the market and a lifelong learning mindset!
This issue is part of the naked candlestick series, explaining fully naked candlesticks. Like and bookmark this article to easily analyze the market!
Below is the recent hottest XRP 1-hour live analysis👇

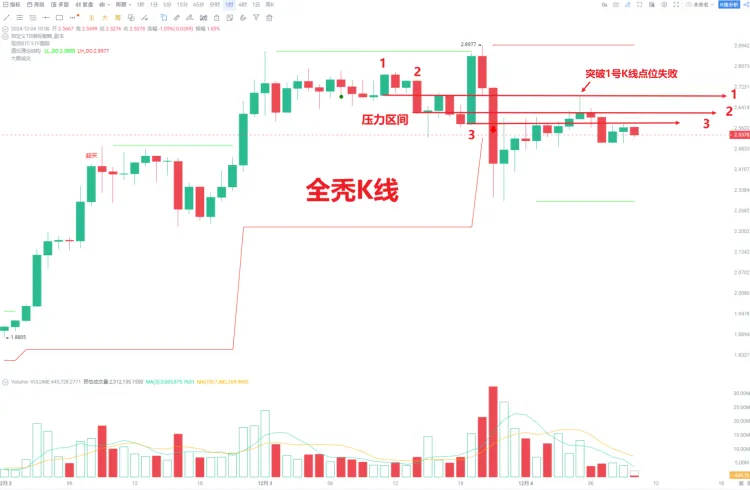
We found 3 fully naked candlesticks (special candlesticks), marked as 1, 2, and 3.
Step ①: Determine the overall trend: Is it sideways, upward, or downward?
It is not difficult to see that the current overall price level is enveloped by a long red candlestick, indicating a "sideways state," where bulls and bears are continuously consuming each other.
At the same time, it can be observed that during December 4, there was an attempt to break through the opening price of the first fully naked candlestick, which failed.

Step ②: Since it is sideways, what resistance levels are constraining it?
The overall sideways range falls within the range of the long red candlestick, being enveloped by it.
Local small-range resistance is established through some special candlesticks:
Observe the candlesticks and draw a horizontal line that touches as many points as possible, representing that this price level has been tested multiple times and formed resistance, which is the "closing price of candlestick 2" (draw a horizontal line at its closing price, and you will find that many subsequent points accurately fall at this price level, proving that this special price level has resistance) and the "opening price of candlestick 3."
The area between these two price levels is our small resistance range within the sideways range.
Drawing lines requires continuous attempts, with the principle: many points make a line.

Possible trading suggestions:
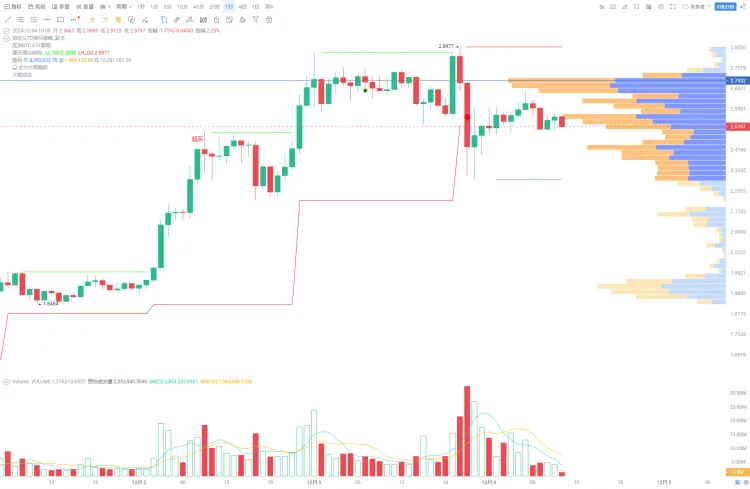
Sideways observation: The pressure from the long red candlestick is significant, and combined with AICoin's chip distribution feature, it can also be seen that the resistance level is at point 1.
Long position: Wait for a breakout of the 2-3 range with a long green candlestick before placing a long order, and set your own take profit and stop loss.
Short position: Place a short order after hitting point 1 to profit from the sideways market, and set your own take profit and stop loss.

⚠ Note: The above trading suggestions do not constitute investment advice and do not recommend any specific cryptocurrency. Please trade rationally within your capabilities!
Recently, there have been many counterfeit AICoin websites. Please only recognize the ".com" domain!
I am Teacher J, see you next time!
Feel free to leave comments sharing your thoughts and opinions; it is very helpful for Teacher J!
免责声明:本文章仅代表作者个人观点,不代表本平台的立场和观点。本文章仅供信息分享,不构成对任何人的任何投资建议。用户与作者之间的任何争议,与本平台无关。如网页中刊载的文章或图片涉及侵权,请提供相关的权利证明和身份证明发送邮件到support@aicoin.com,本平台相关工作人员将会进行核查。


