On December 3rd at 16:00, the AICoin editor conducted a graphic and text sharing session on "Advanced Applications of OBV" in the [AICoin PC - Group Chat - Live Broadcast]. Below is a summary of the live broadcast content.
In response to last Monday's request from Baobao regarding indicator sharing, I will share the usage of the OBV indicator with everyone.
The content of this sharing was actually covered in an article I posted last week. I wonder if everyone has seen it: https://www.aicoin.com/zh-Hans/article/431559
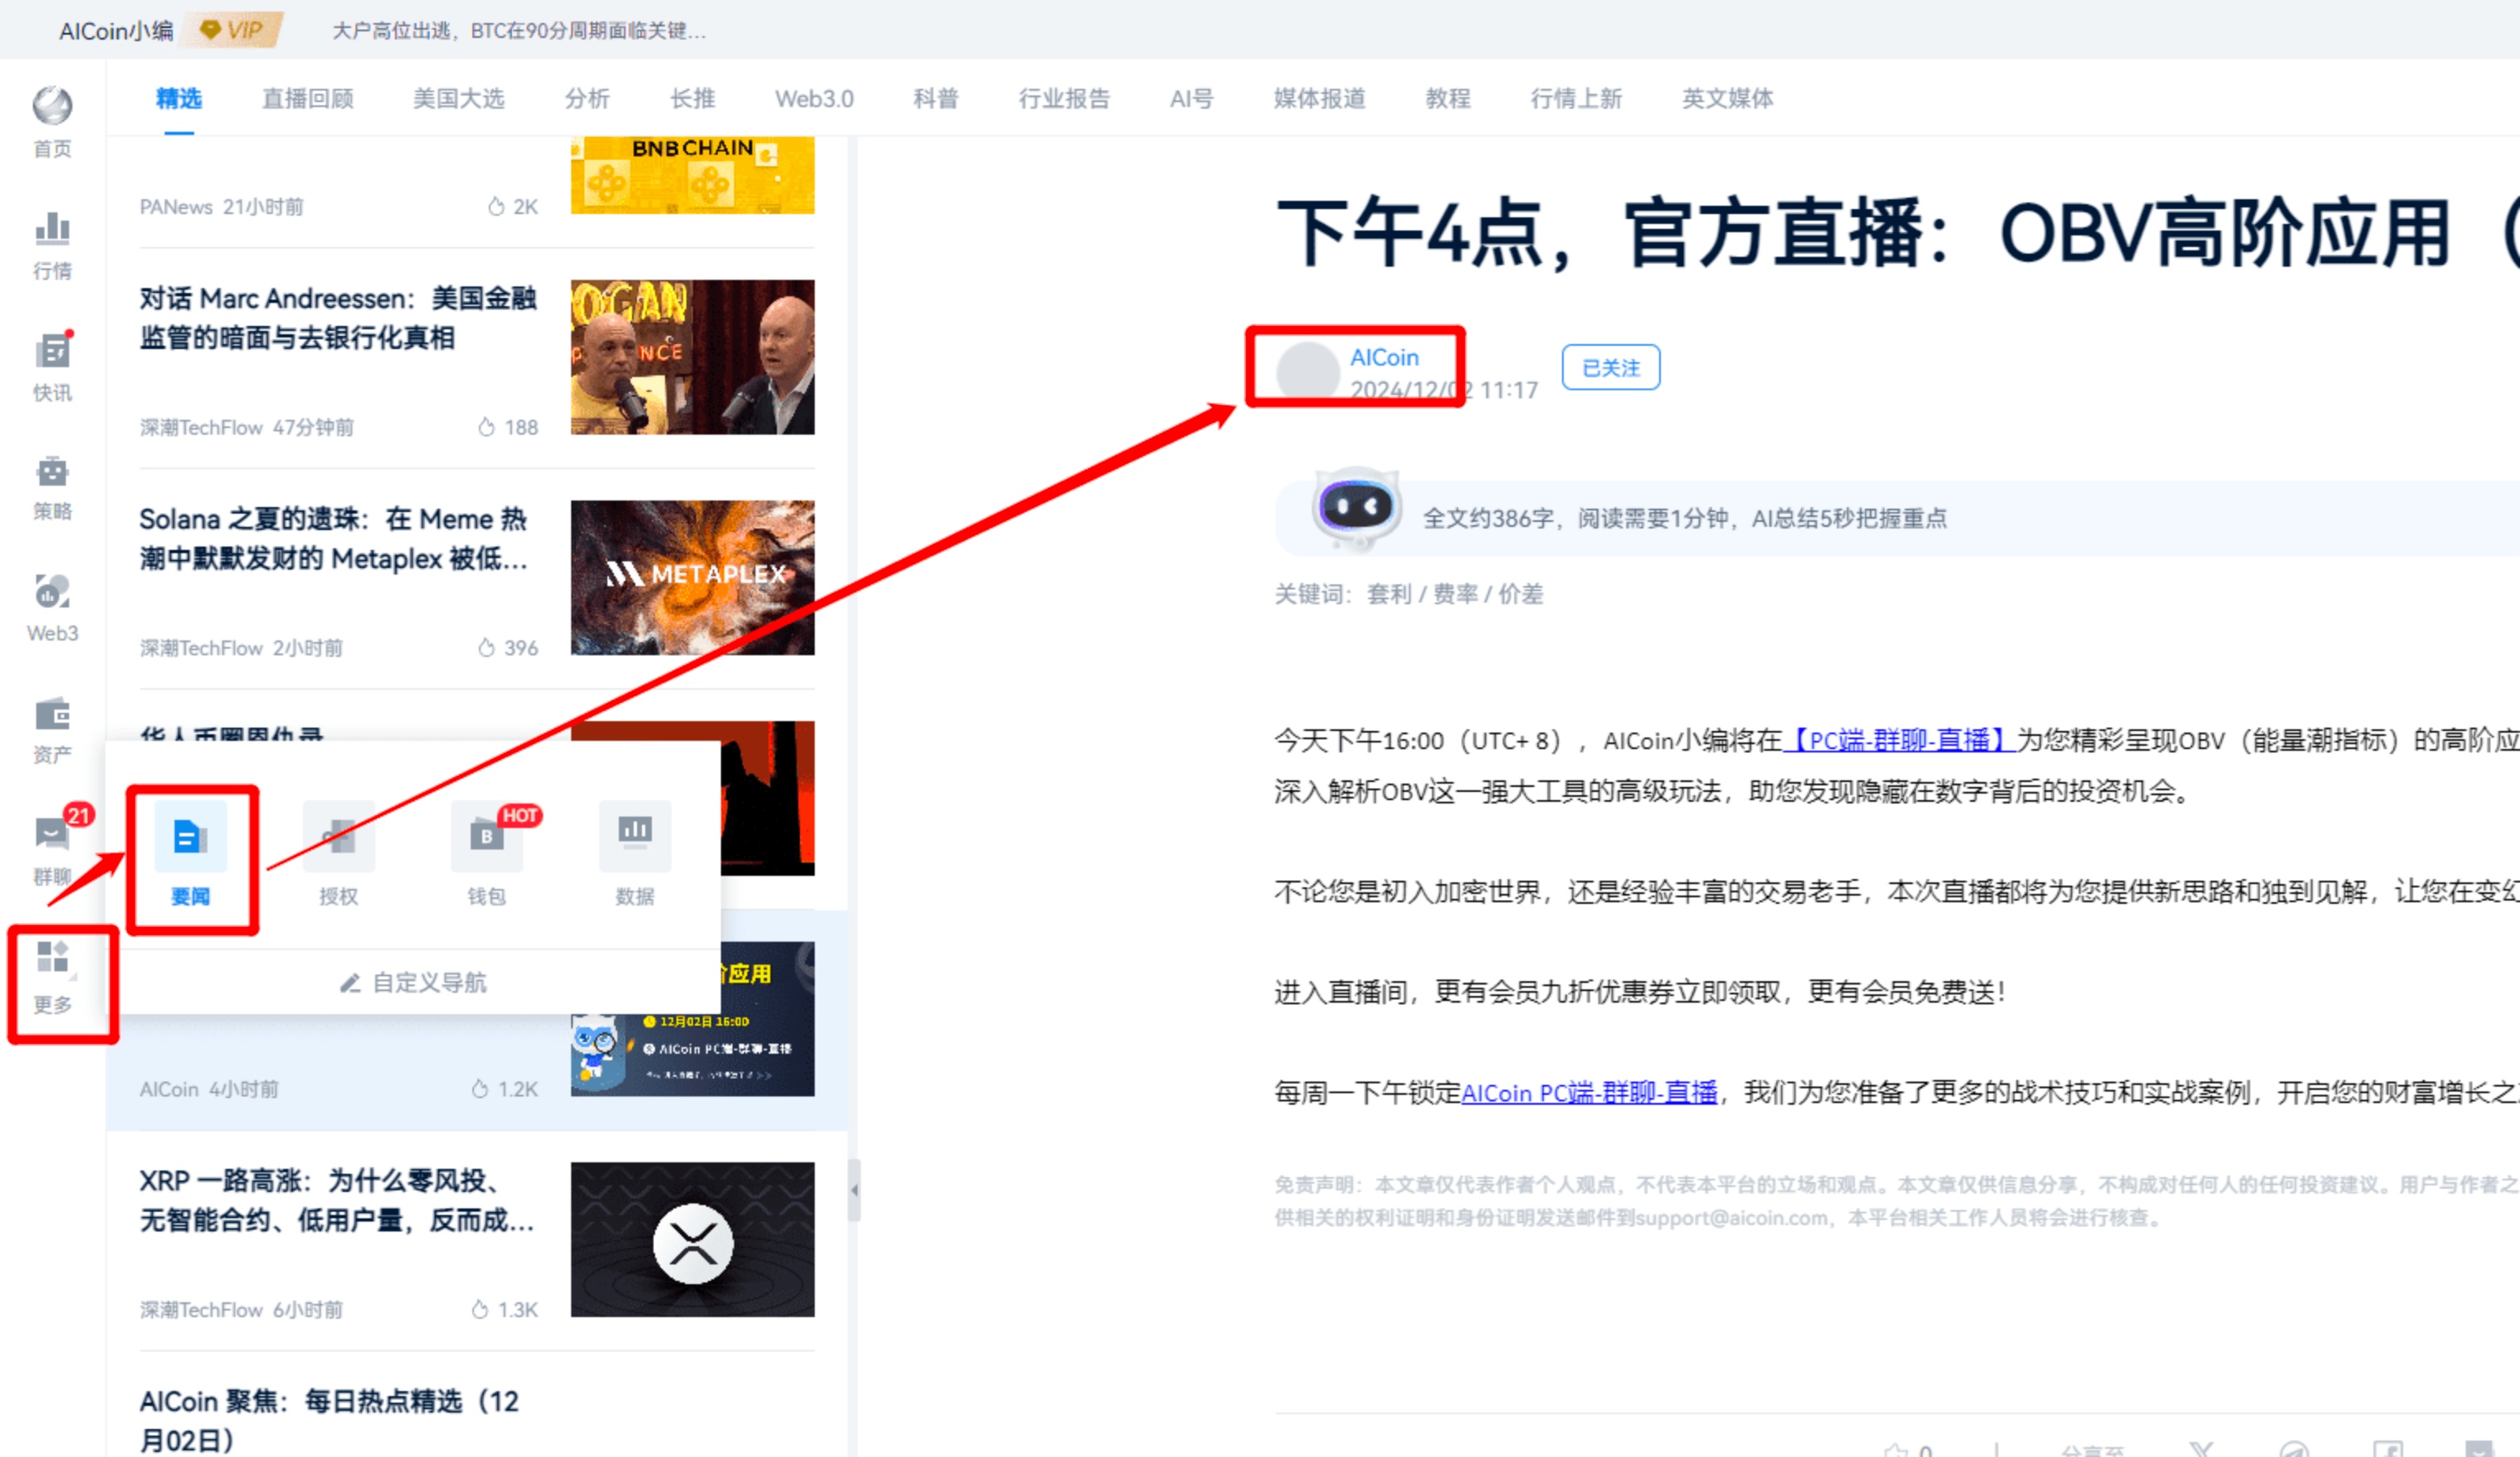
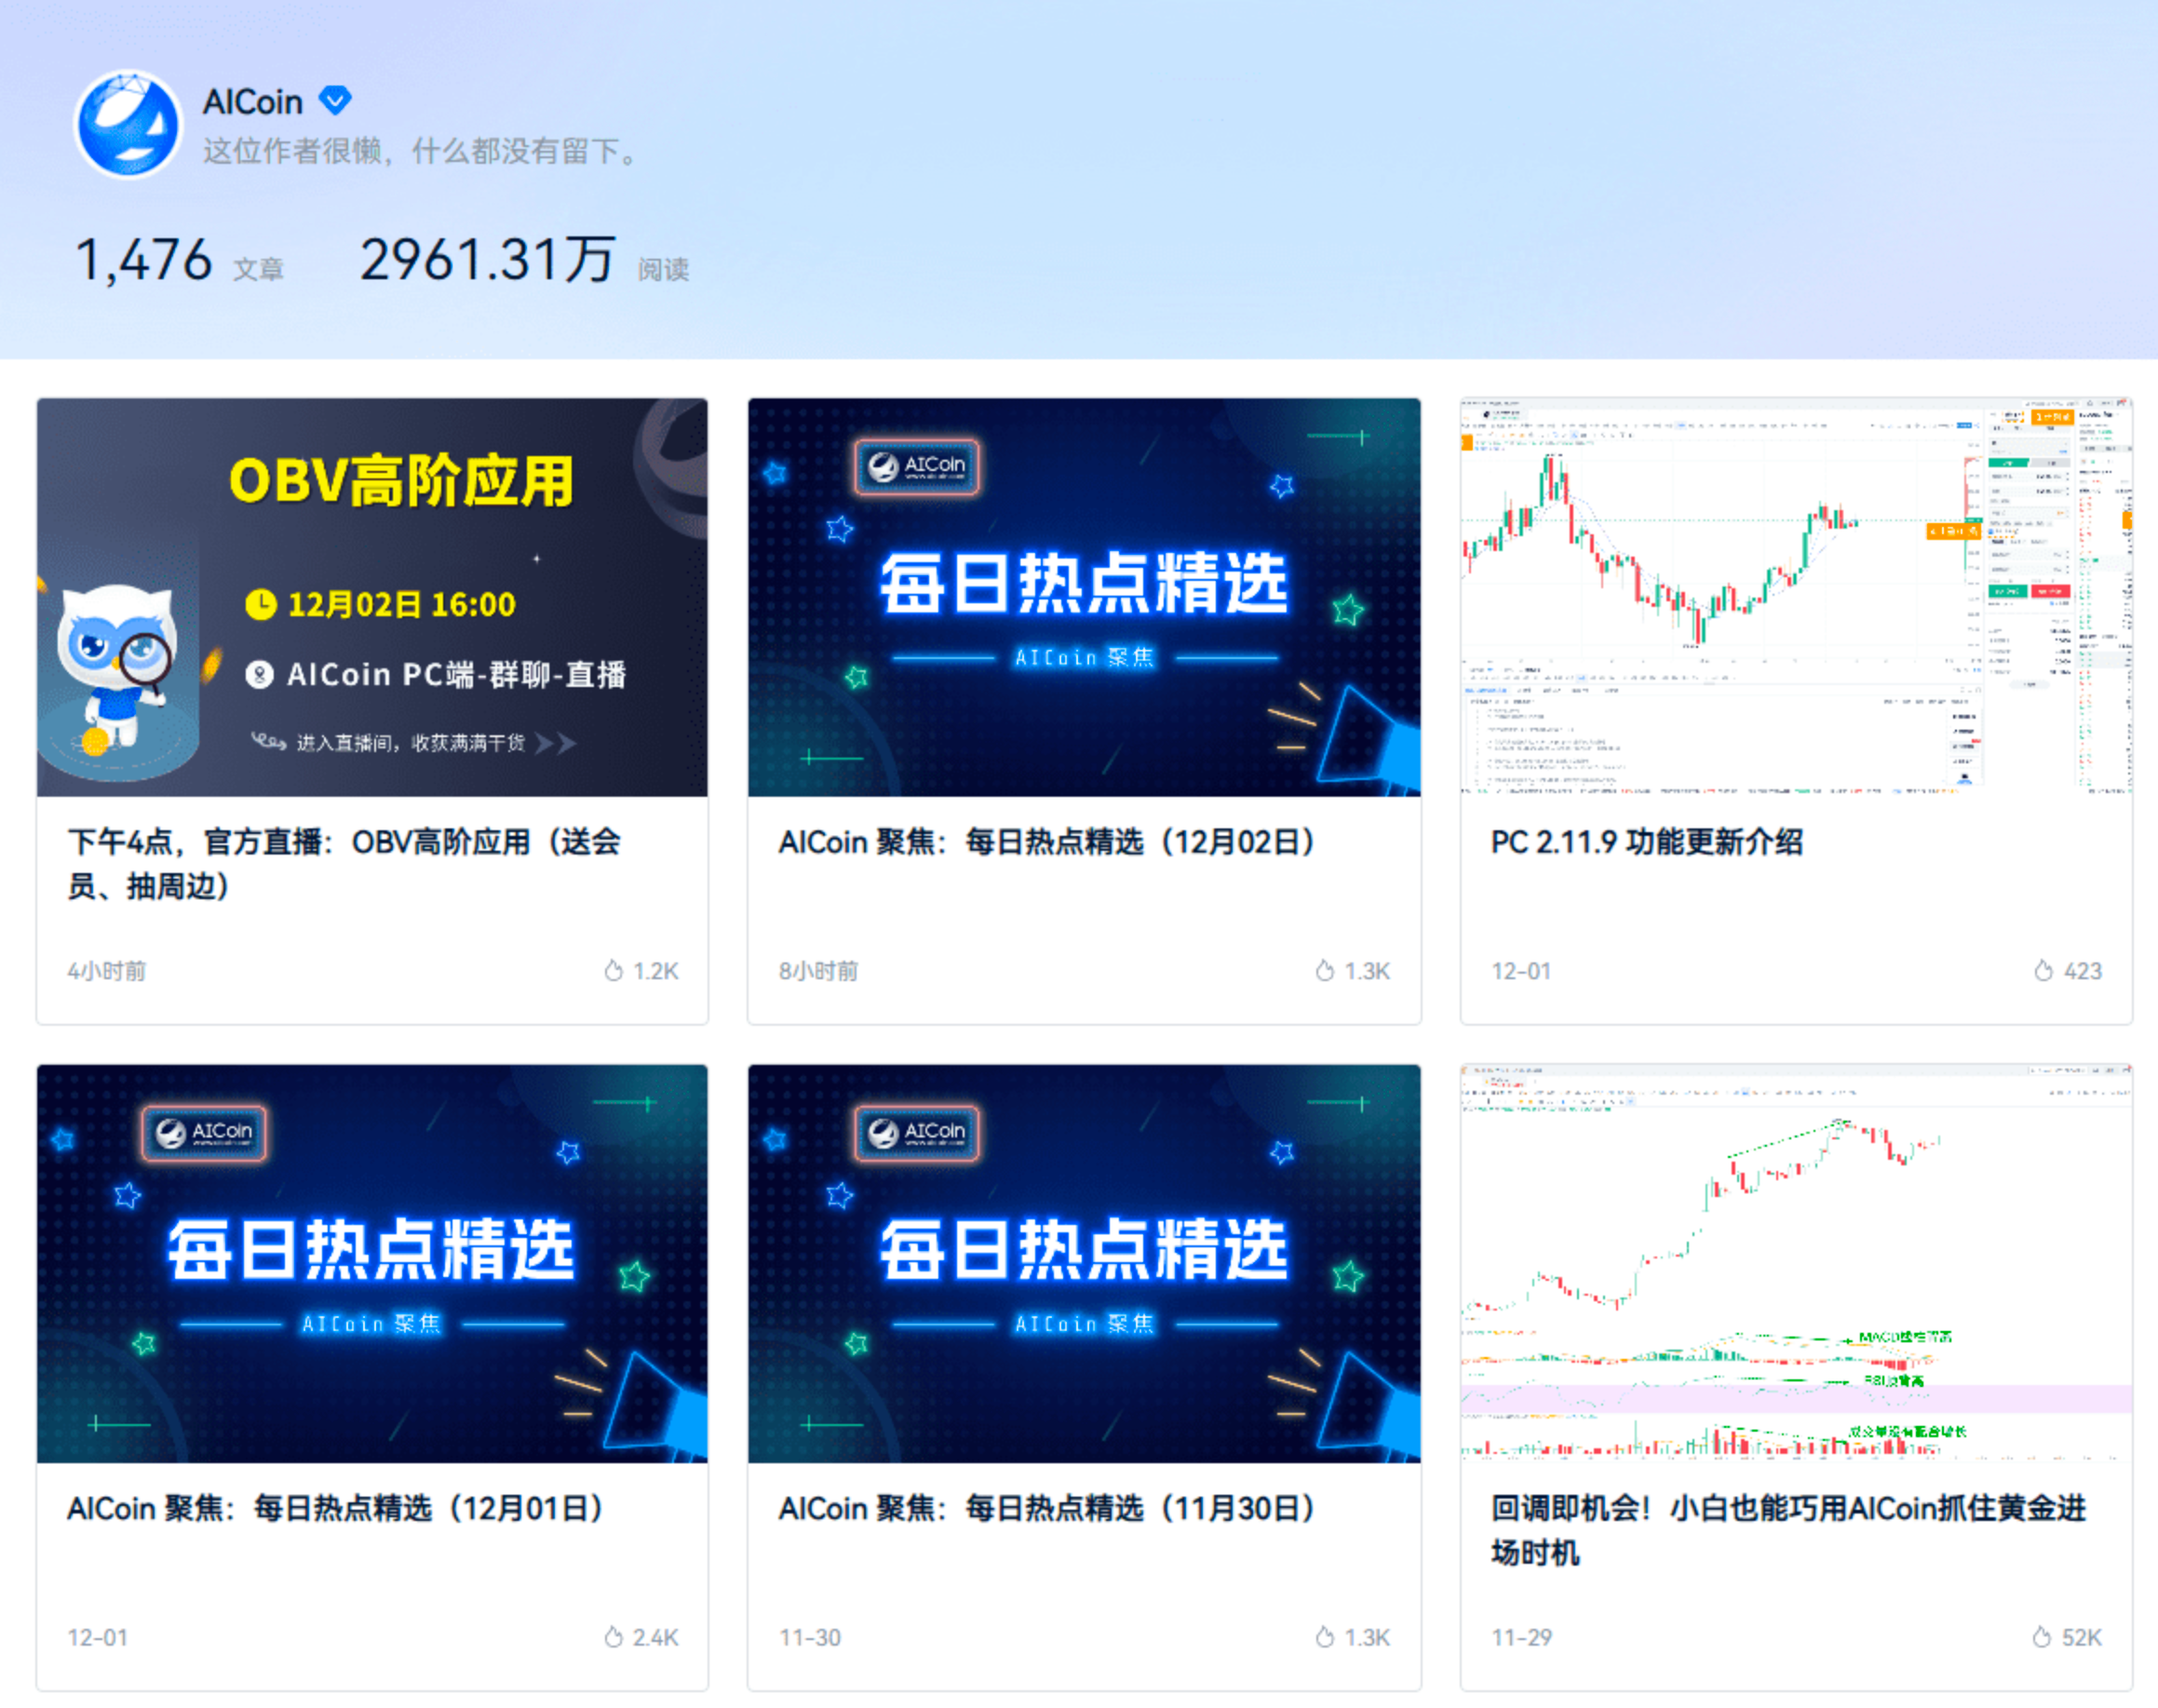
The article can be found in the news section within AICoin, and you can follow the official AICoin account!
1. Concept of OBV
OBV (On Balance Volume), the Energy Flow Indicator, was created by American investment analyst Joe Granville.
OBV is a combined indicator of trading volume and price changes. By accumulating daily buy and sell volumes, it assesses the comparative market strength and serves as a powerful auxiliary tool for price trends.
You can add it to your indicator library to check it out.
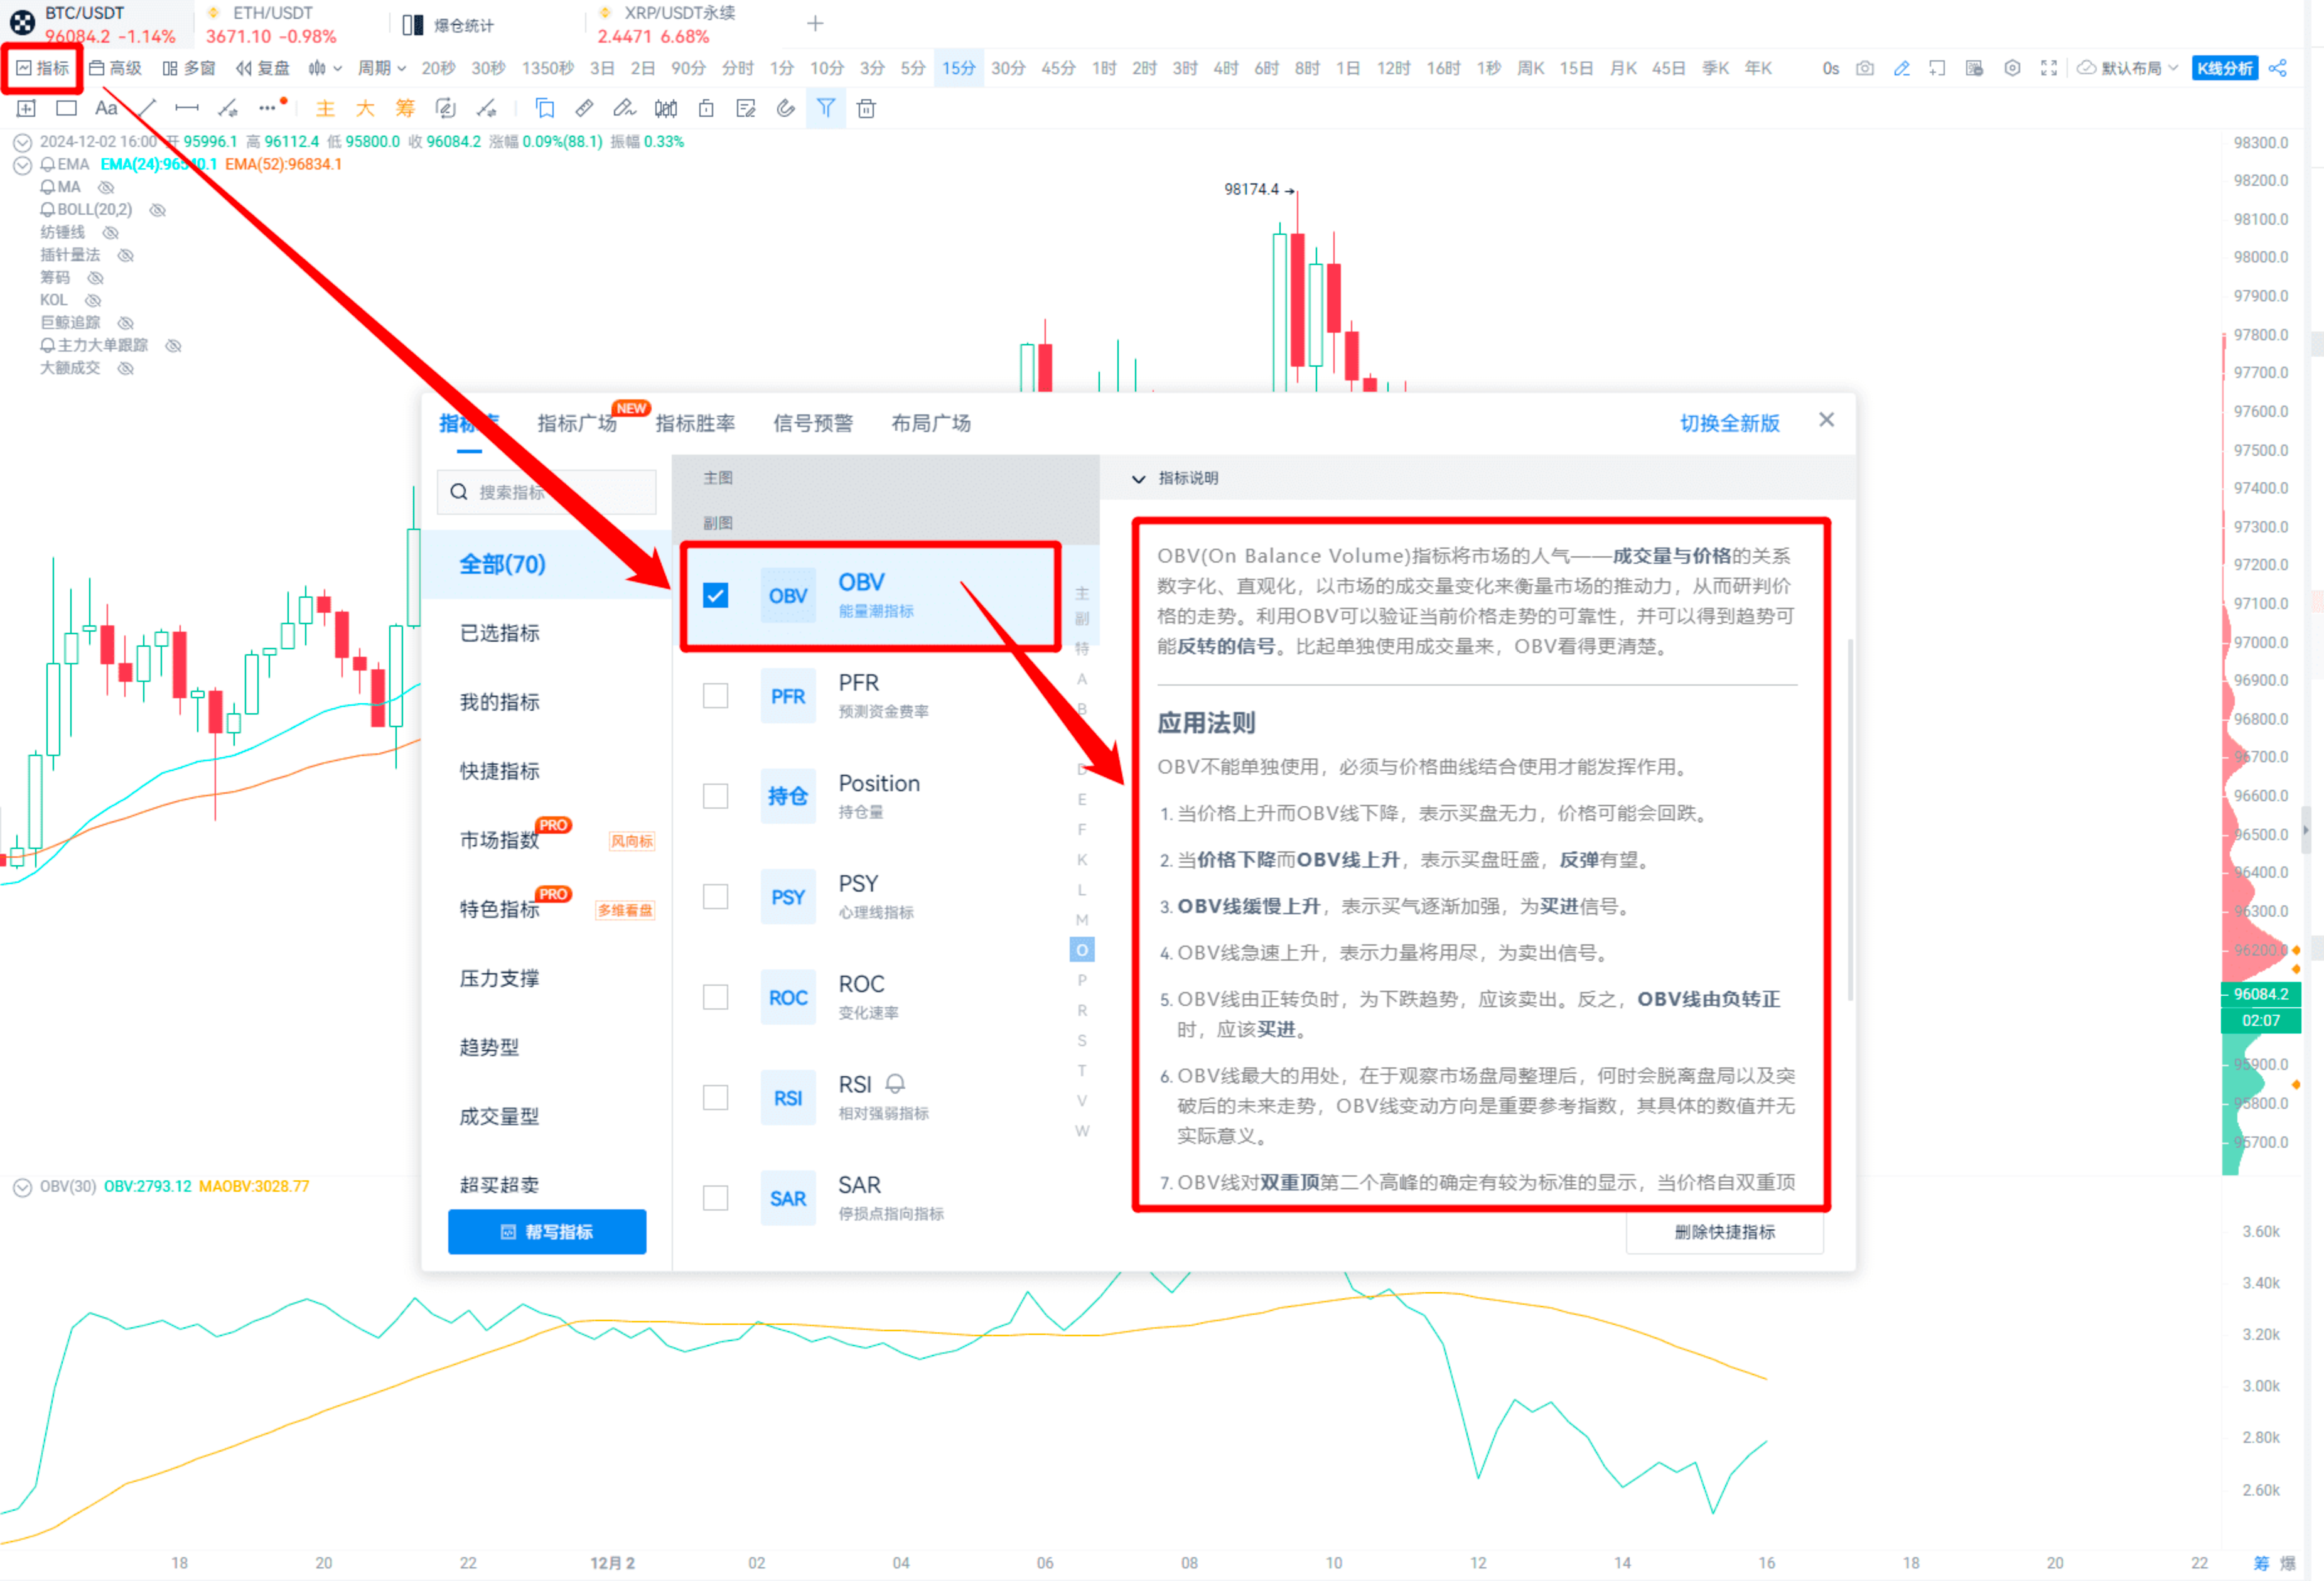
It's okay if you don't understand the probability; just know how to use it.
2. Usage of OBV
Usage 1: Judging Trends
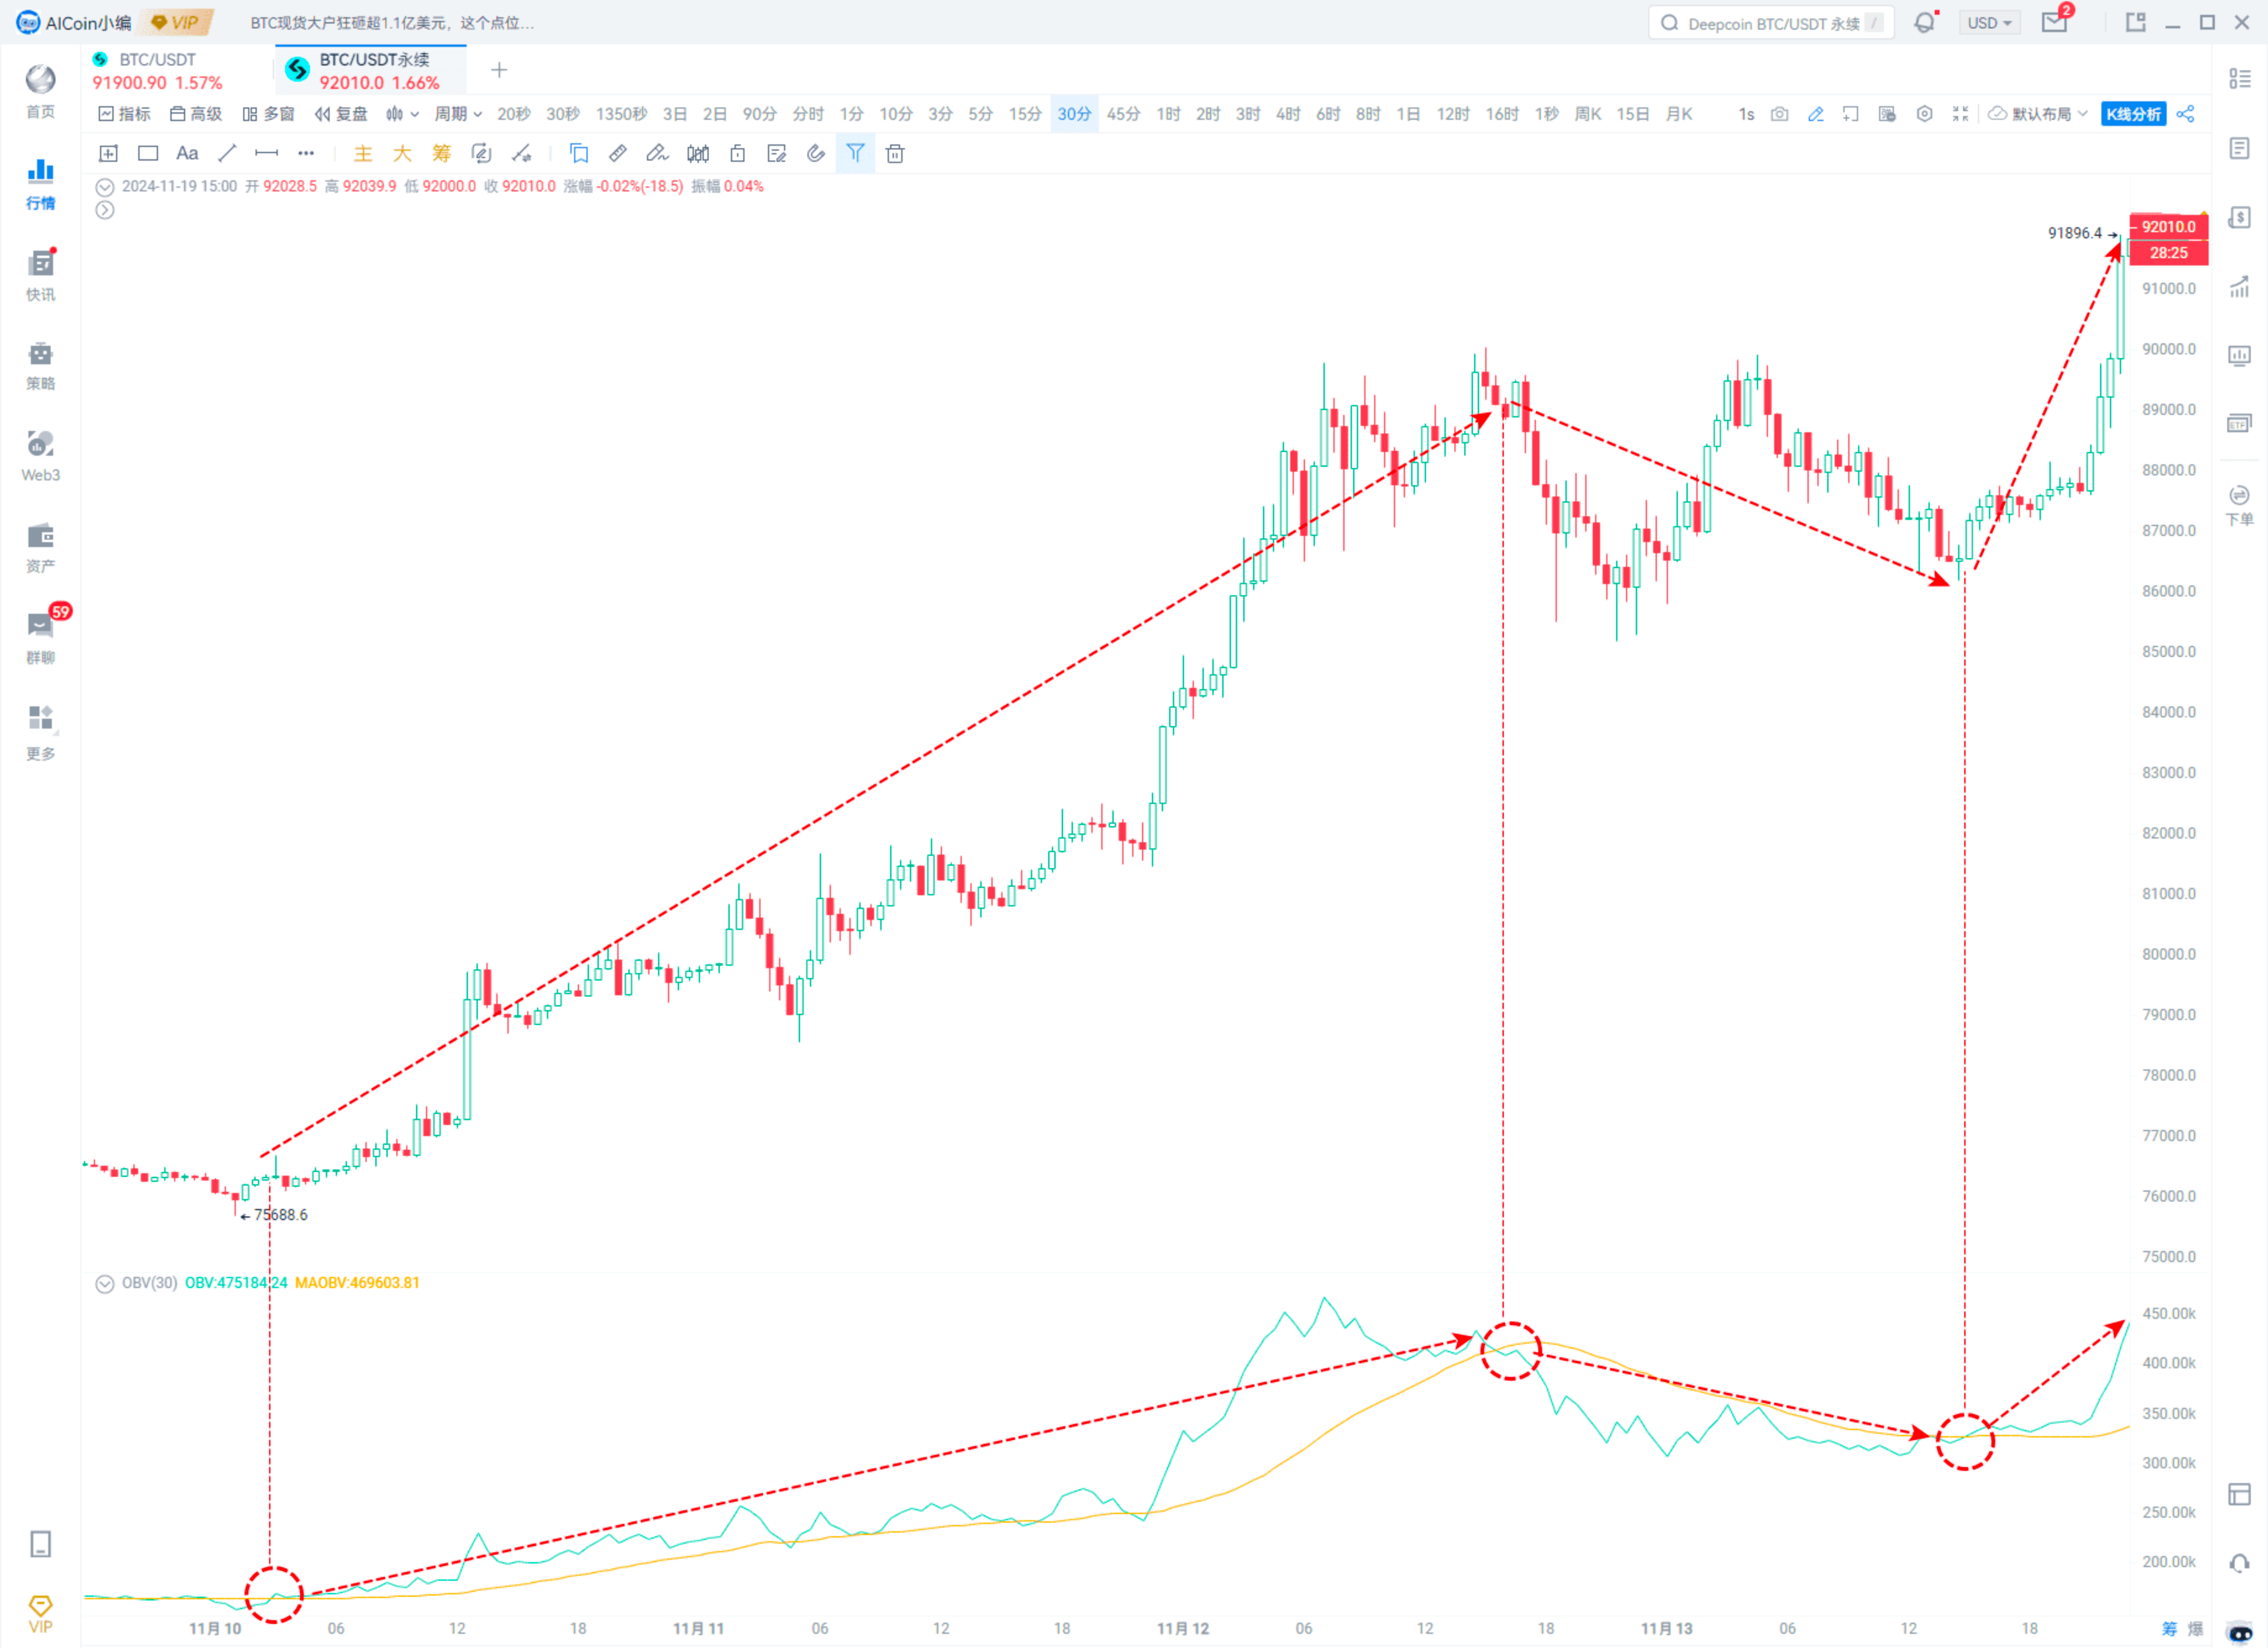
This should be combined with price judgment.
Compared to price, if both rise, it indicates a bullish trend; if both fall, it indicates a bearish trend.
You can look at this chart.
Usage 2: Judging Major Player Behavior
1. Major Players Pumping and Selling
This can be observed in a 5-minute cycle. The OBV shows a "rapid surge," generally seen as major players pumping and escaping, which is a sell signal. If it occurs at the end of a trend, the effect is more pronounced.
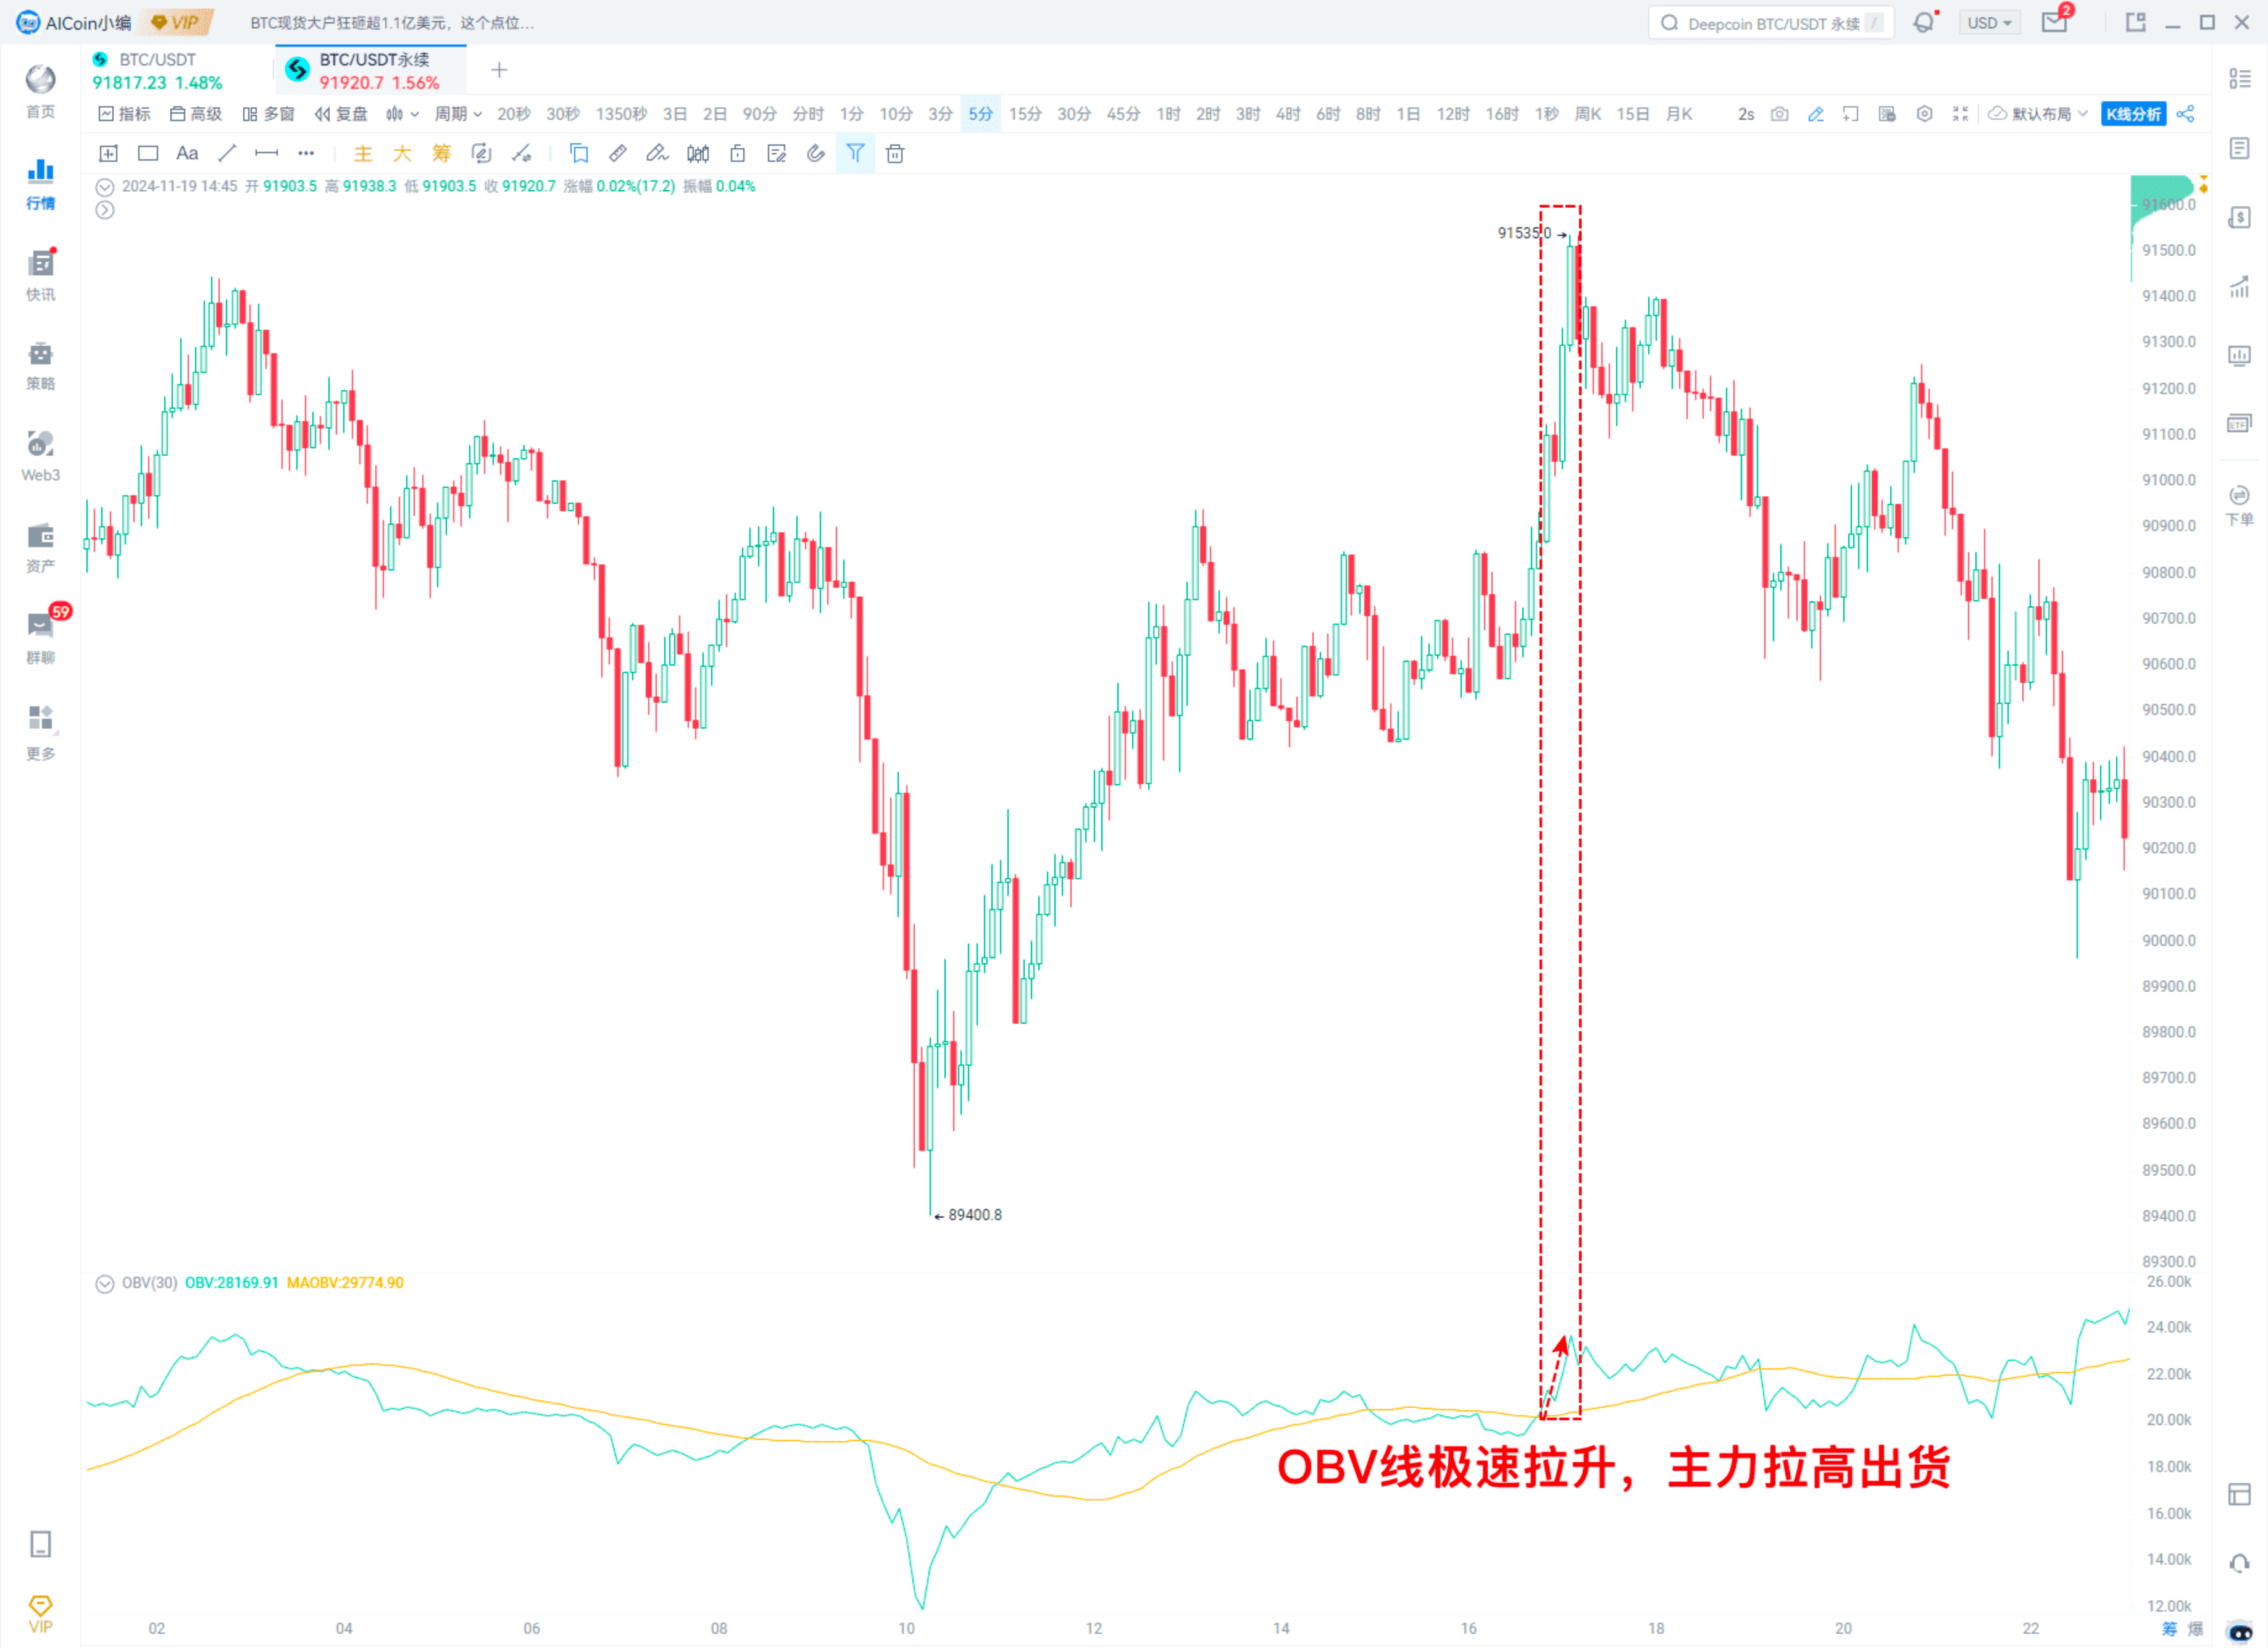
You can judge the slope; the steeper it is, the faster the surge.
2. Major Players Accumulating
Price declines, but OBV rises.
This generally indicates that major players are buying on dips, which can be seen as a stop-loss signal.
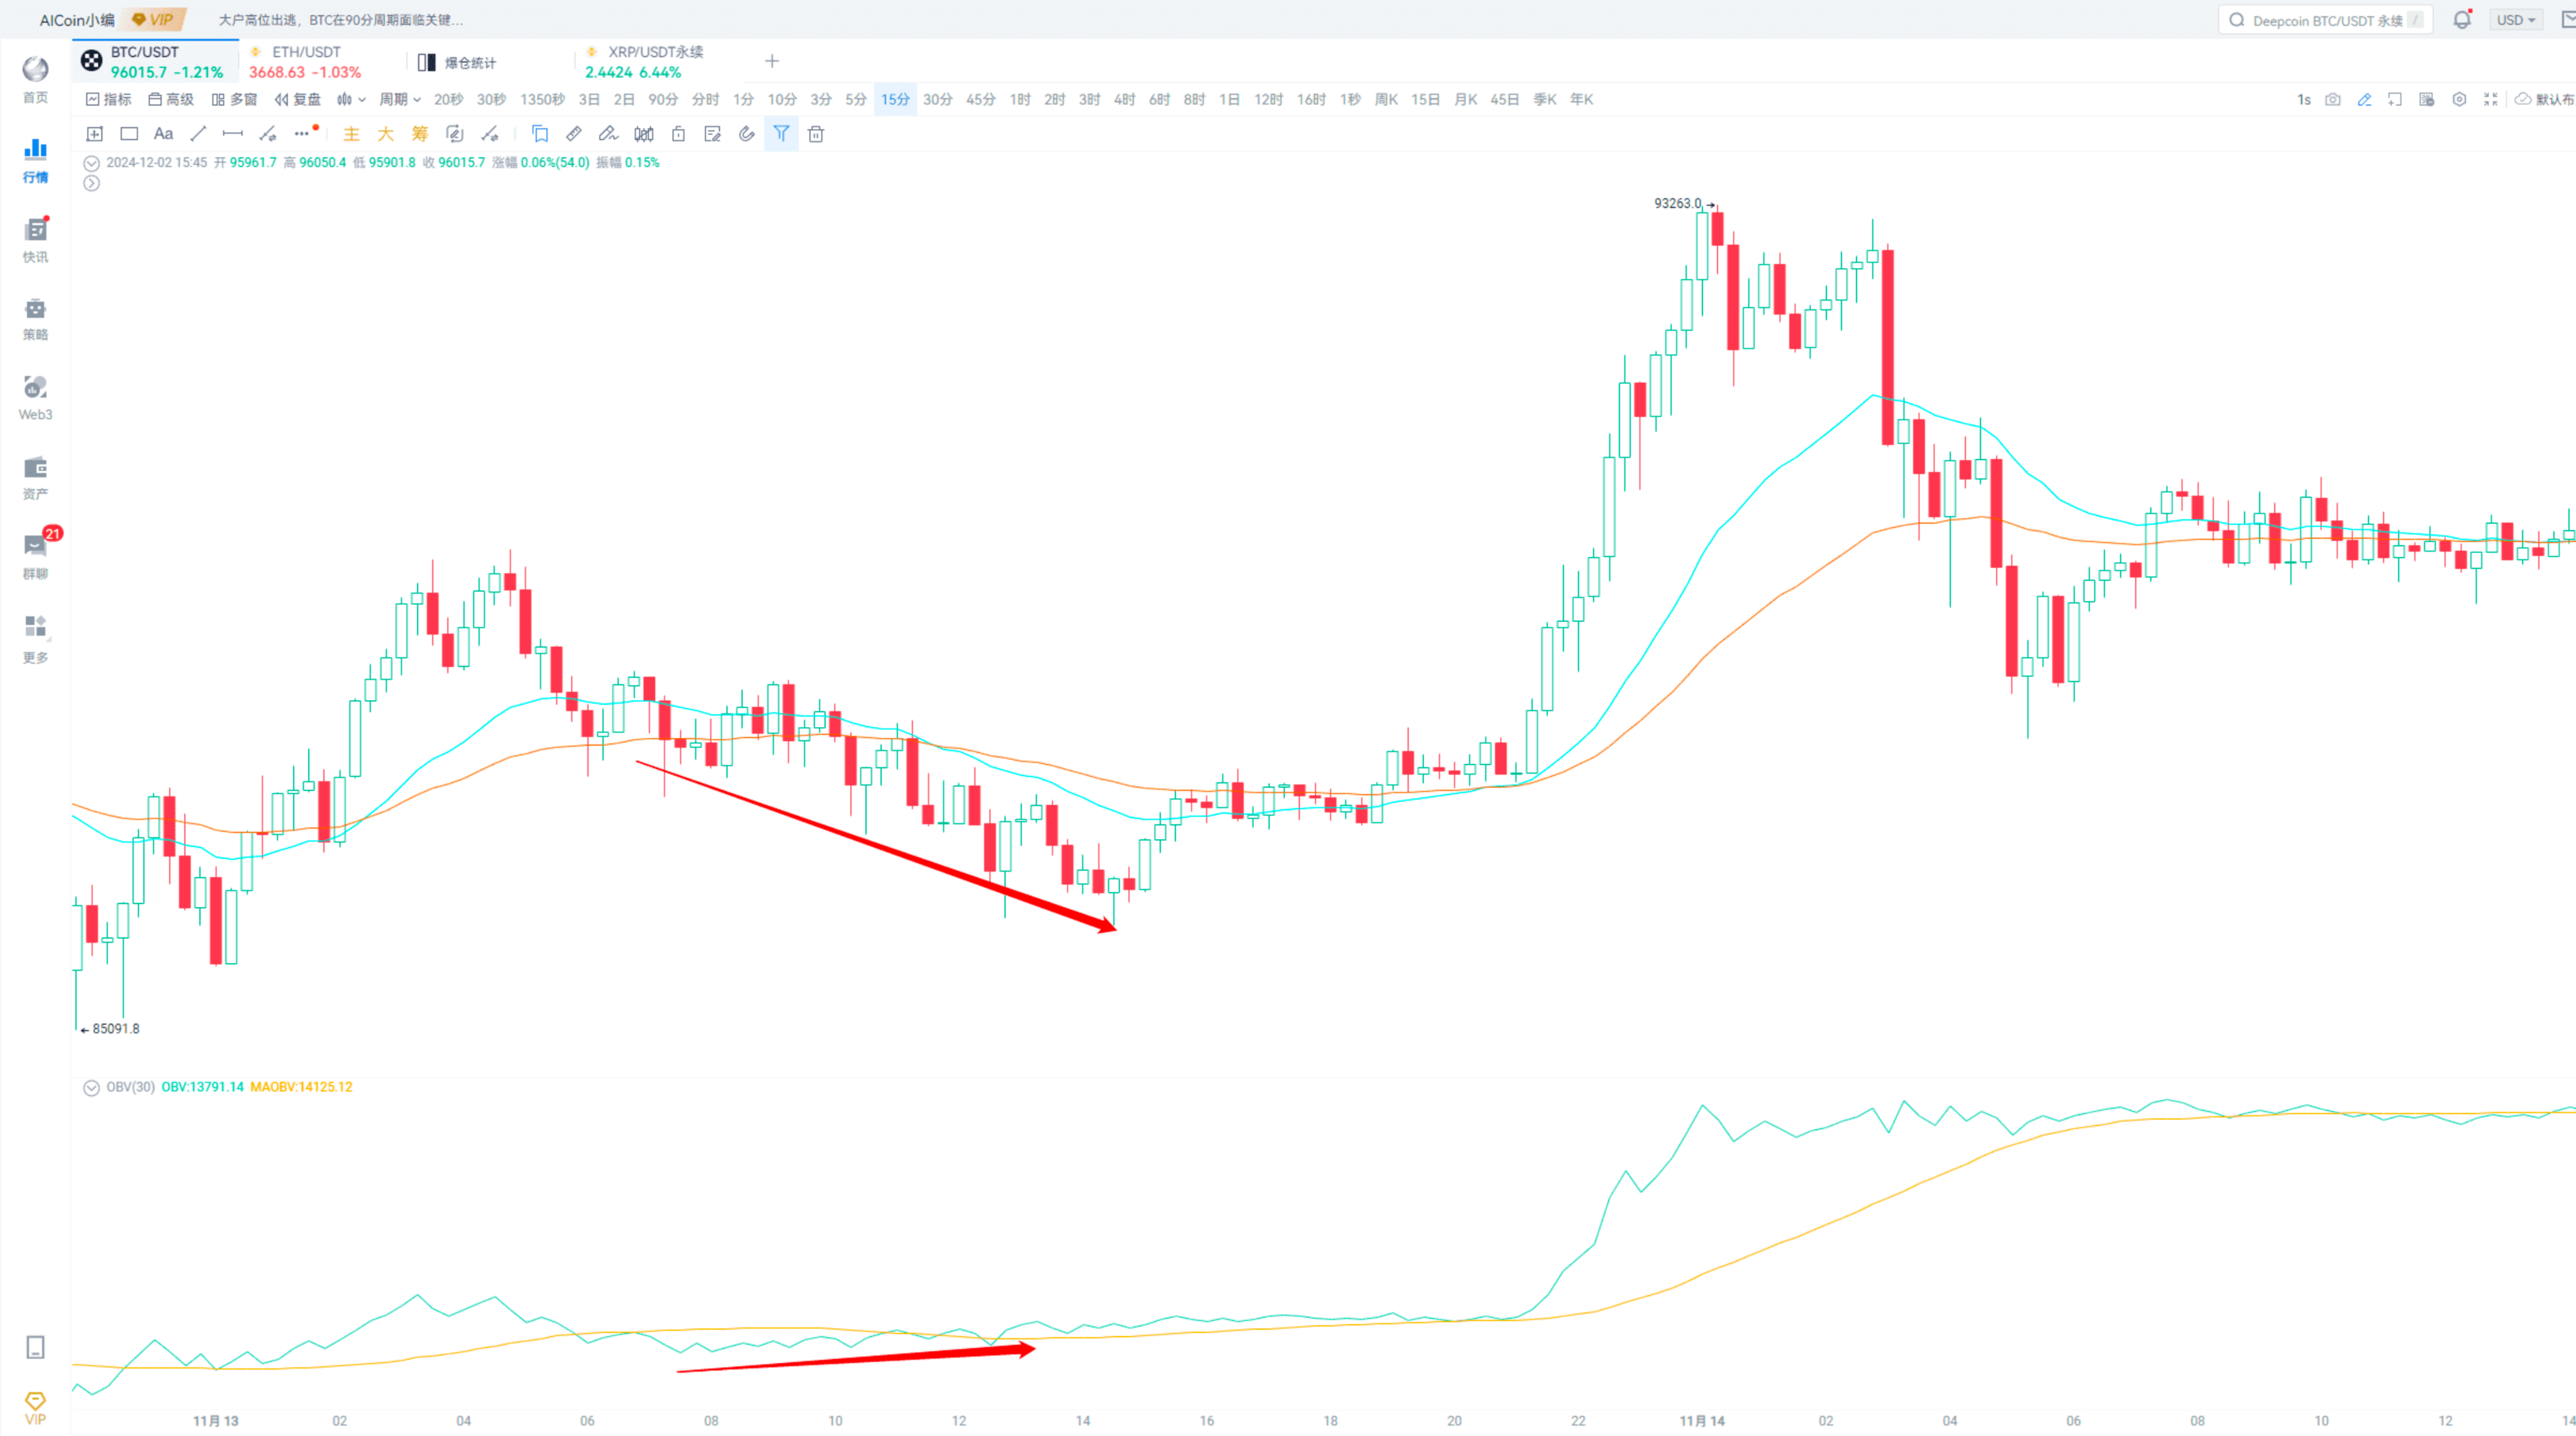
3. Major Players Selling
The performance is the opposite of major players accumulating; the OBV line declines while the price rises.
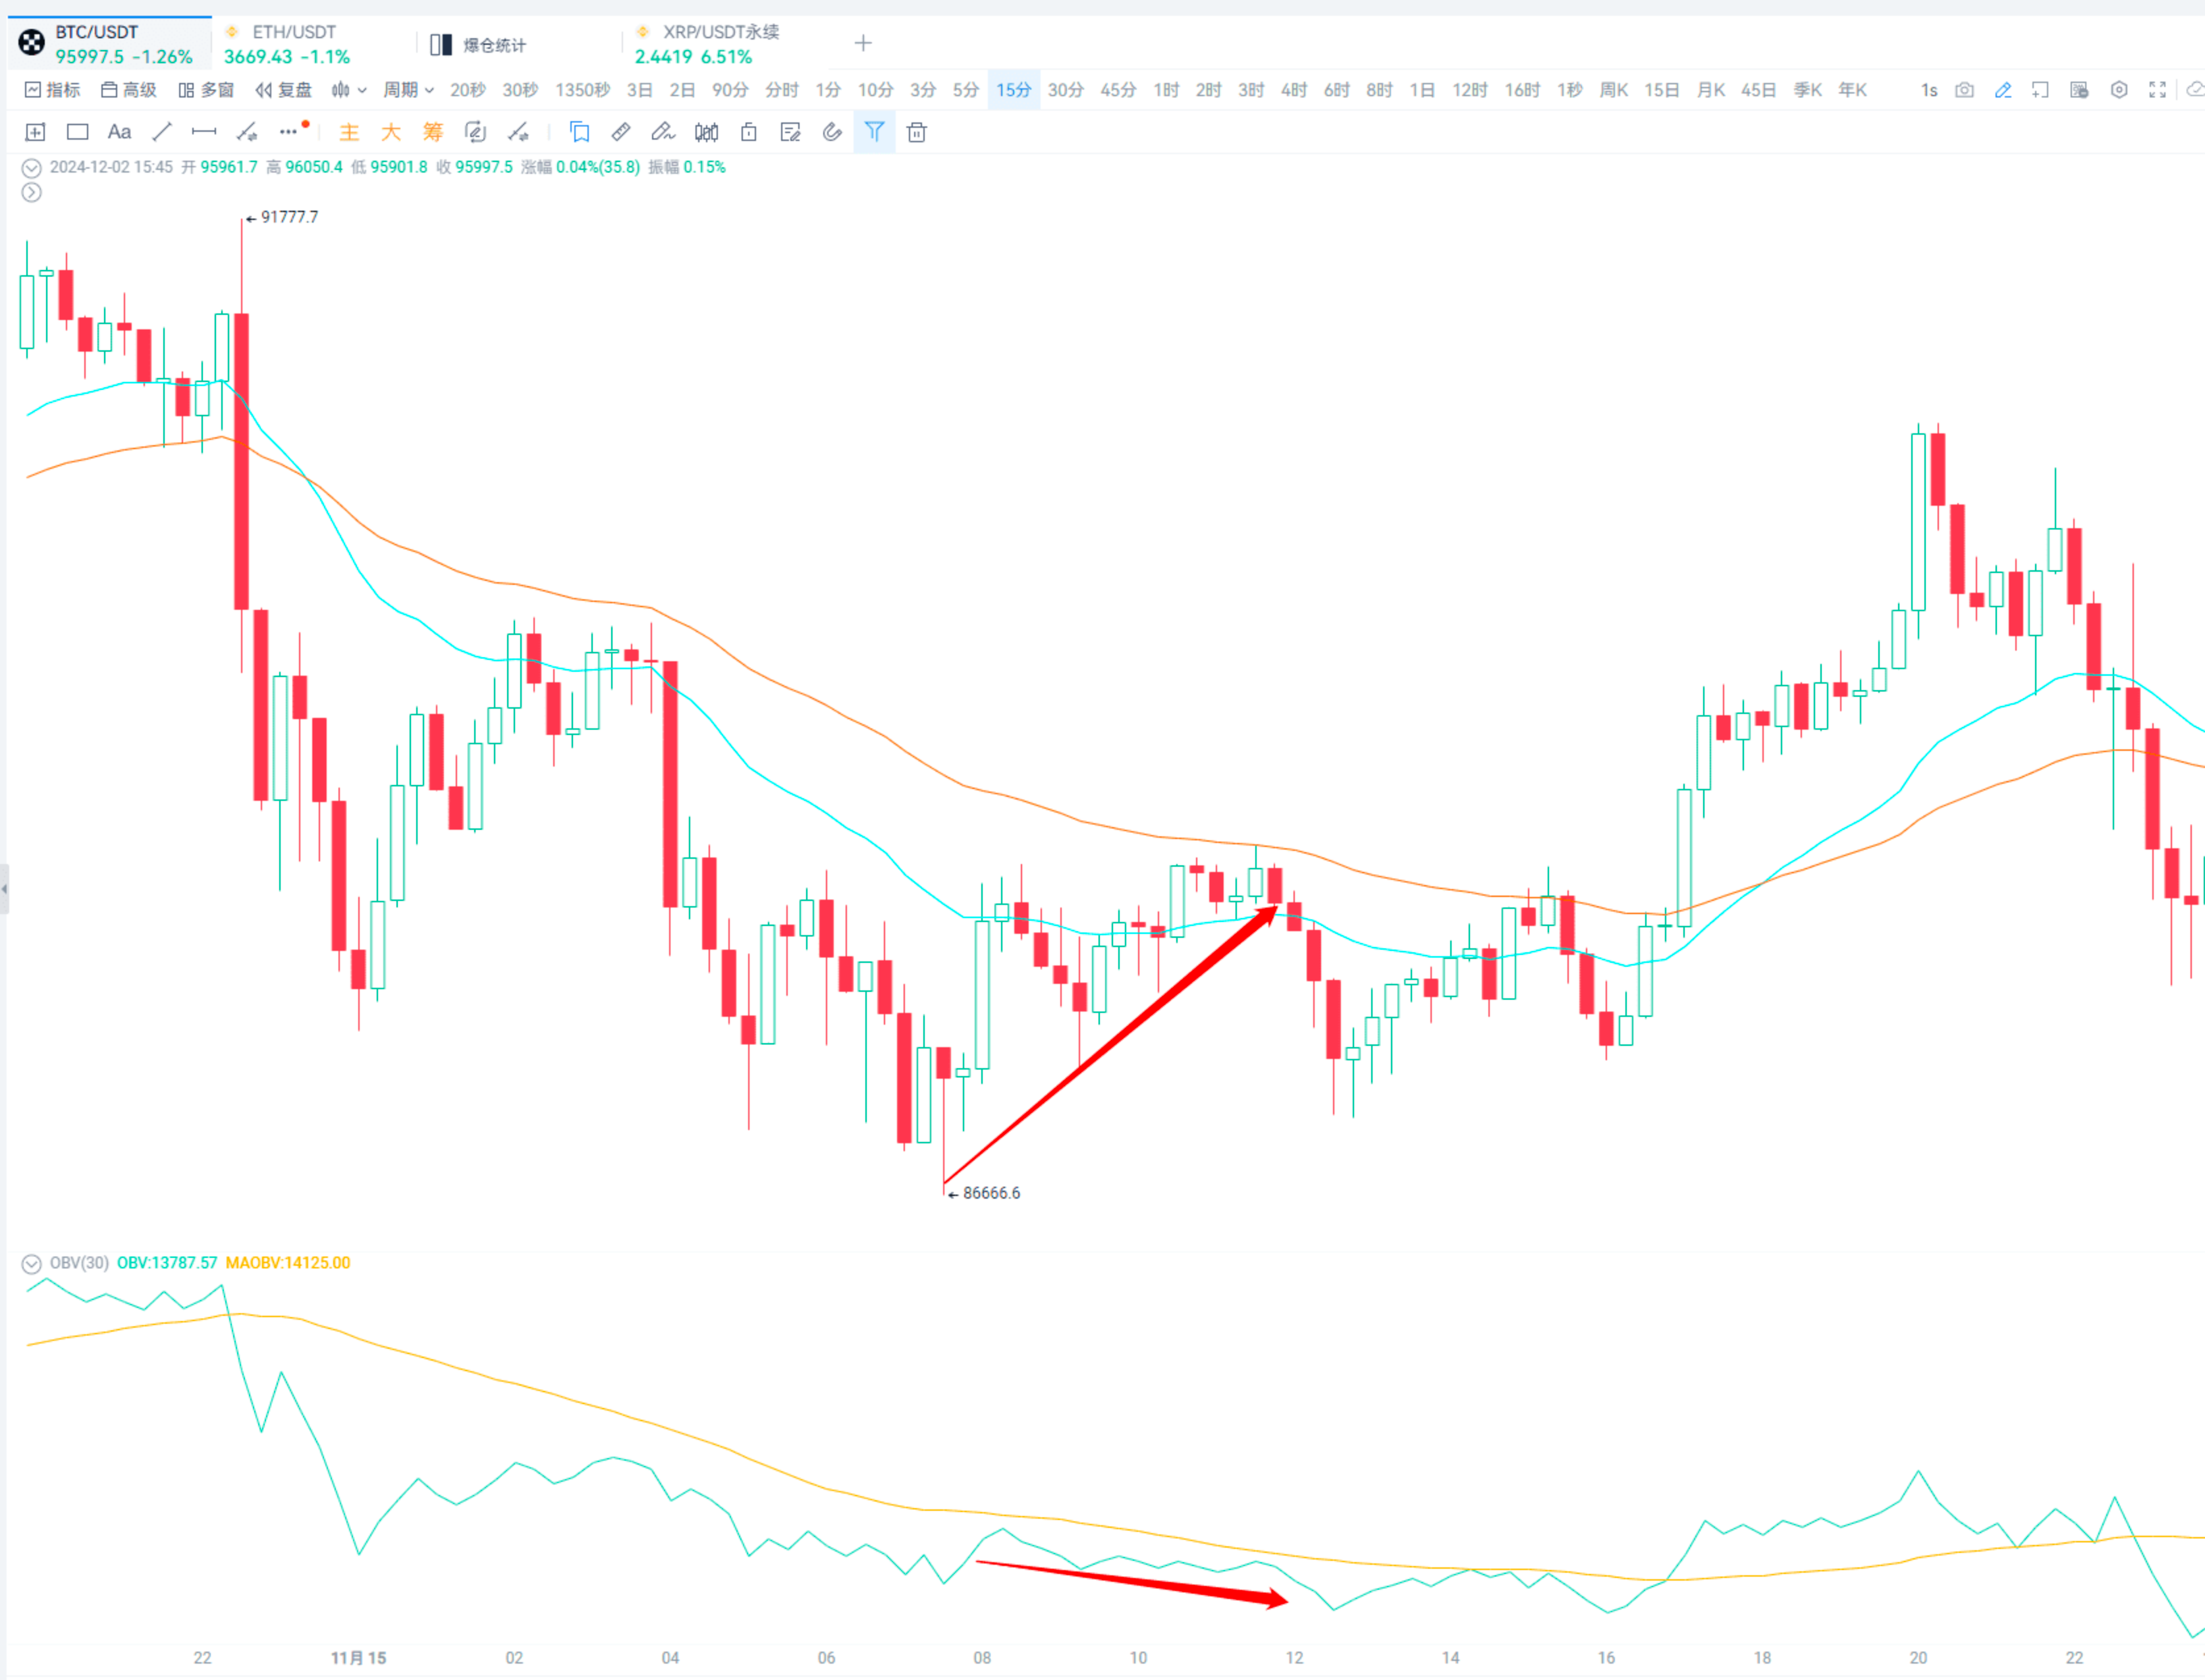
In this case, it usually indicates that major players are artificially inflating the stock price, so do not easily enter long positions.
4. Major Players Washing Out
The OBV line rises slowly, but the price fluctuates violently.
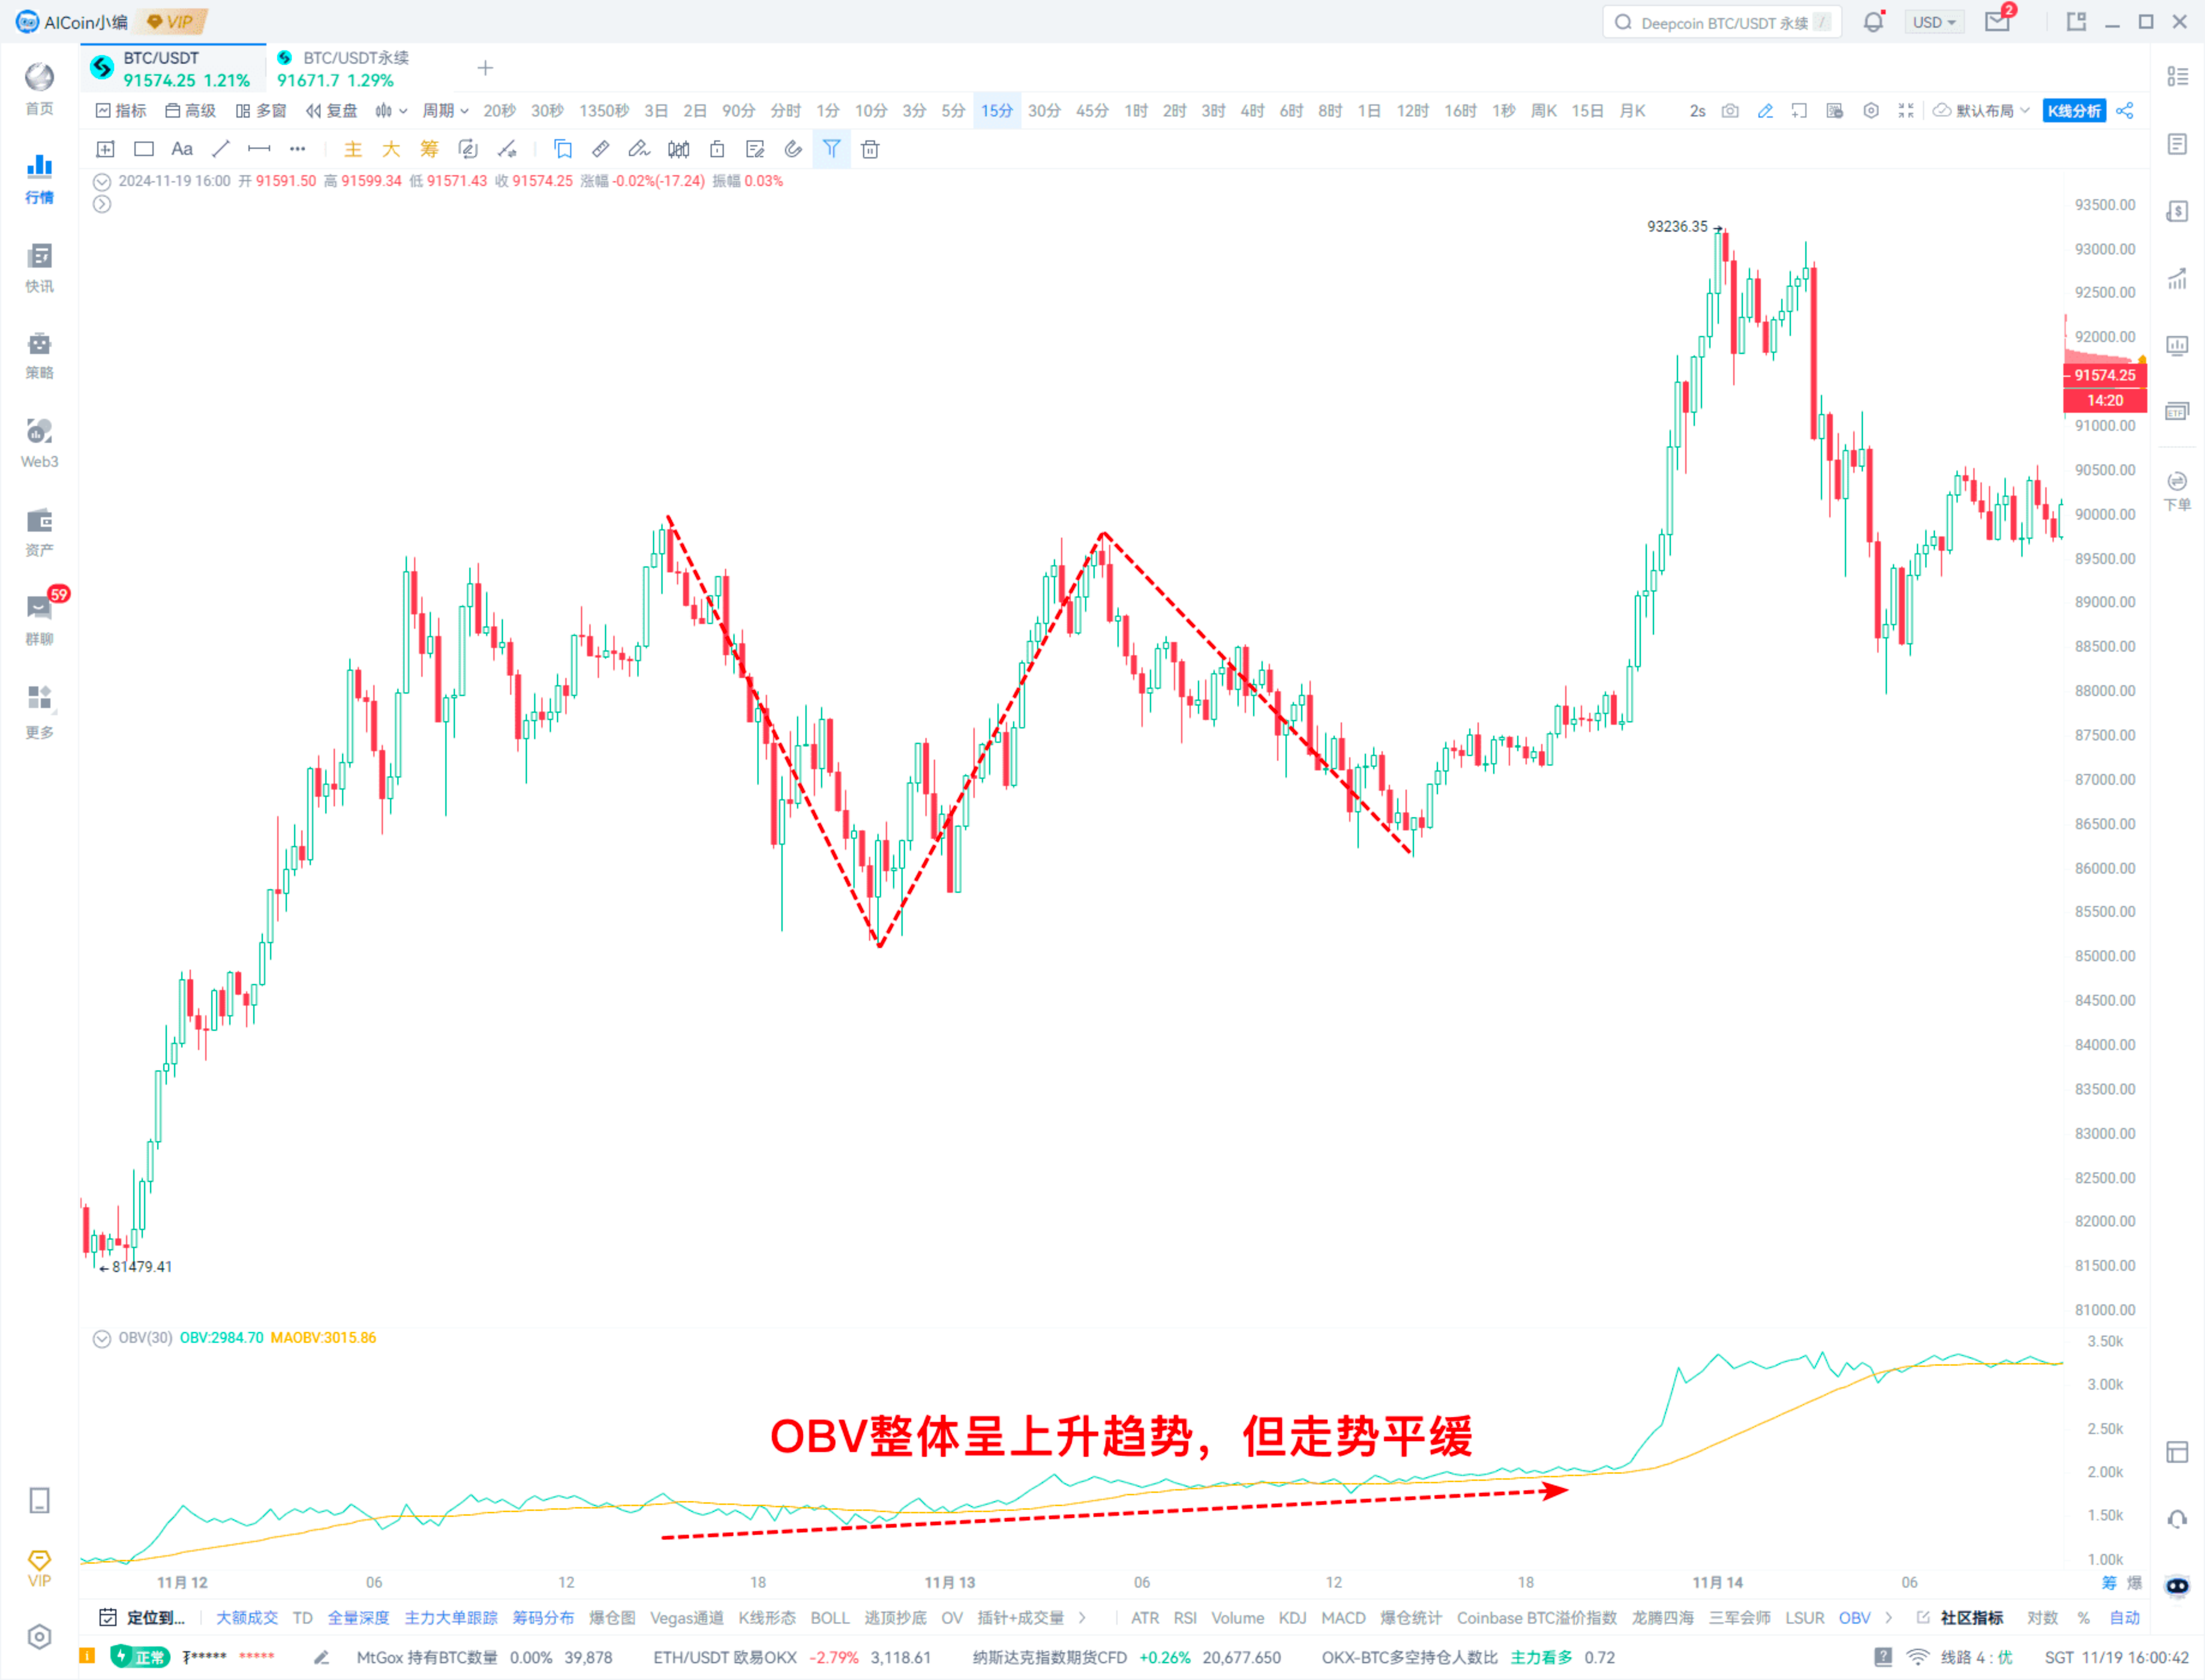
The more times it washes out, the greater the potential space later.
Usage 3: Top-Tick and Bottom-Tick Trading
This mainly combines price judgment with OBV divergence situations.
OBV bottom divergence, a bottom-buying signal: Price creates a new low, while OBV fails to create a new low simultaneously.
OBV top divergence, a top-selling signal: Price creates a new high, while OBV fails to create a new high simultaneously.
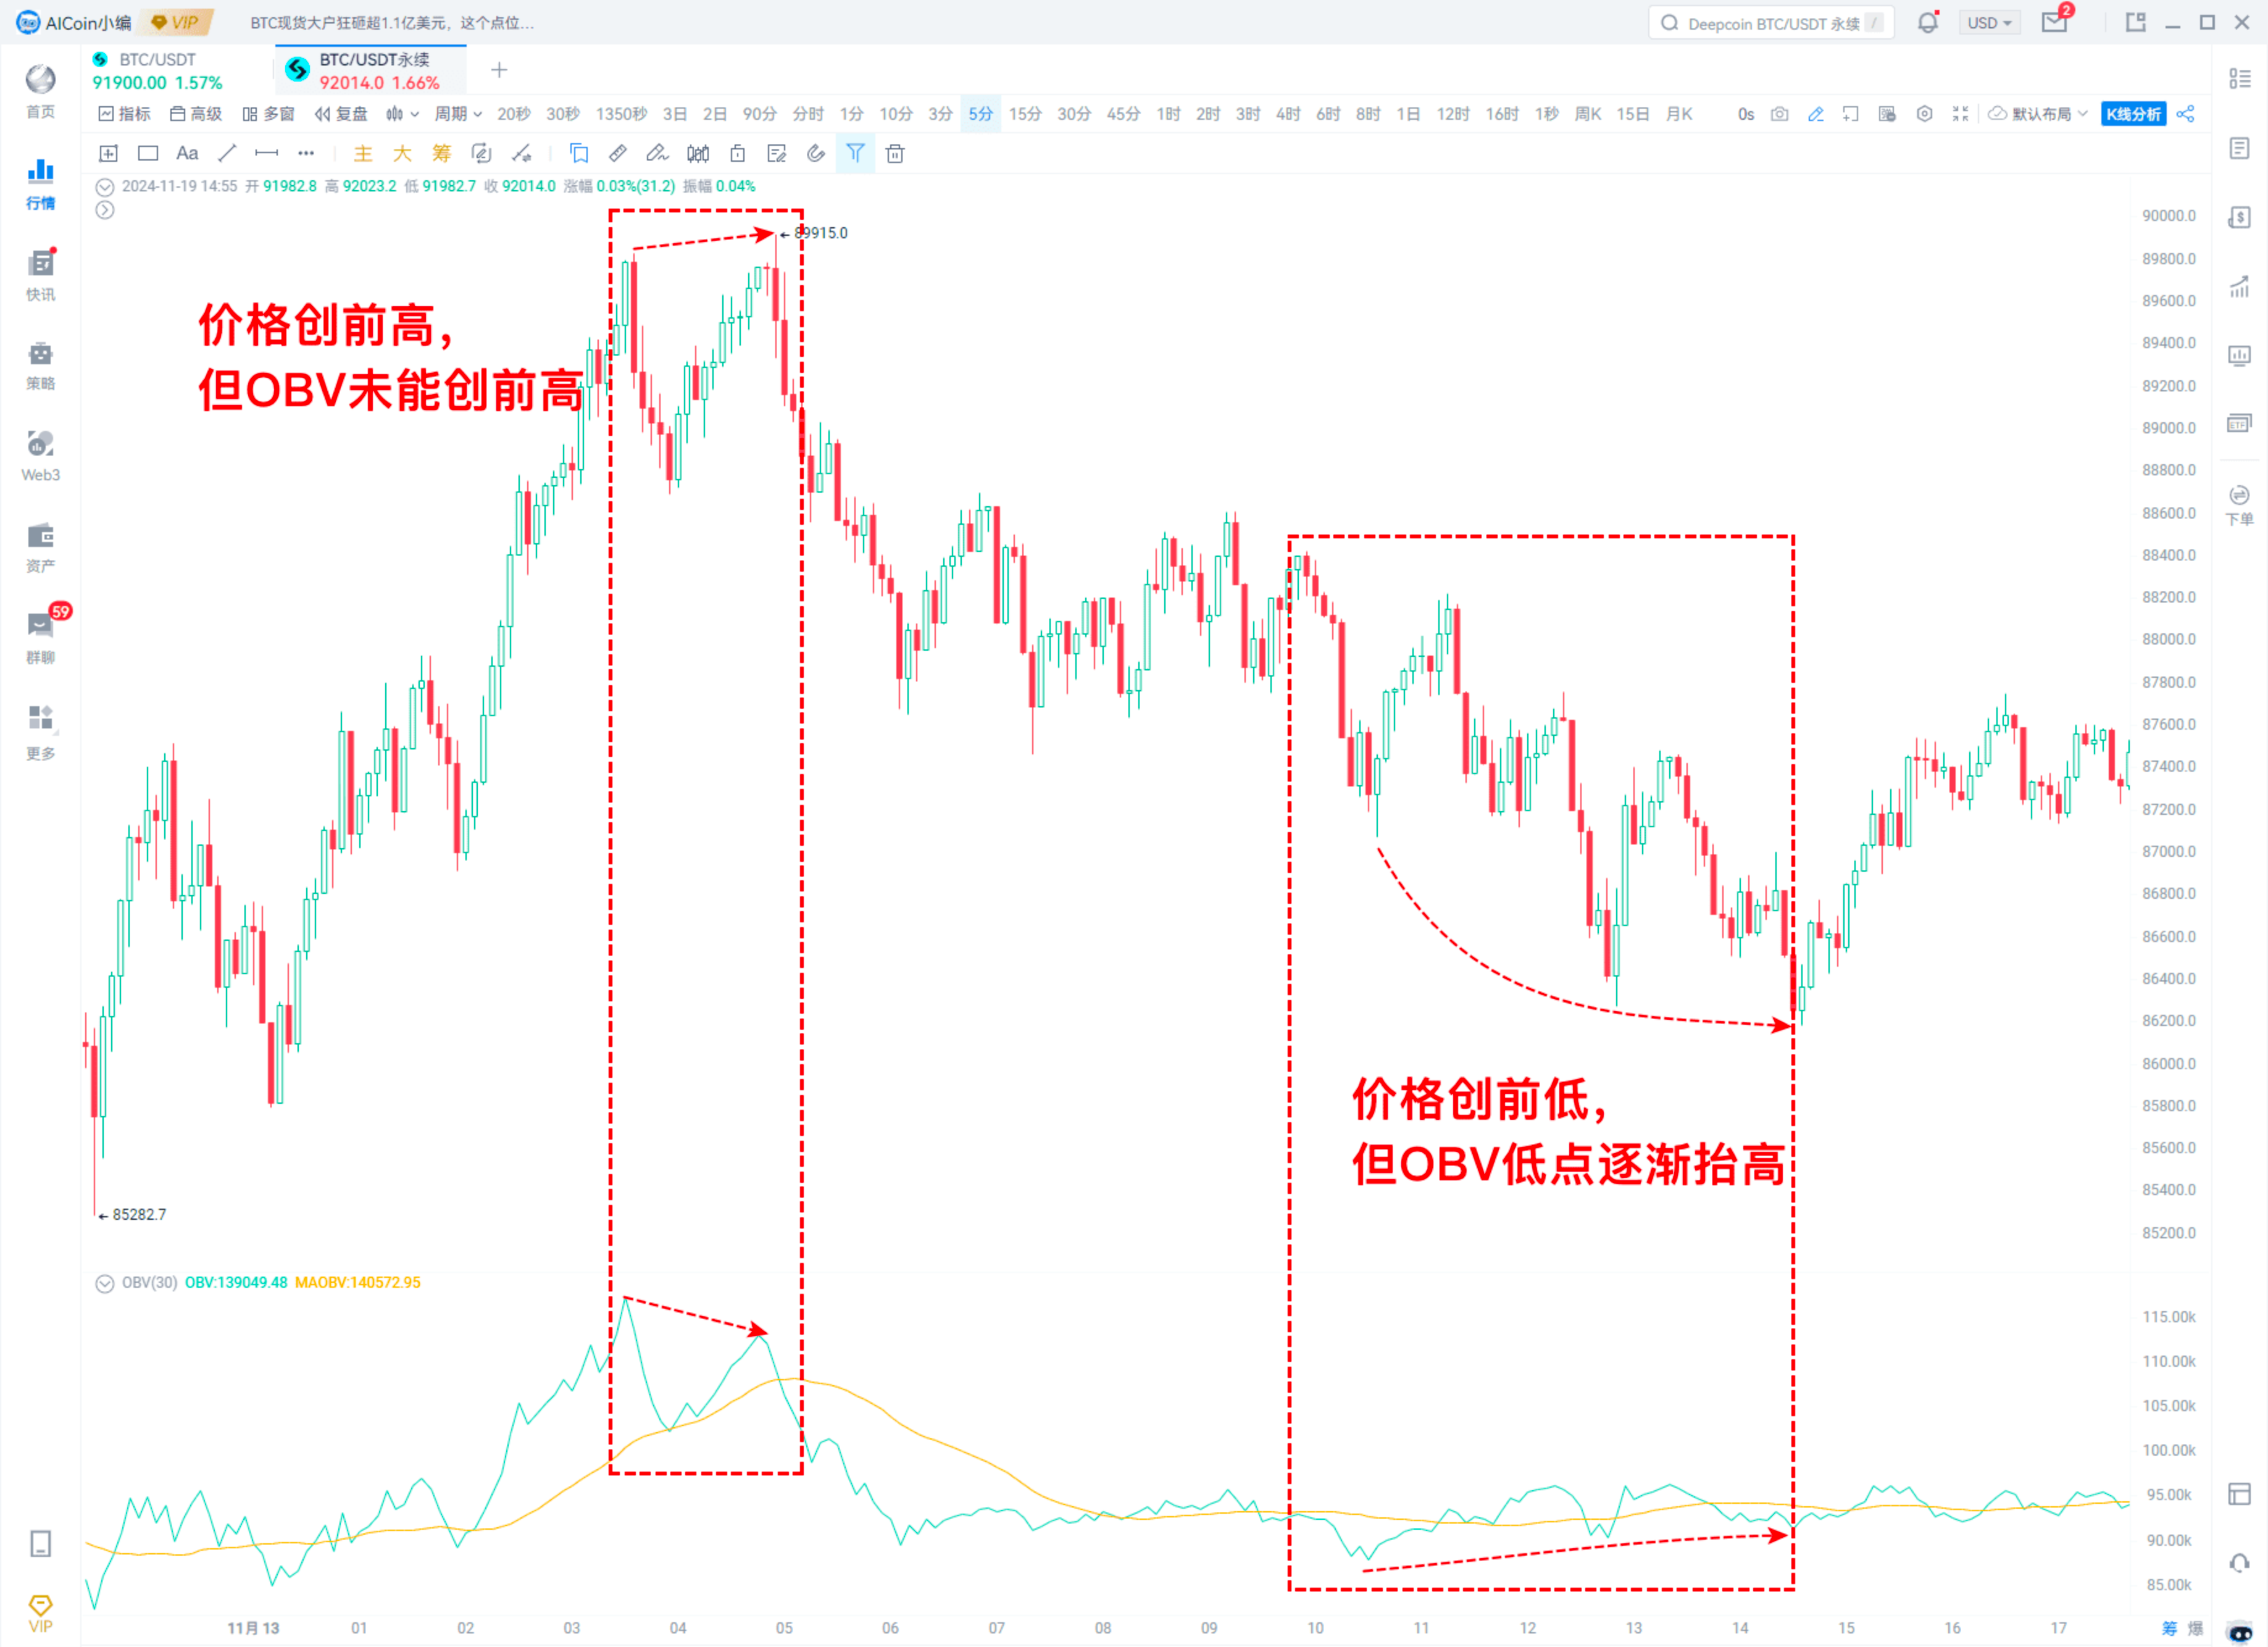
This can be combined with high and low points to create a custom indicator.
For example, like this.
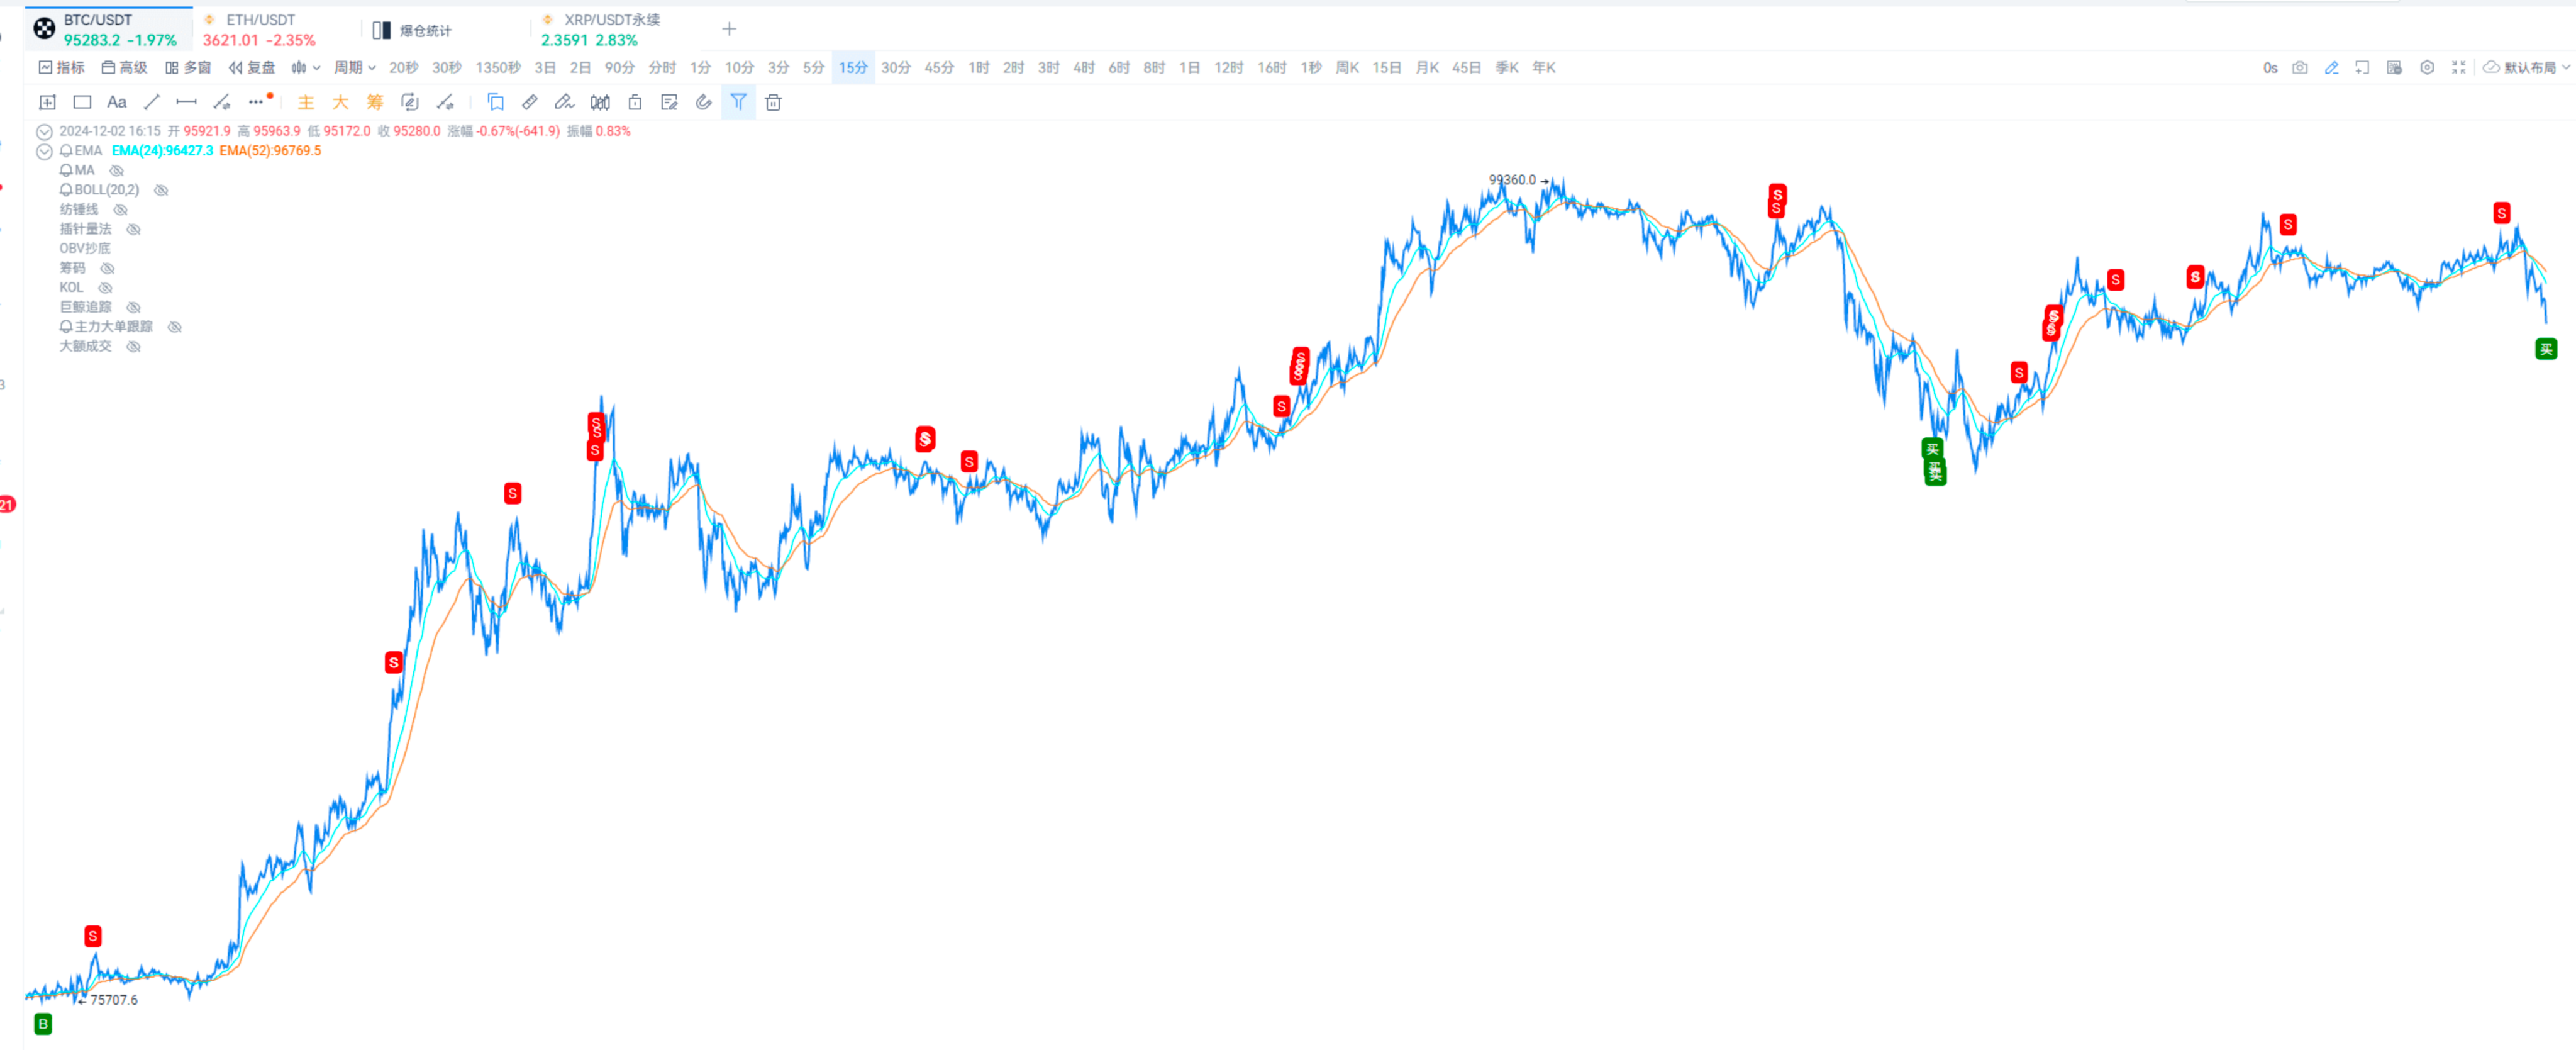
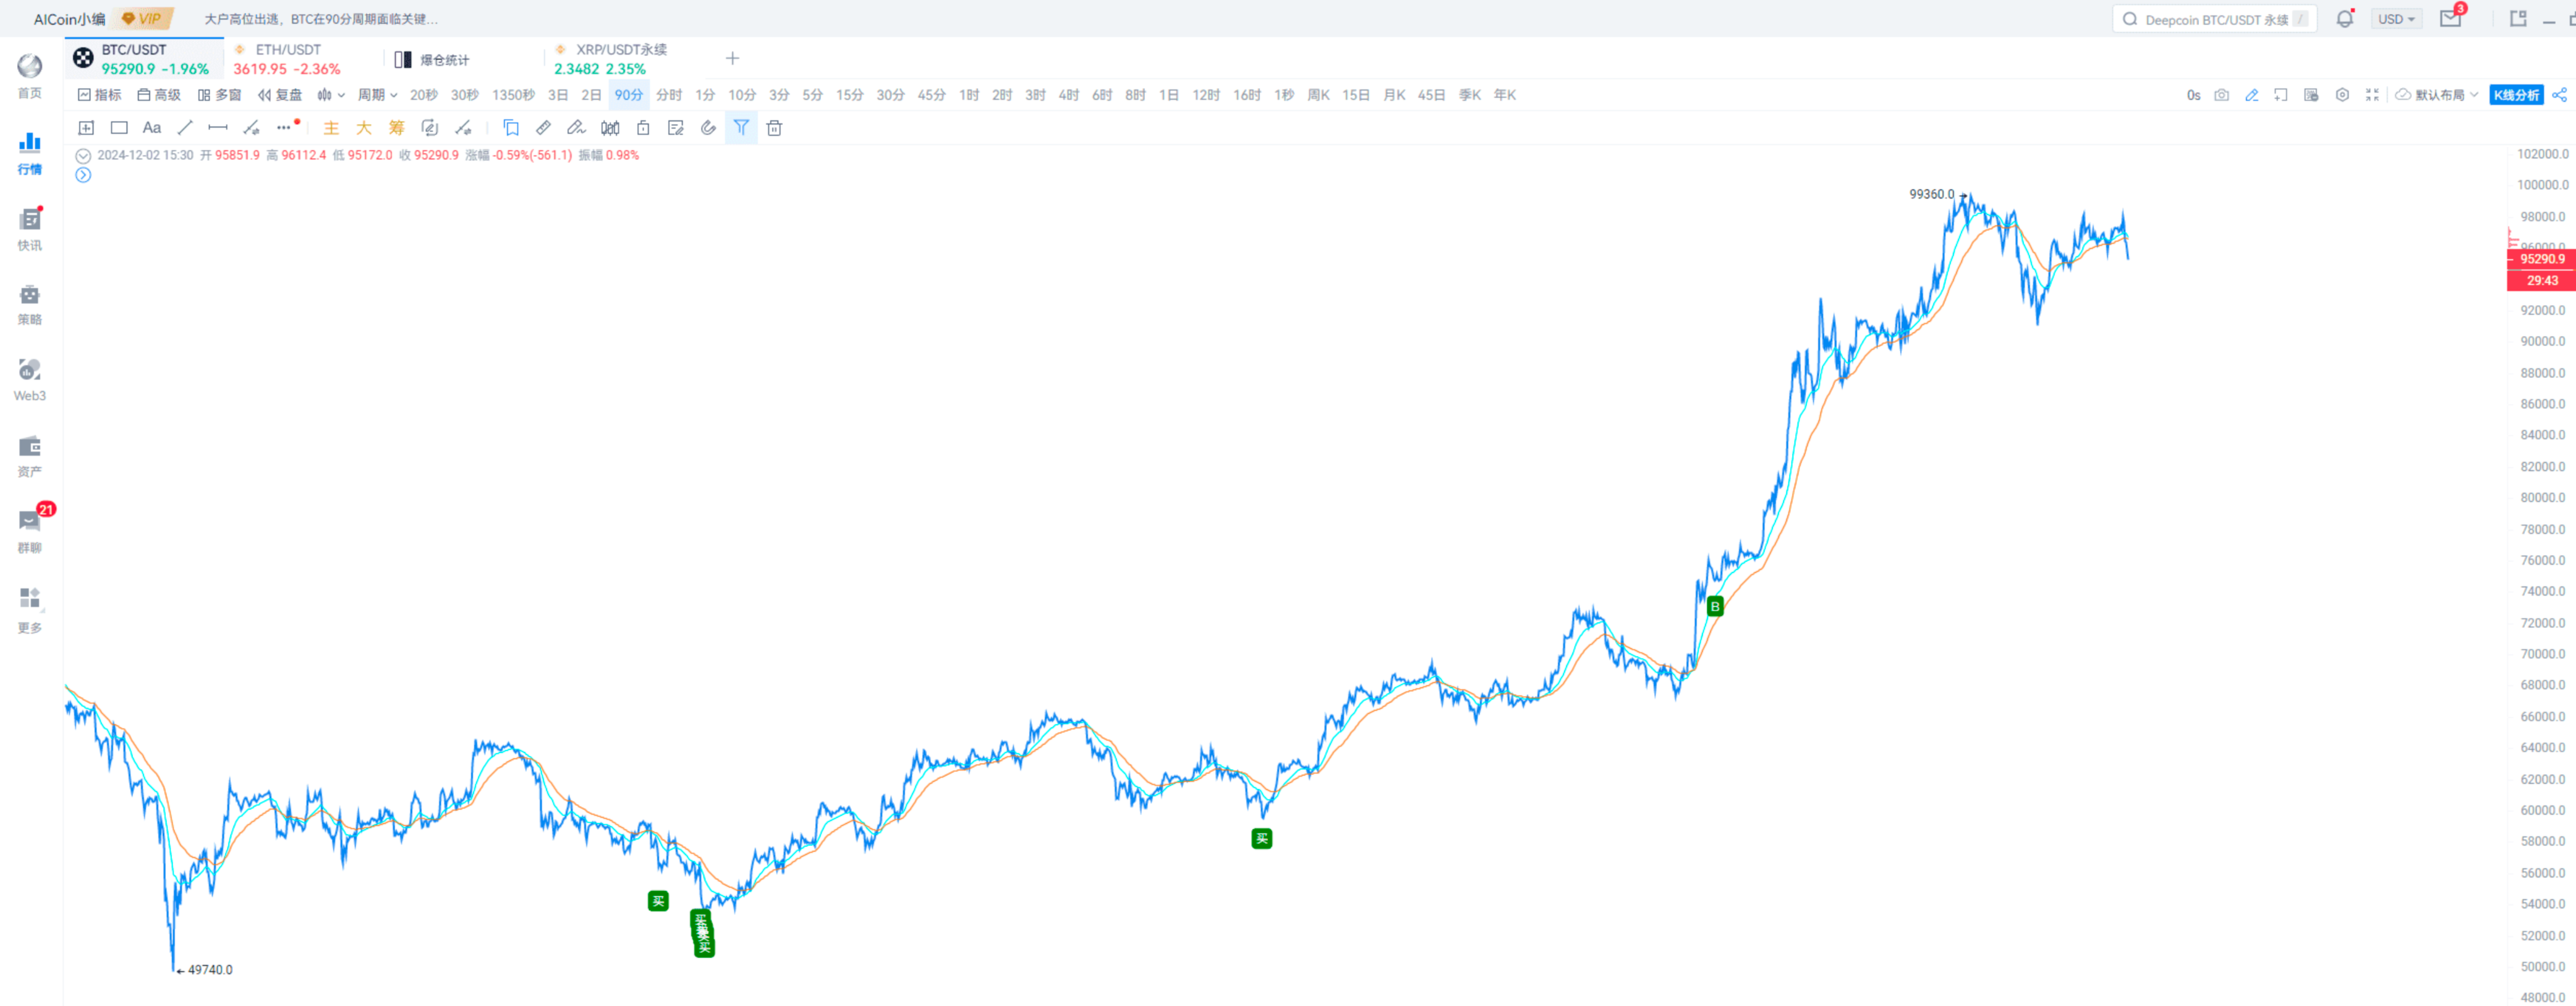
The buying signal in the 90-minute cycle looks good.
Usage 4: Using in Combination with Other Indicators
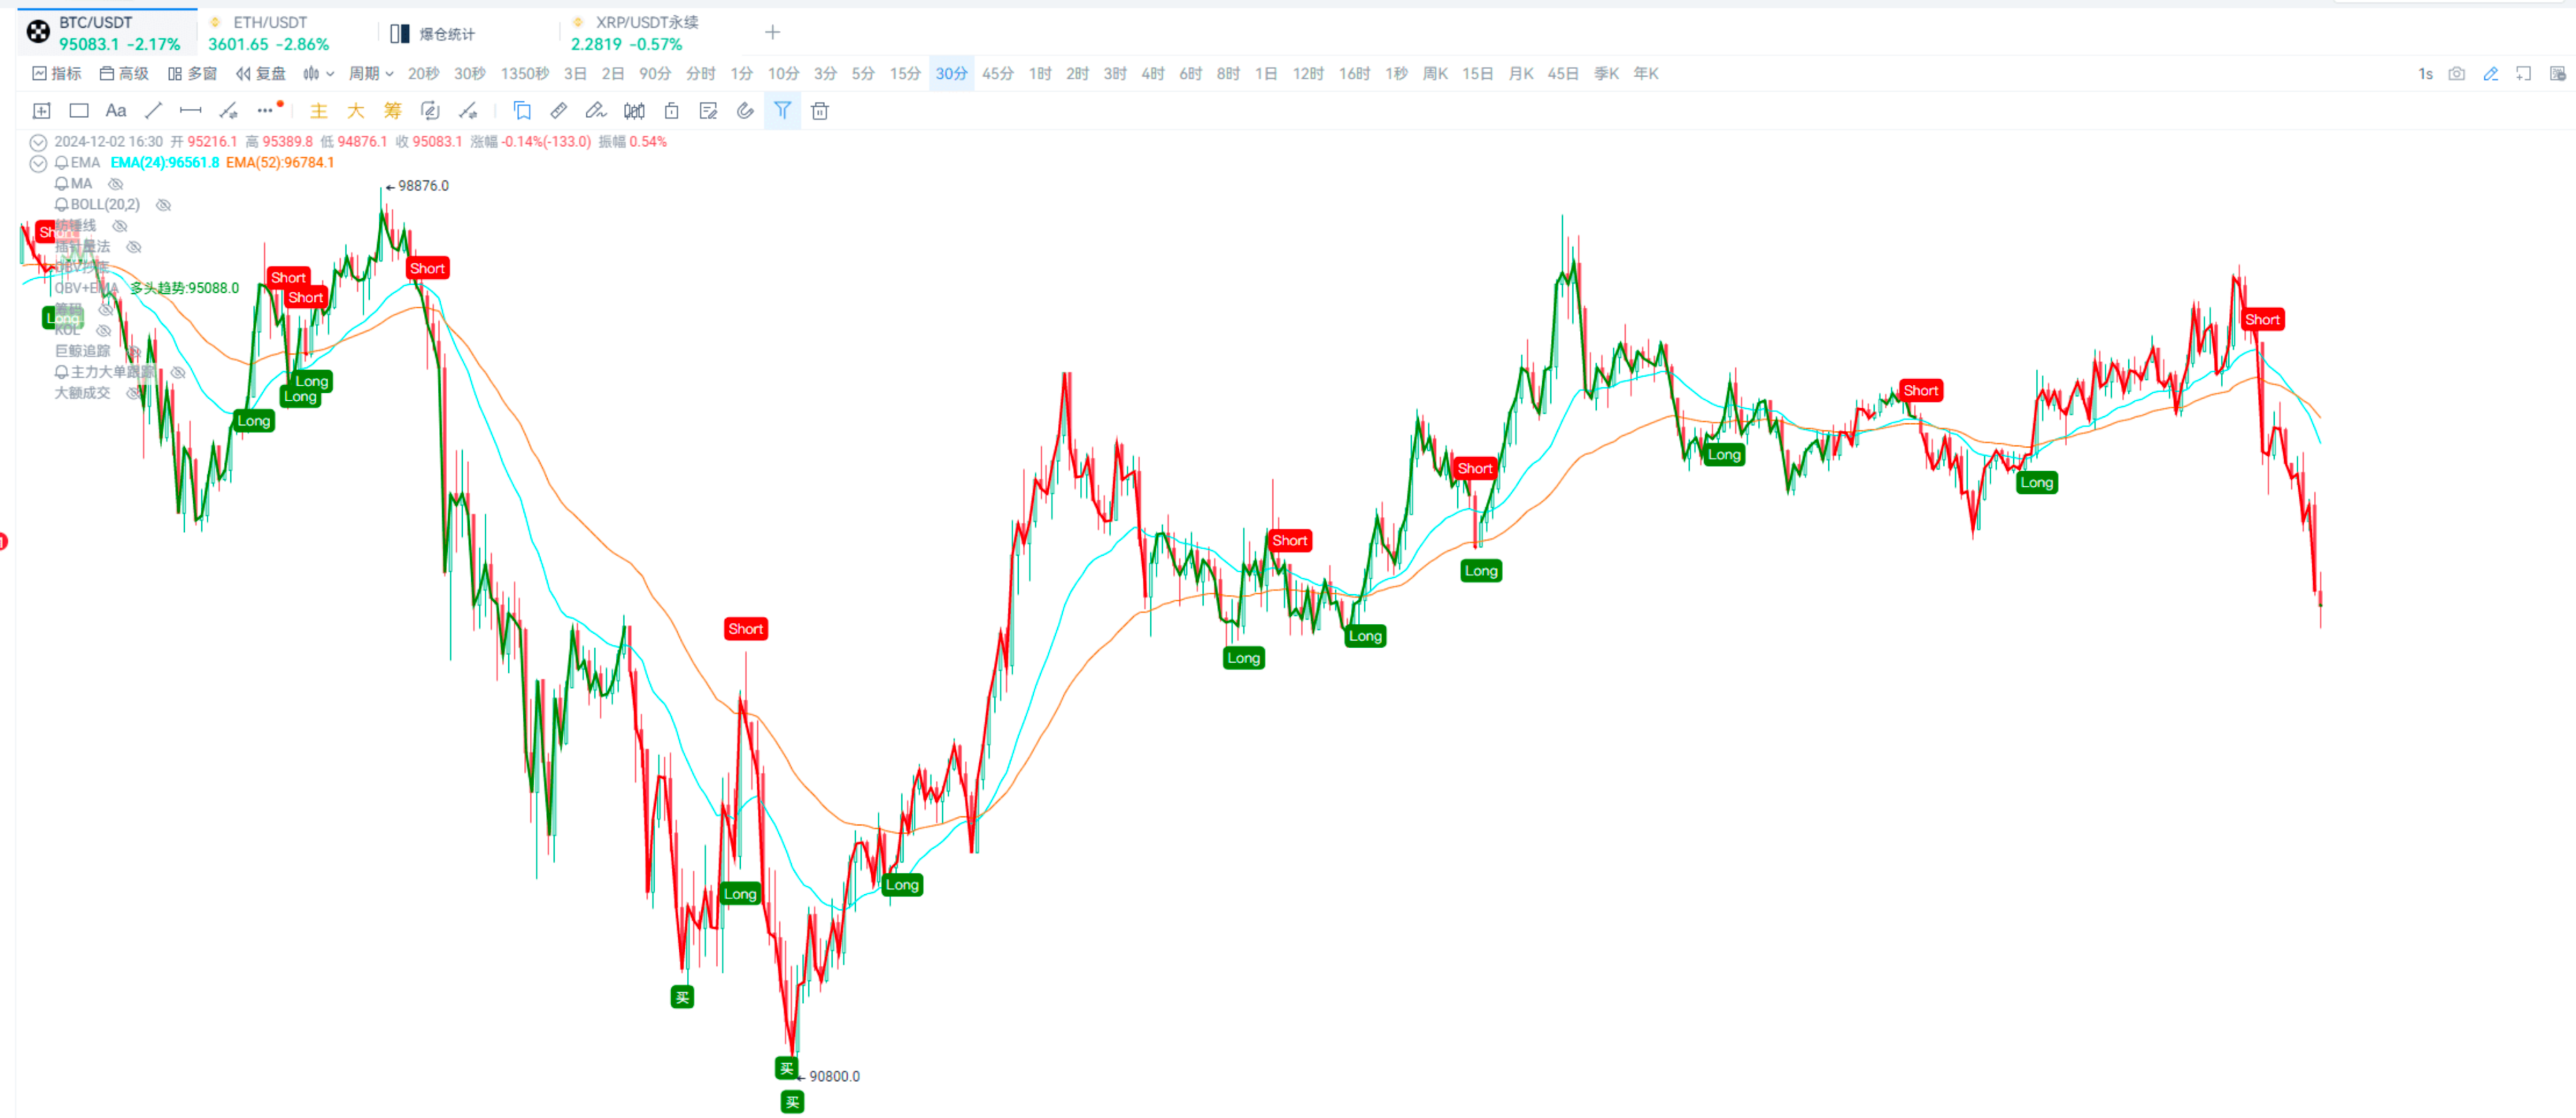
1. Using with Moving Averages
Specific moving averages and parameters can be adjusted according to personal charting habits.
Taking EMA52 + OBV as an example:
When OBV rises while the price remains above the EMA52 moving average, it is considered a bullish trend;
When OBV falls from a high point while the price drops below and stays below the moving average, it is considered a bearish trend.
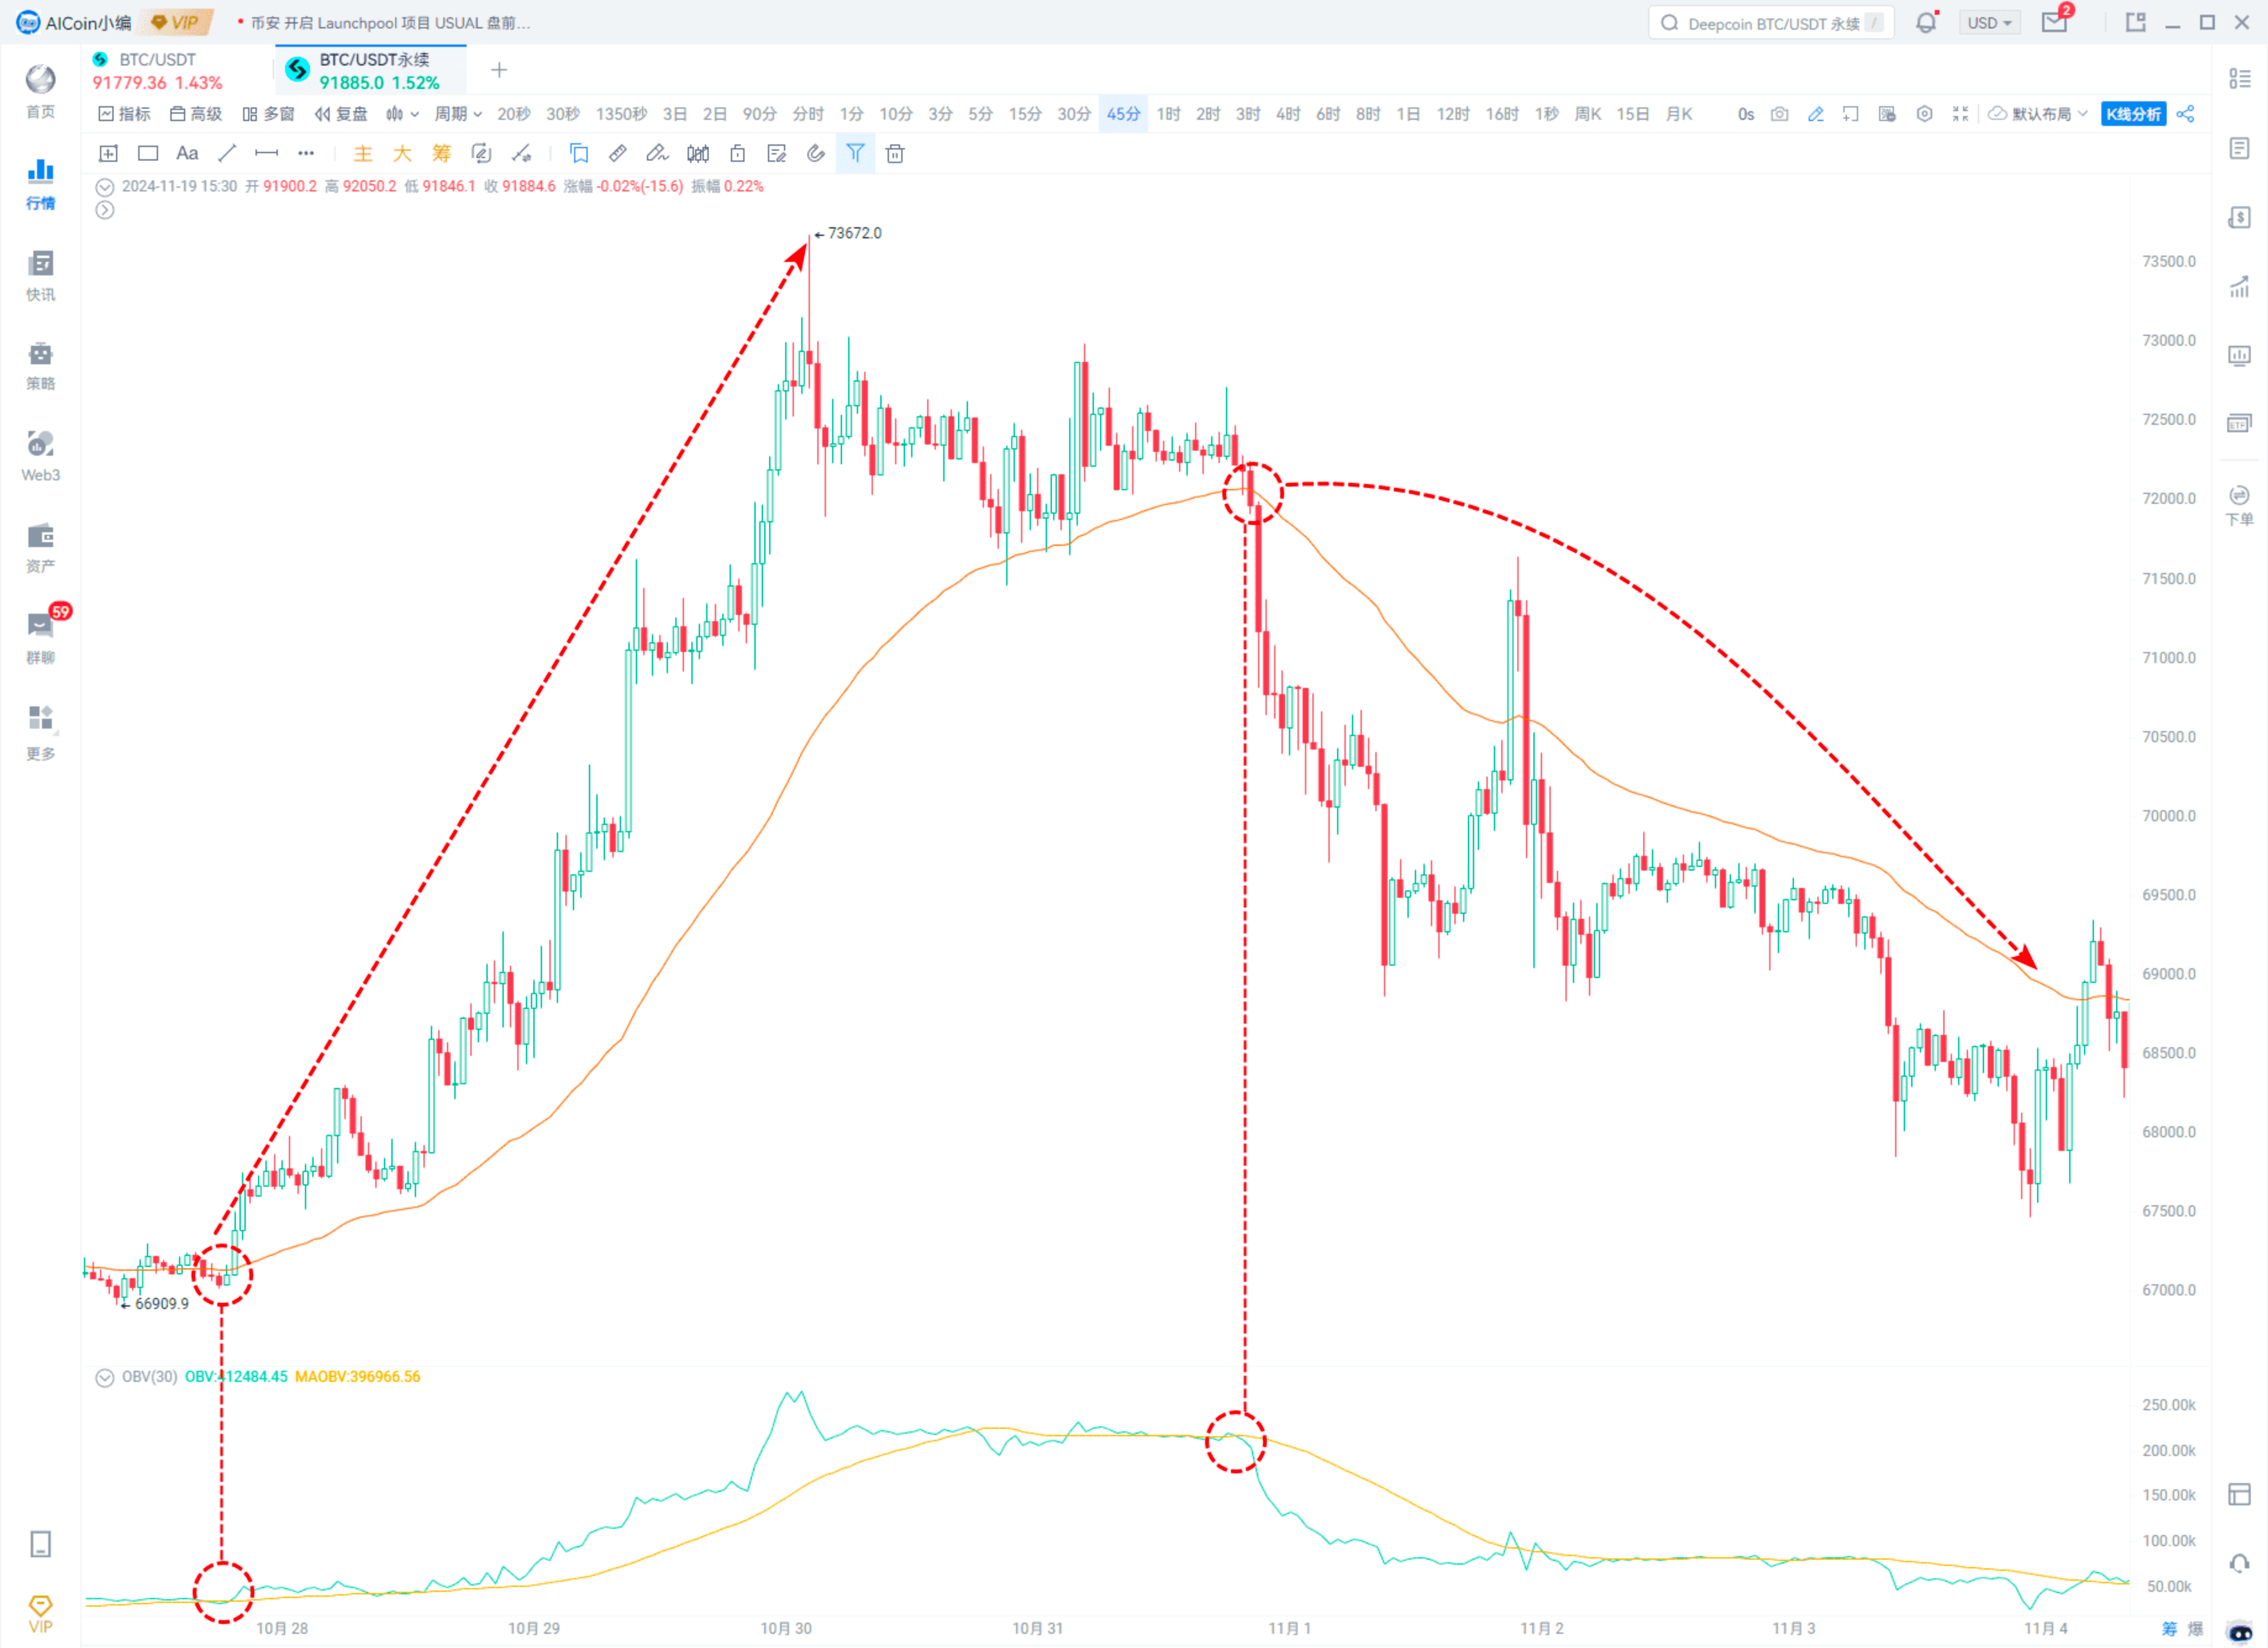
This can also be achieved using custom indicators.
2. Breaking Key Support and Resistance
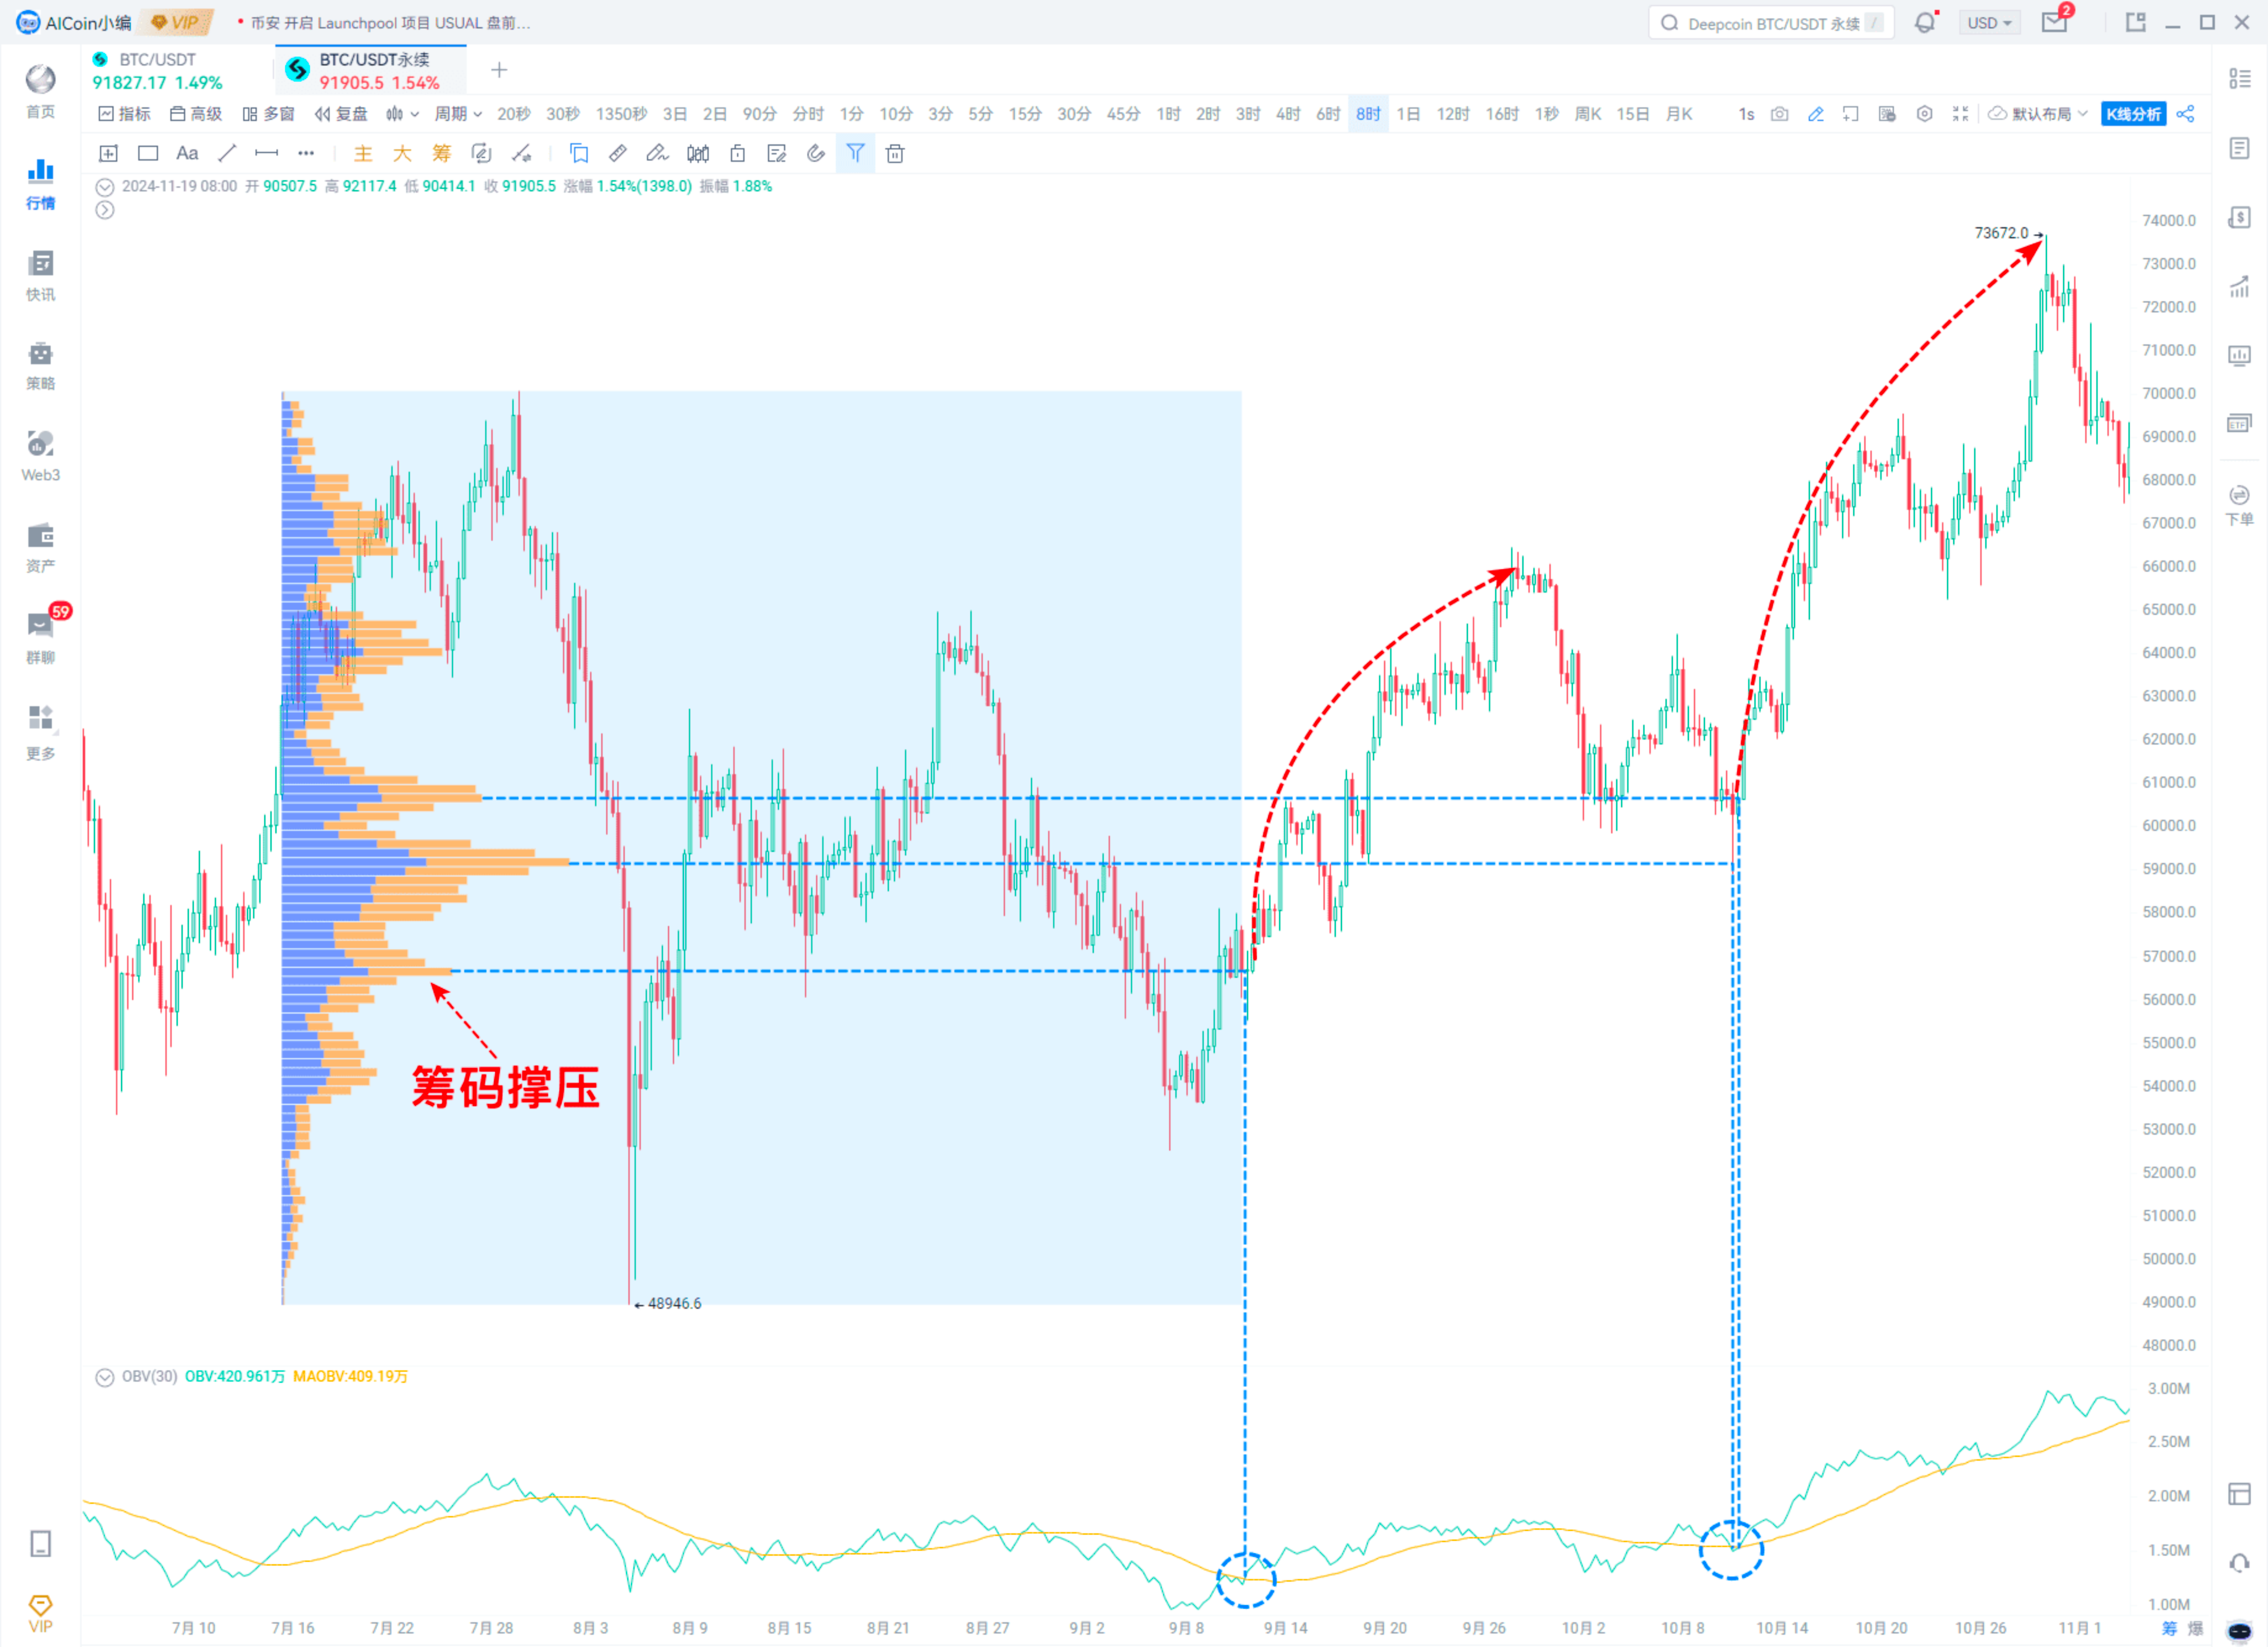
Support and resistance can be viewed in conjunction with the chip peak.
Buying signal: Breaking through chip resistance or retracing without breaking chip support, while OBV breaks through, is considered a bullish signal;
Selling signal: Falling below chip support or attempting to rise without breaking chip resistance, while OBV falls below, is considered a bearish signal.
3. Using with Trading Volume
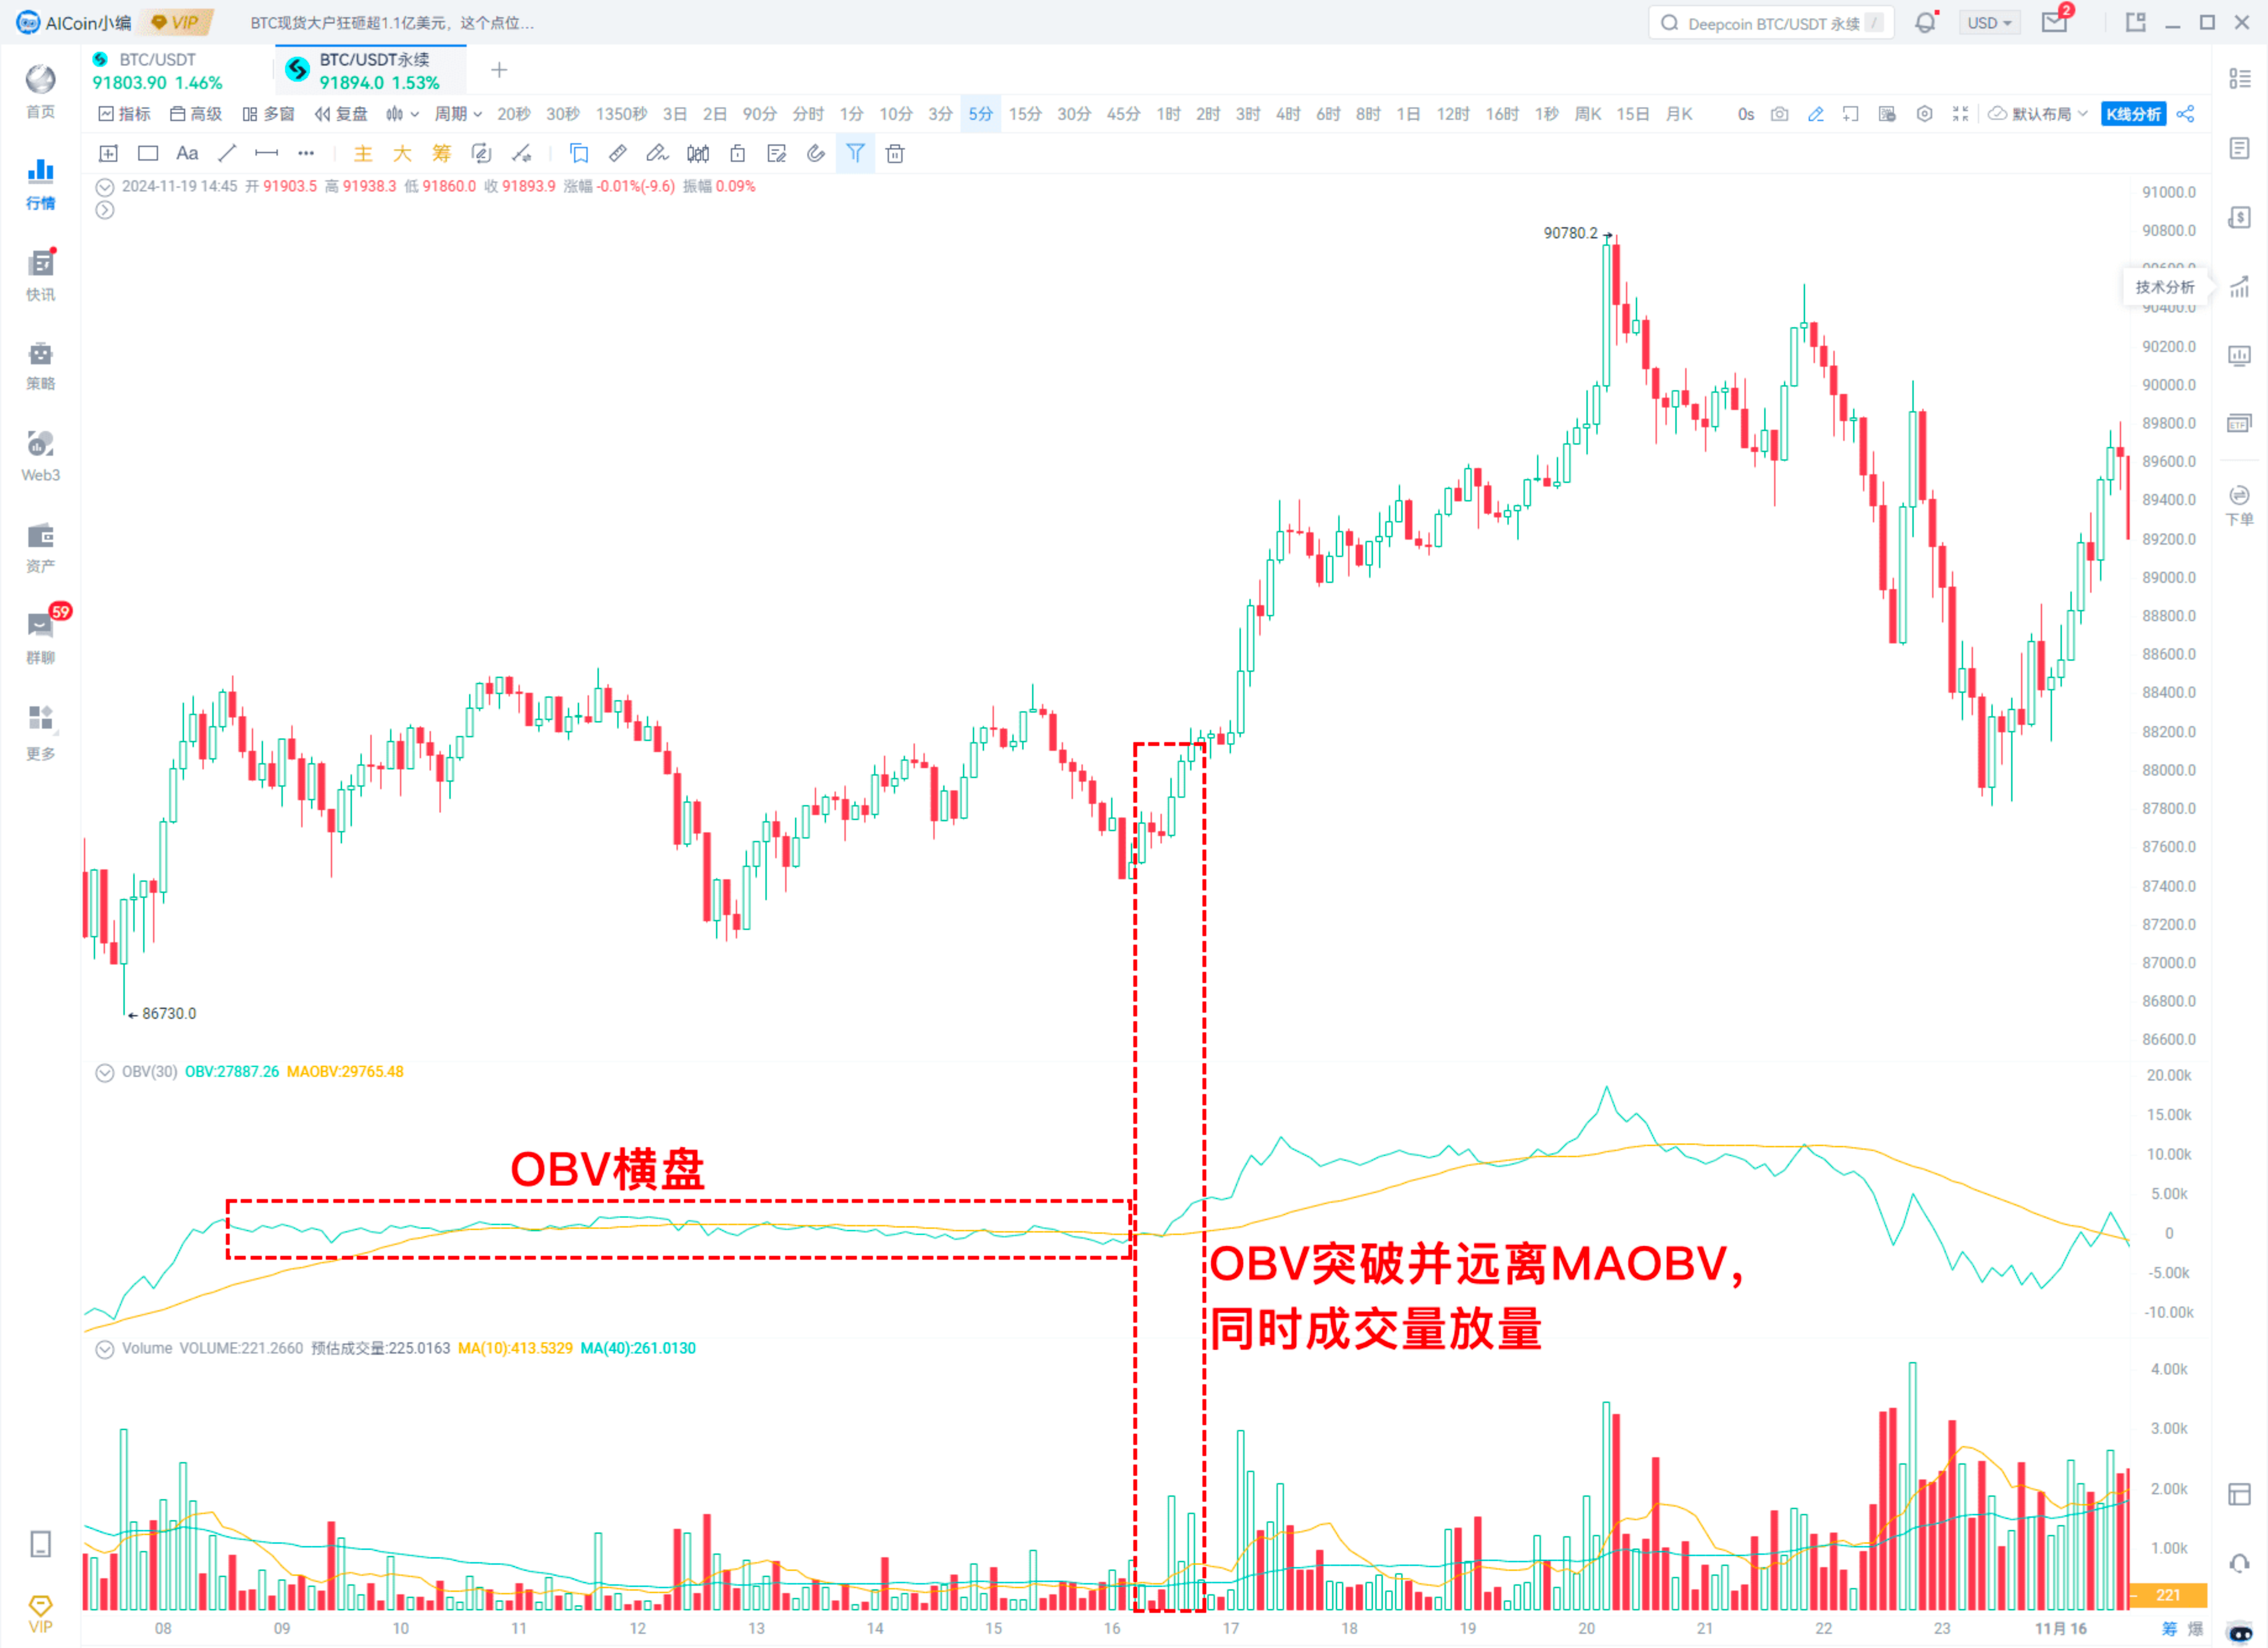
① Combining with total trading volume.
After OBV consolidates for a period, breaking through MAOBV while trading volume increases is a good buying opportunity.
Additionally, if the price has unusual movements but OBV remains flat, it usually indicates that market holding interest is low, making it unsuitable to enter.
Different currency pairs have different prices, so the indicator data will also vary.
The data of the OBV indicator does not have much practical significance; just look at the trend.
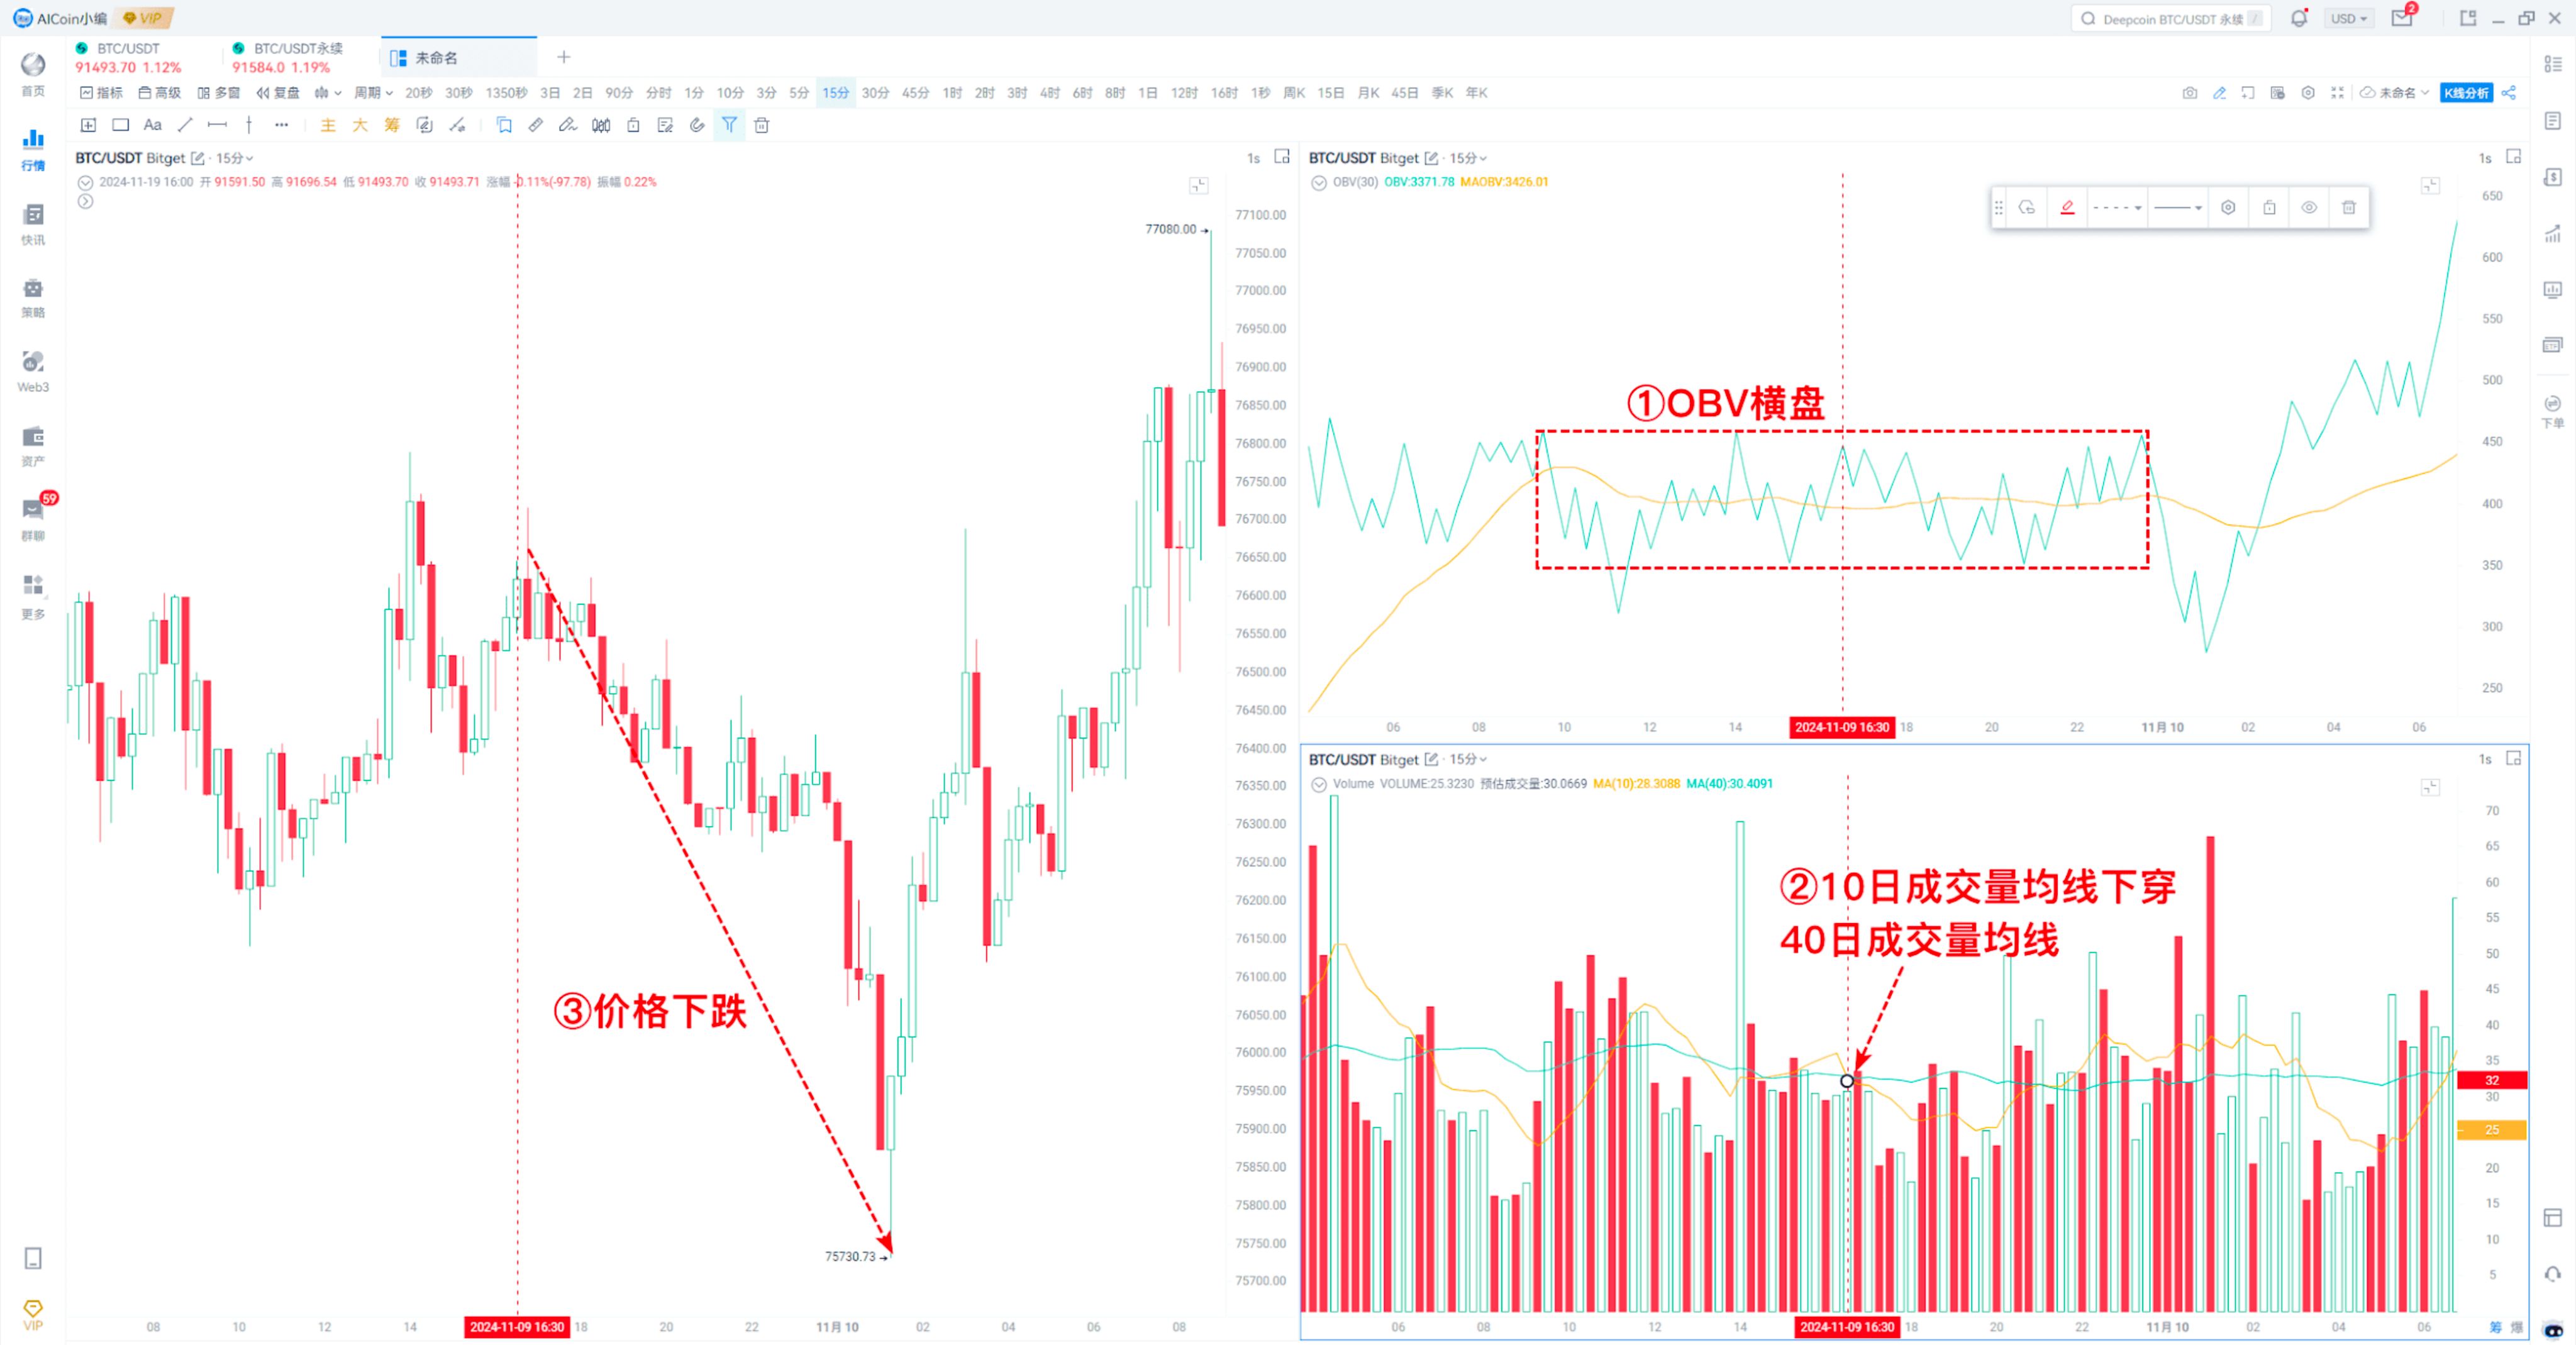
② Viewing with moving averages of trading volume.
Buying signal: OBV rises, and the short-term volume average crosses above the long-term volume average.
Selling signal: OBV is in a non-trending state, and the short-term volume average crosses below the long-term volume average.
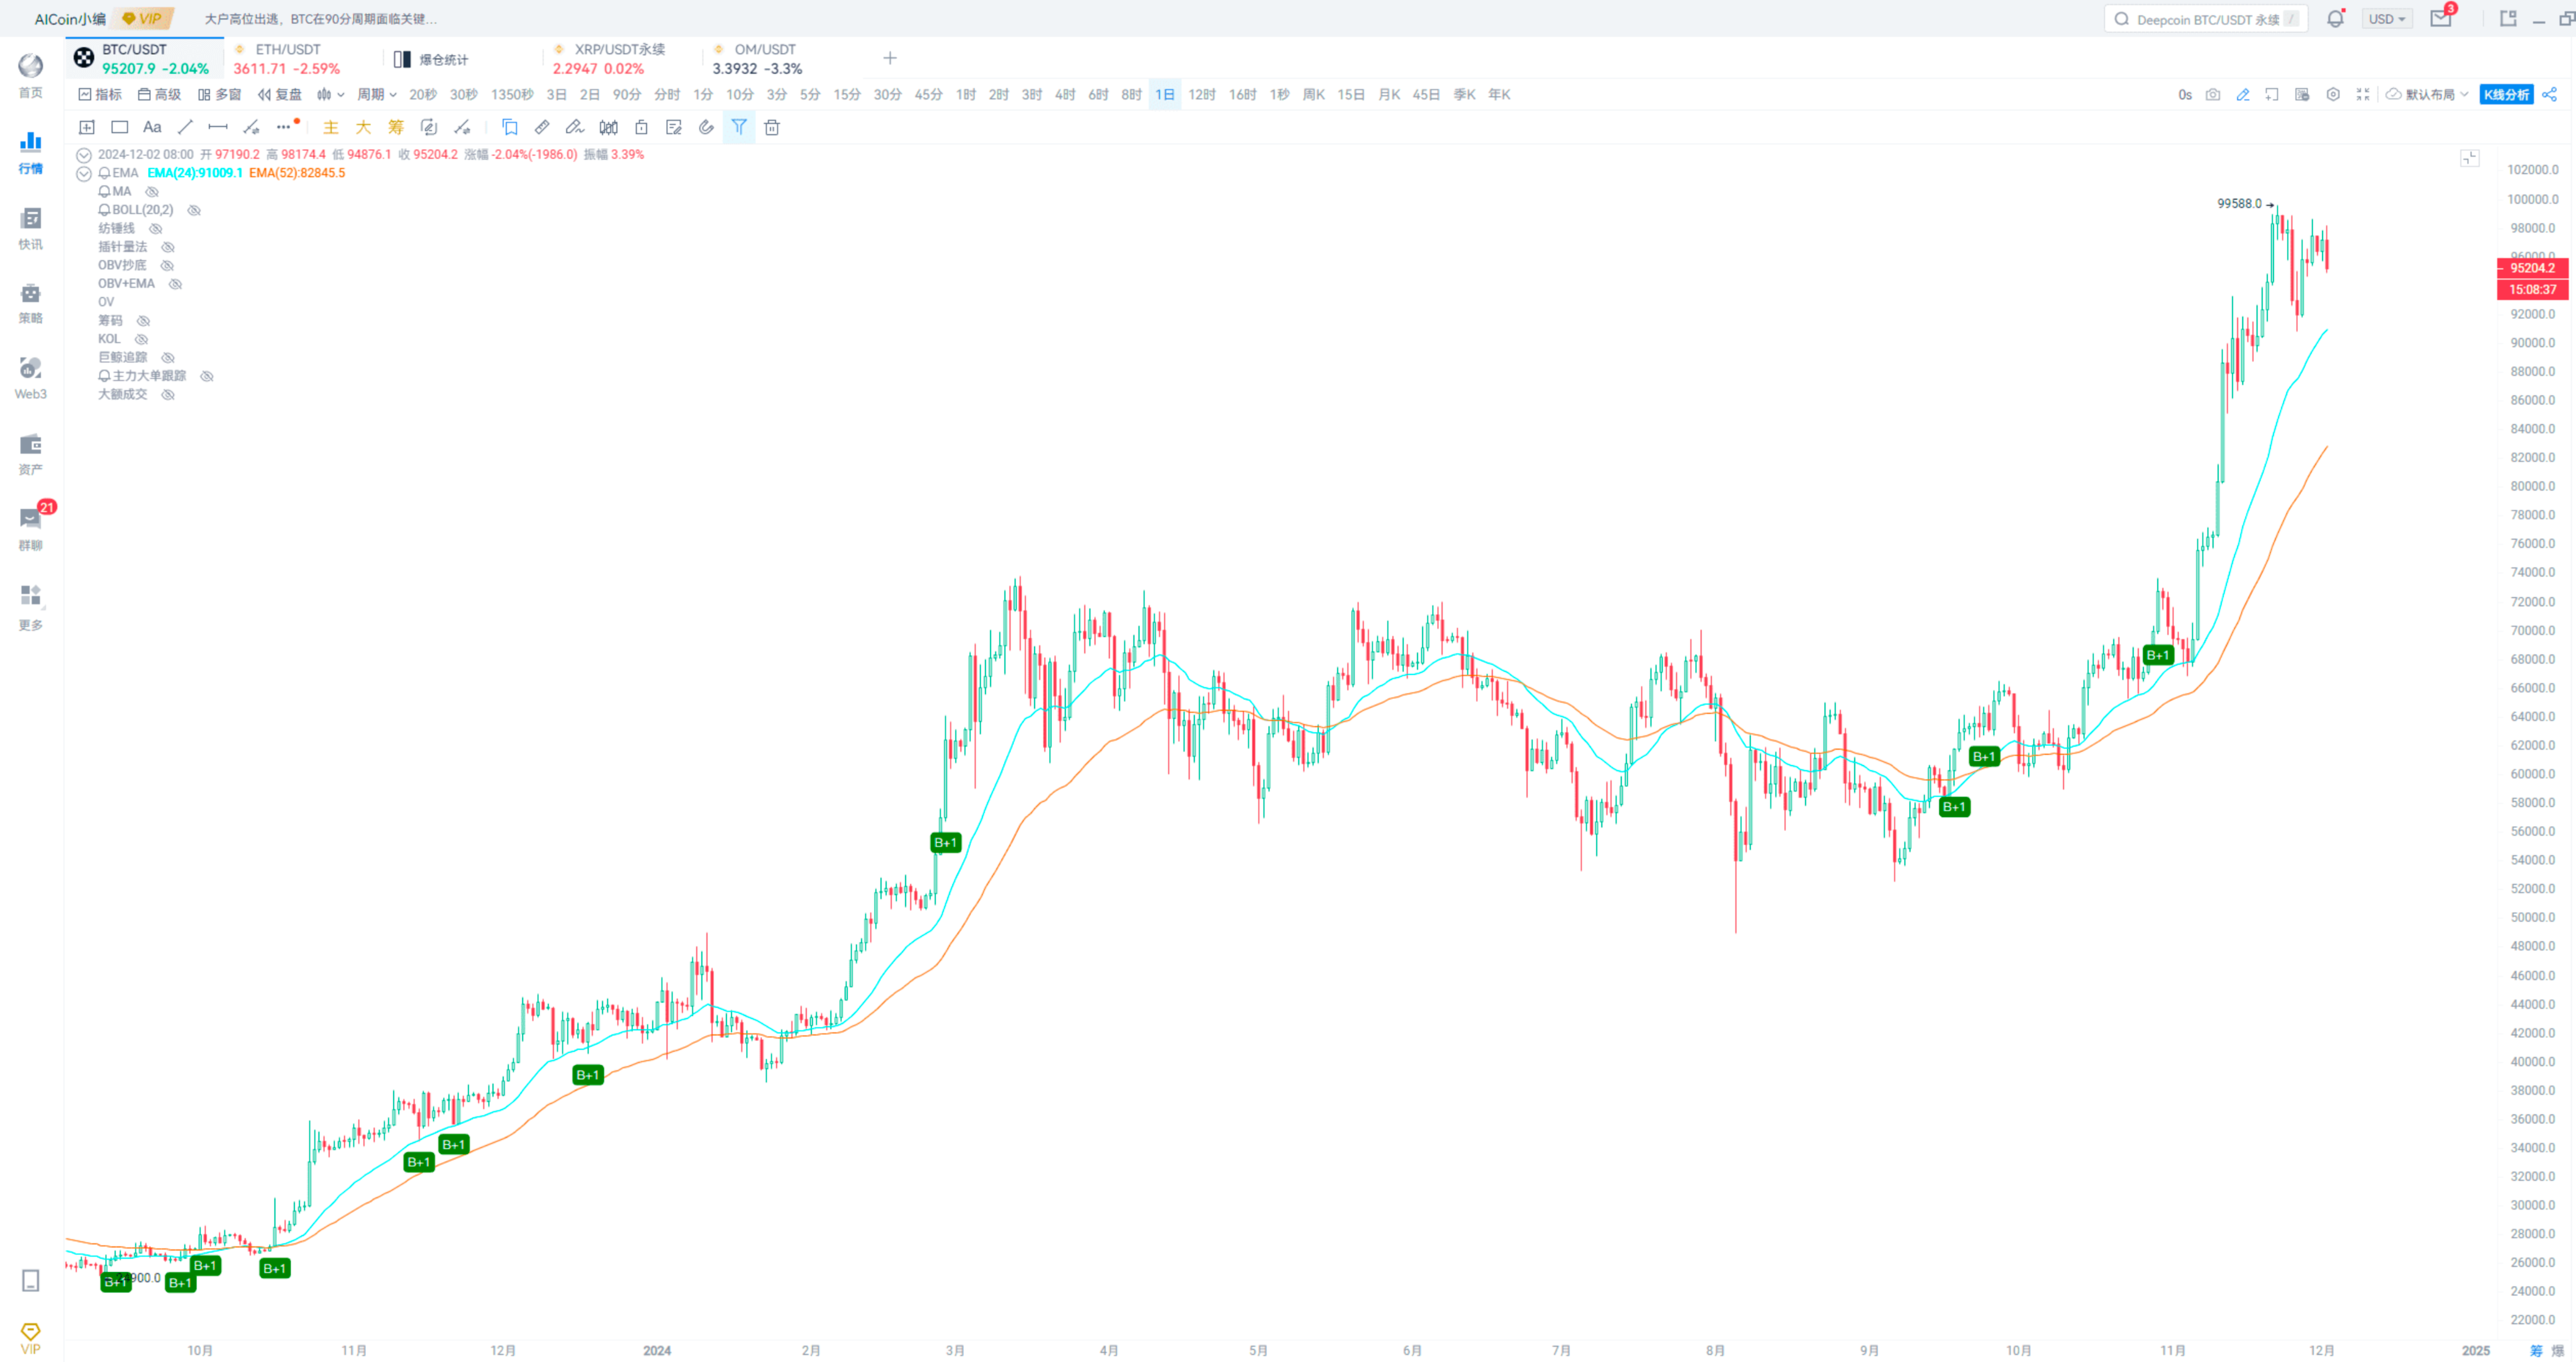
Buying signals can also be monitored using custom indicators.
As shown in the figure.
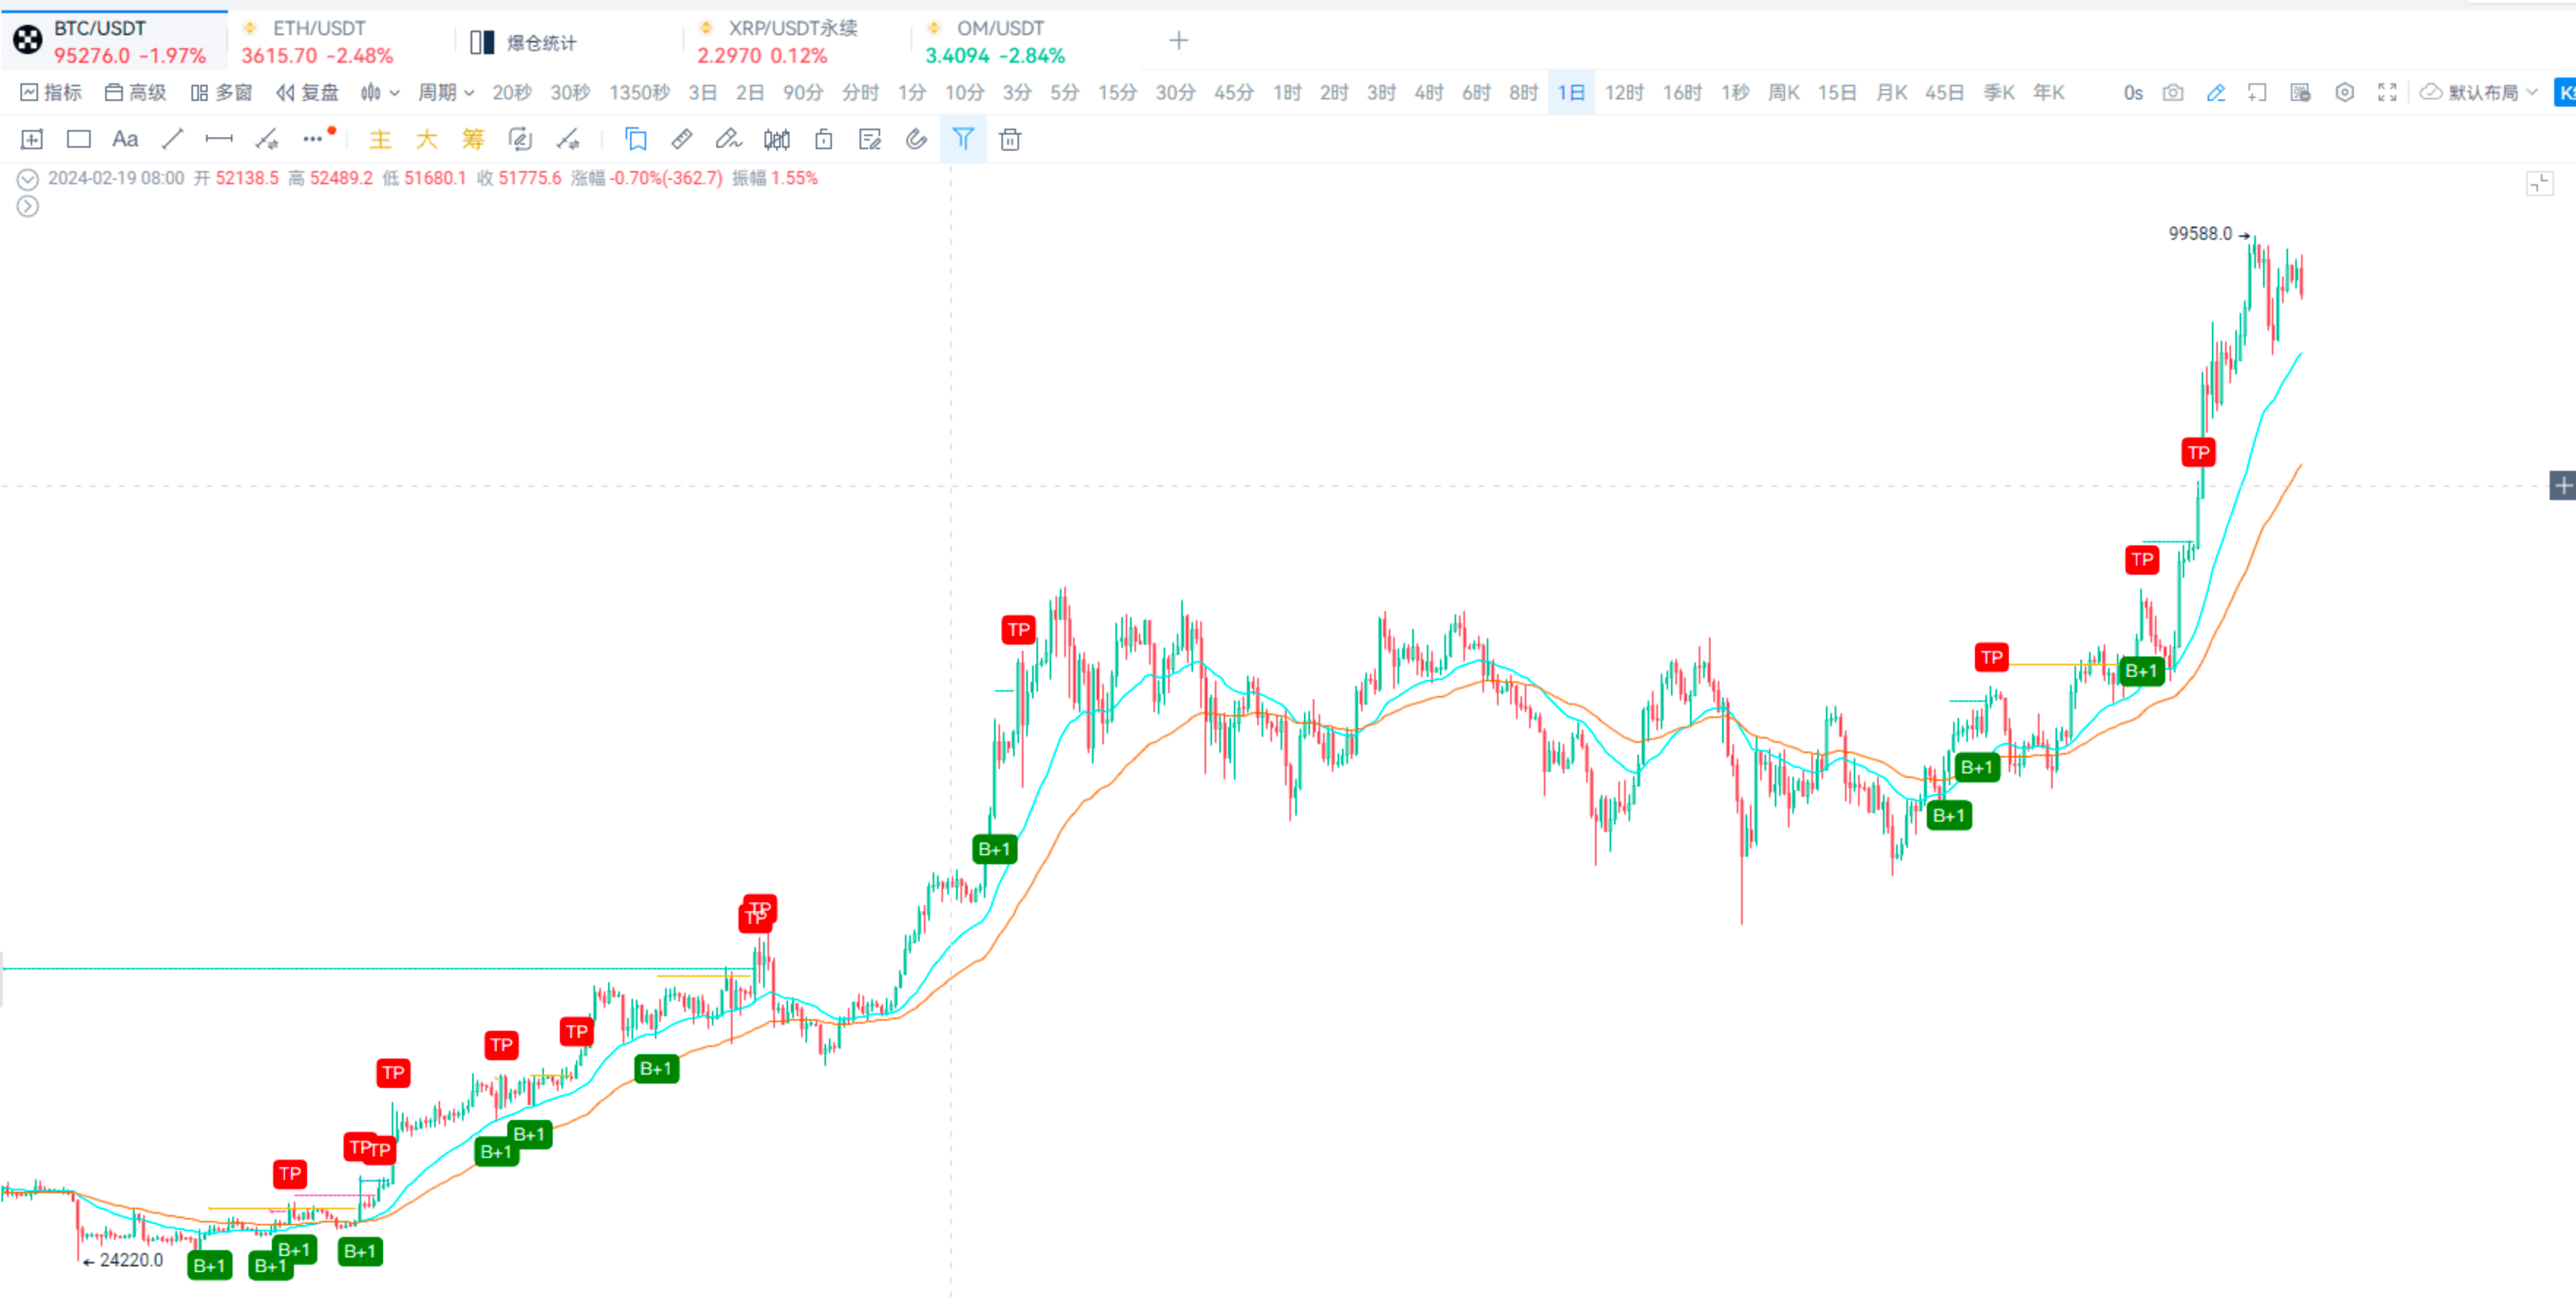
This can also add real-time trading functions.
For example, as I captured, if the spot position reaches a certain profit percentage, it will sell.
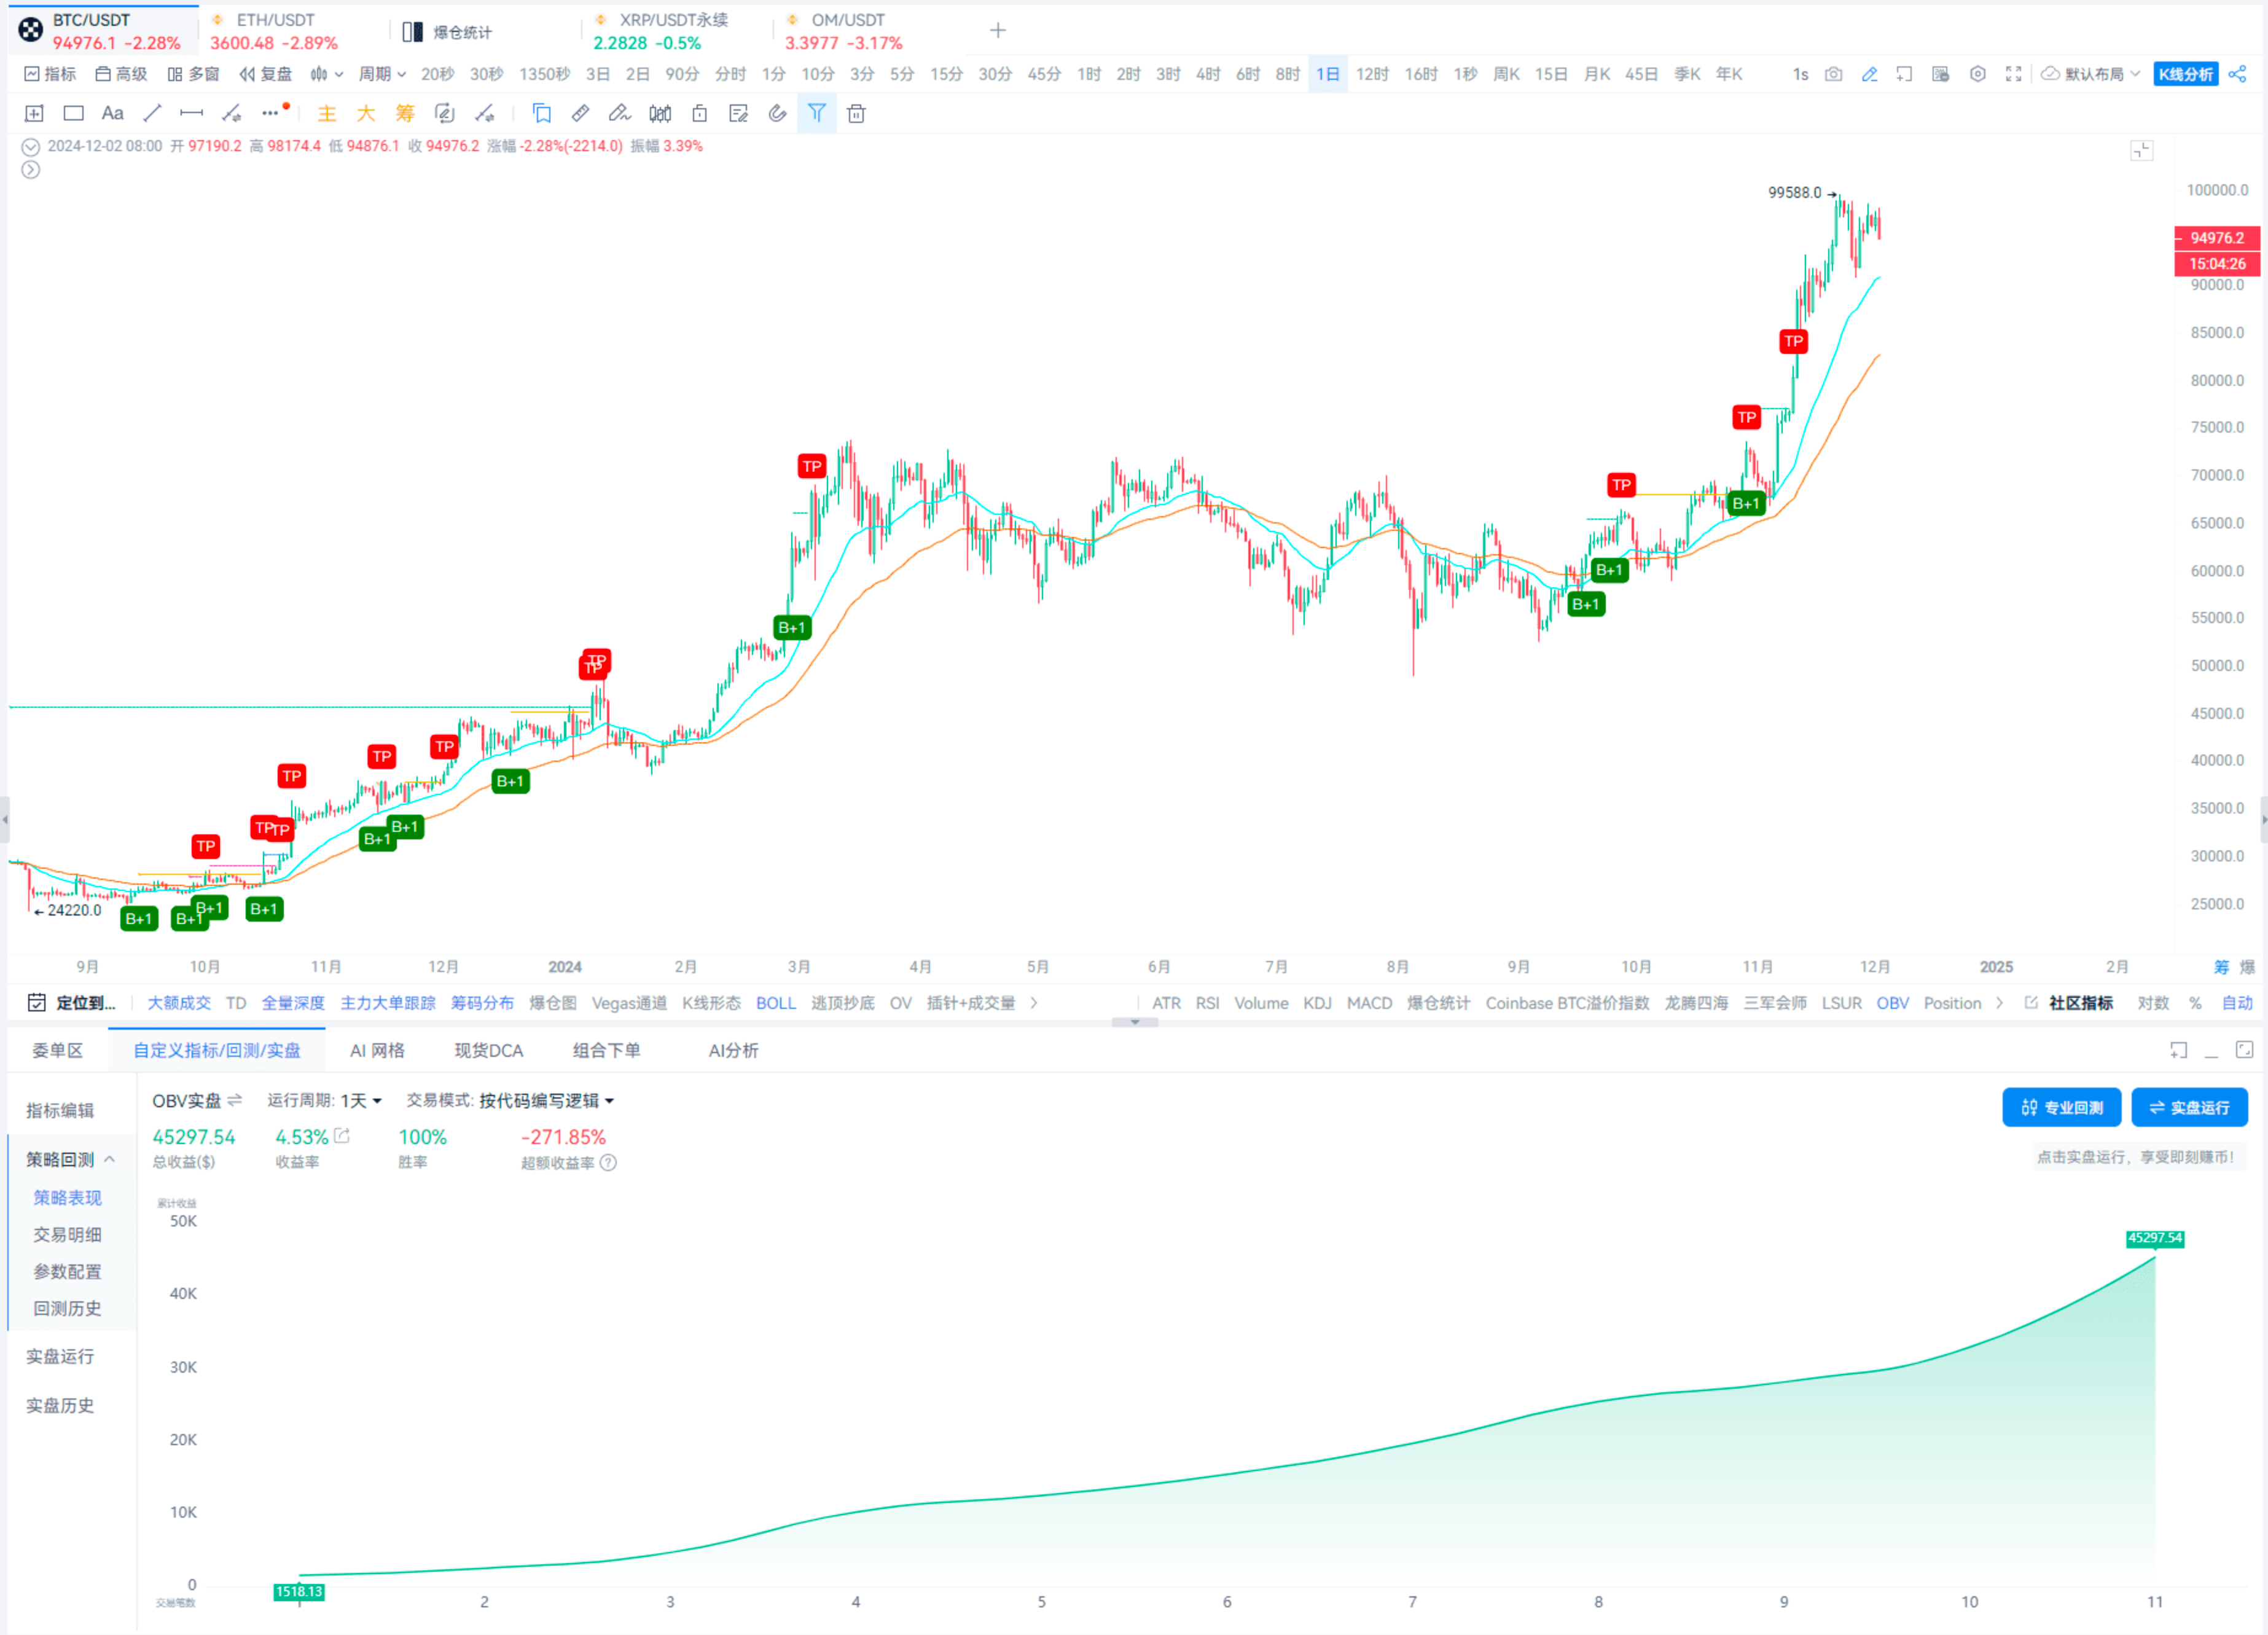
For backtesting, the effect is as shown, only doing spot trading.
Regarding the above indicator usage, if you are interested, you can contact us to customize indicators.
Alright, that's all for the OBV indicator usage sharing!
Next time, I will share the usage of indicator combinations!
That concludes all the content of the live broadcast!
Thank you all for your attention, stay tuned to our live broadcast room.
In a bull market, let's explore the market together and find trading opportunities! Use AICoin well to earn a free life.
Recommended Reading
For more live broadcast insights, please follow AICoin's "AICoin - Leading Data Market, Intelligent Tool Platform" section, and feel free to download AICoin - Leading Data Market, Intelligent Tool Platform.
免责声明:本文章仅代表作者个人观点,不代表本平台的立场和观点。本文章仅供信息分享,不构成对任何人的任何投资建议。用户与作者之间的任何争议,与本平台无关。如网页中刊载的文章或图片涉及侵权,请提供相关的权利证明和身份证明发送邮件到support@aicoin.com,本平台相关工作人员将会进行核查。


