Today, let's analyze the Bitcoin market from a technical perspective. The Fibonacci extension line on the weekly chart has broken through 61.8%, and the next target is 78.6%, which is exactly 107,000. The weekly chart has seen four consecutive weeks of gains, all above the upper Bollinger Band. Although there is a divergence in volume and price, with the 4-hour RSI and MACD showing divergence, the daily chart has not fallen below the MA20, and the overall pullback is still above the Fibonacci 0.236, leaning towards a high-level oscillation upward.
Ethereum's monthly increase is second only to the large bullish candle in February. The pullback still looks bullish, and the daily chart is moving upward along the upper line within the funnel. The 4-hour chart continues to rise along the middle Bollinger Band, and we will see if the current sustained high-level oscillation can be digested despite the MACD divergence.
Bitcoin
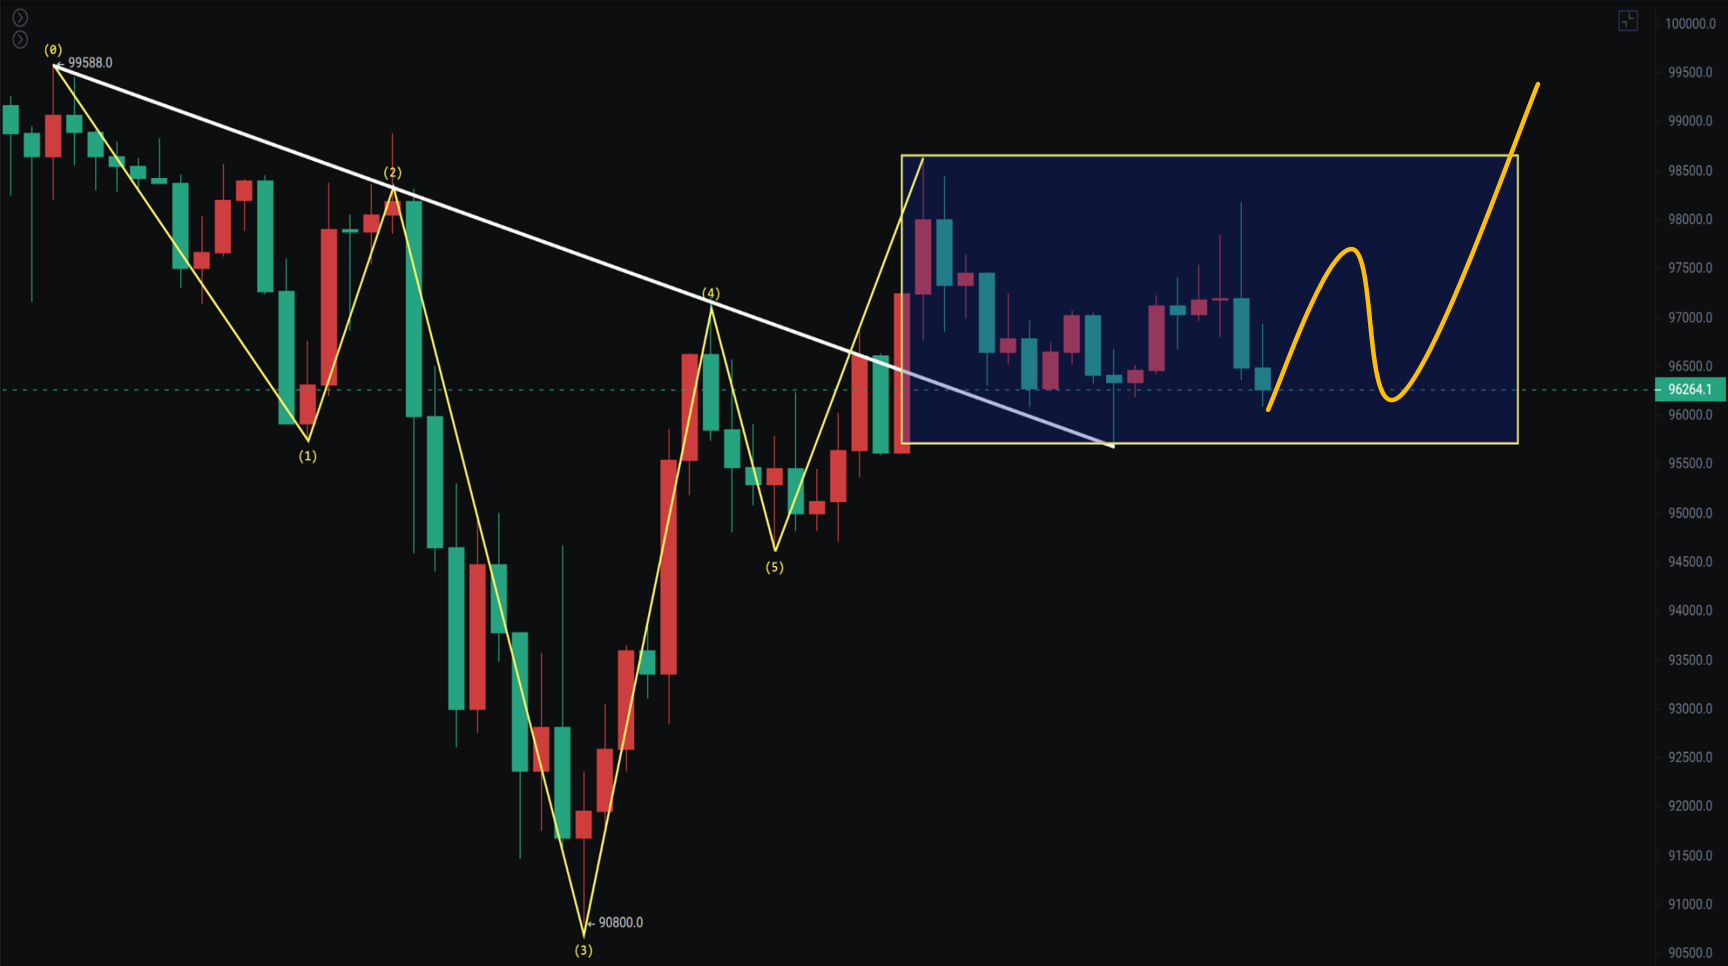
This morning, Bitcoin once again touched around 98,100 and faced pressure, falling to a low of 96,077. This is also close to the pressure at 98,600, which is a normal pullback. Short-term support is at 95,600; as long as it does not break below this level, it will still aim to challenge 98,600 or even 99,588.
A few days ago, I also mentioned the potential head and shoulders bottom pattern, which cannot break below the neckline to continue the rebound. The Fibonacci levels from 99,588 to 90,800 are also above 0.382 (96,000). If it can maintain above this level, there is a chance to oscillate and challenge the previous high or even break through 100,000.
Support: Pressure:

Ethereum
The ETH/BTC exchange rate is at a turning point, currently re-testing the 0.038 platform pressure. The weekly MACD has crossed the zero line, which is worth paying attention to.
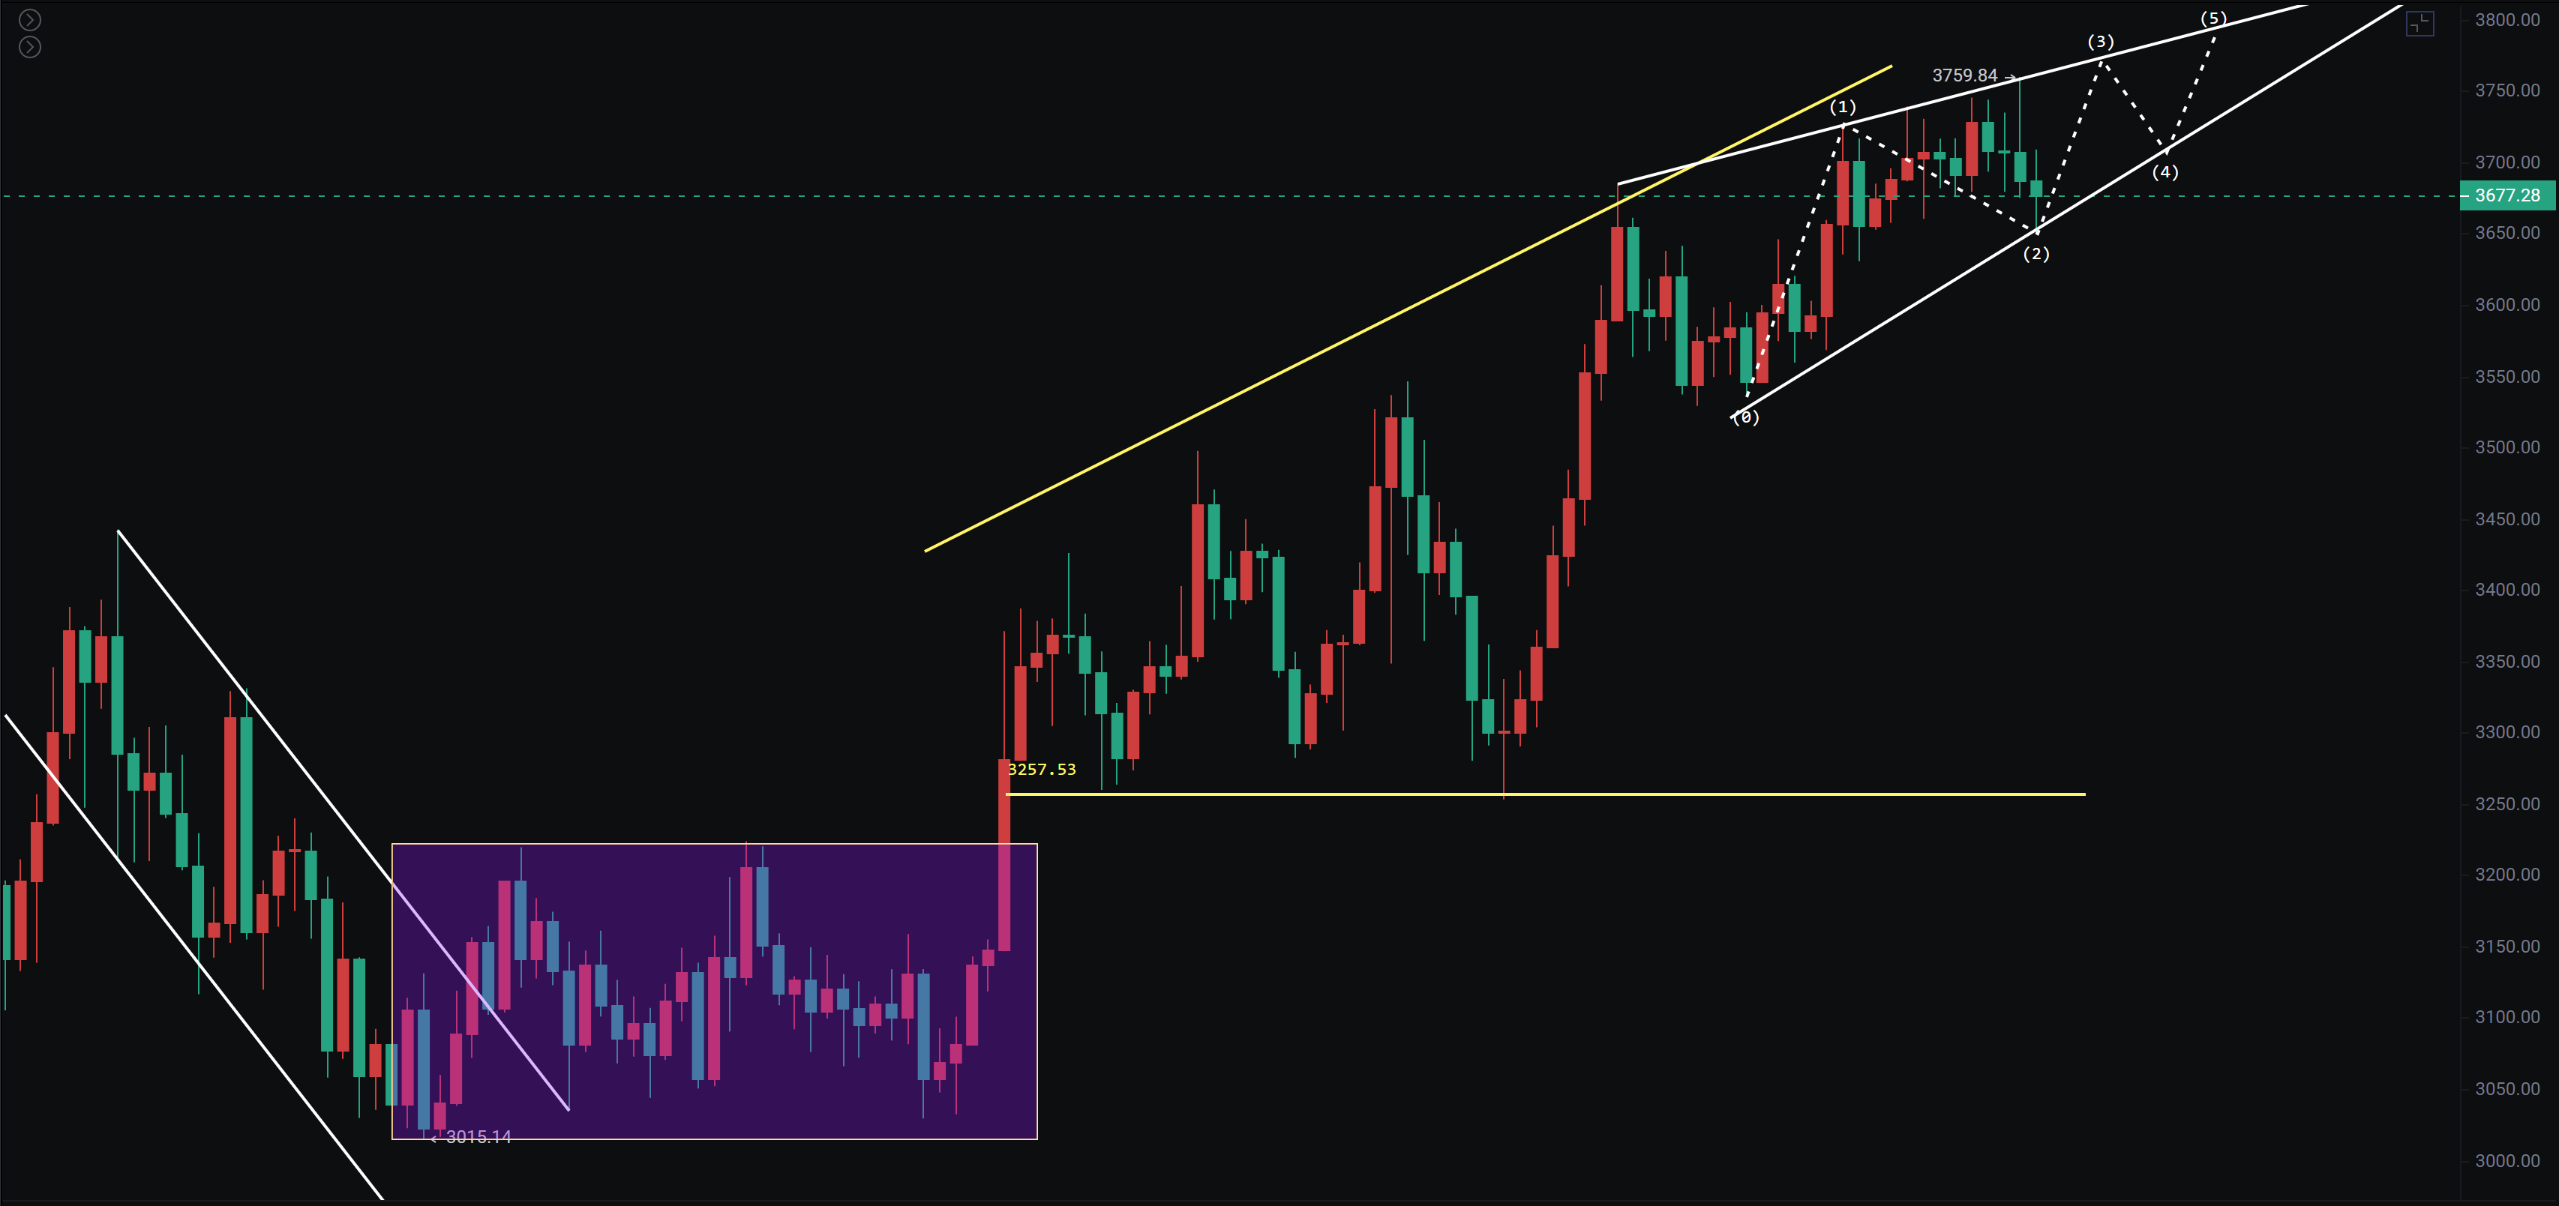
The daily chart for Ethereum is still within a spreading triangle, and the weekly daily line is just near the descending trend line from 4093 to 3980. If it cannot break through, it will need to pull back to around 3,500. The 4-hour chart has formed an upward wedge, and we need to be cautious of the probability of a downward breakout, with short-term support at 3,530 to 3,630.
Support: Pressure:

If you like my views, please like, comment, and share. Let's navigate through the bull and bear markets together!!!
The article is time-sensitive and for reference only, with real-time updates.
Focusing on K-line technical research, sharing global investment opportunities. Public account: Trading Prince Fusu

免责声明:本文章仅代表作者个人观点,不代表本平台的立场和观点。本文章仅供信息分享,不构成对任何人的任何投资建议。用户与作者之间的任何争议,与本平台无关。如网页中刊载的文章或图片涉及侵权,请提供相关的权利证明和身份证明发送邮件到support@aicoin.com,本平台相关工作人员将会进行核查。


