Historically, the most severe drawdowns often occur at the end of a bull market.
Author: David Canellis
Translation: Blockchain in Plain Language

The extreme volatility of Bitcoin has long taught us to "go with the flow."
We seem to have become accustomed to the expectation that even in a bull market that is surging forward, we are bound to encounter significant pullbacks that shatter our hopes, dreams, and wallet balances.
Therefore, it is entirely understandable that we think of Bitcoin suddenly plummeting 50% on its way to reaching six figures or even higher.
Is this expectation reasonable?
First, it is important to clarify that Bitcoin does indeed have a "tradition" of plummeting about 80% from the peak of a bull market to the trough of a bear market. This has been the case in almost every cycle since Bitcoin first experienced a significant rise in 2011.
However, this article does not discuss drawdowns during bear markets (for that, you can refer to our previous analysis). Instead, we will focus on the pullbacks during a bull market, such as the situation we are currently experiencing.
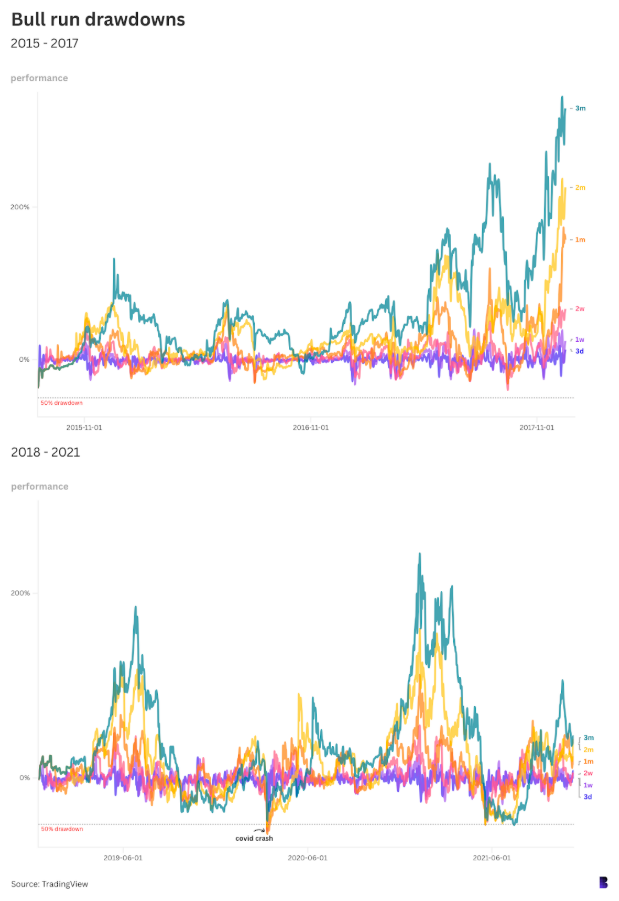
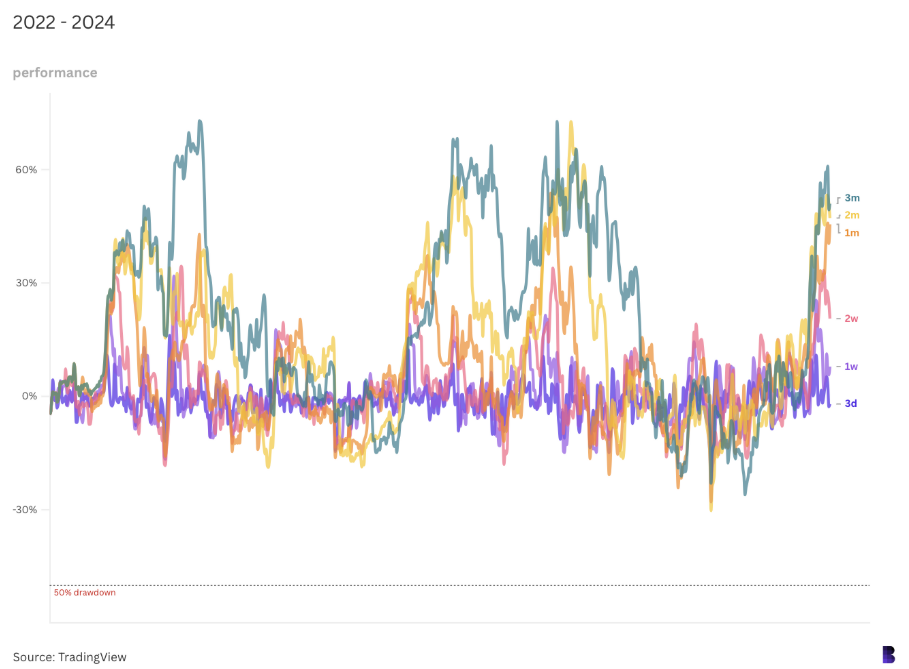
The chart below shows Bitcoin's price performance over six different time spans, ranging from three days to three months, presented in a rolling manner from the cycle's starting point (trough) to the historical high (peak).
Each line represents a time span. For example, the deep purple line indicates the percentage difference between each daily low and the opening price three days prior, while the green line represents a similar comparison over a three-month period.

The dashed line at the bottom represents the 50% drawdown level. As shown, during the bull market from August 2015 to December 2017, there was never such a significant drawdown.
During this period, the largest drawdown occurred near the end of September 2017, with a 40% drop over two weeks.
However, in the subsequent bull market from 2018 to 2021, there were three significant pullbacks exceeding 50%.
One of these occurred in March 2020, triggered by the pandemic, when the stock market experienced a series of "Black Mondays."
Bitcoin fell by 50% or more across almost all time spans, with the only exception being the three-month span, which was slightly below 50% at 47%.
The other two significant drawdowns occurred in May and July 2021, when Bitcoin dropped from over $60,000 to $30,000. However, in the following four months, Bitcoin quickly rebounded to nearly $69,000, a new high.

This time, the pullback has been relatively mild, with the most significant correction in the bull market occurring in the first week of August.
Bitcoin fell 30% across multiple time periods, dropping from a high of over $70,000 in June to a low of $49,200.
Of course, this does not mean that Bitcoin has lost its volatility. I still believe that future market conditions will continue to fluctuate.
It is worth noting that historically, the most severe drawdowns often occur at the end of a bull market.
Therefore, the longer a bull market lasts without significant pullbacks, the more unsettling the uncertainty about future trends becomes—this is also where the unique "thrill" of investing in Bitcoin lies.
Article link: https://www.hellobtc.com/kp/du/12/5564.html
Source: https://blockworks.co/news/bitcoin-bull-market-drawdowns
免责声明:本文章仅代表作者个人观点,不代表本平台的立场和观点。本文章仅供信息分享,不构成对任何人的任何投资建议。用户与作者之间的任何争议,与本平台无关。如网页中刊载的文章或图片涉及侵权,请提供相关的权利证明和身份证明发送邮件到support@aicoin.com,本平台相关工作人员将会进行核查。


