In the frequently fluctuating cryptocurrency market, investors often face the challenge of bottom fishing and peak escaping. To assist investors in seizing key opportunities during a bull market, AICoin Research Institute and Bitget Research Institute have jointly conducted a series of classic strategy studies aimed at helping users make informed decisions through in-depth analysis of core indicators, avoiding blind operations.
In this study, we focus on an important indicator that is widely used but often overlooked: OBV (On-Balance Volume). OBV combines trading volume with price changes, providing another perspective for interpreting market trends. Its uniqueness lies in the fact that OBV does not solely rely on price changes but incorporates changes in trading volume, offering signals for potential trend reversals. Both AICoin and Bitget platforms support the OBV indicator in their candlestick charts to assist investors in investment analysis.
Overall, OBV has the following classic uses: confirming trends, peak escaping and bottom fishing, and judging the behavior of major players. OBV is often used in conjunction with moving averages for market predictions, with price moving averages to find key breakout points, and with volume moving averages to identify institutional entry.
1. Usage Methods
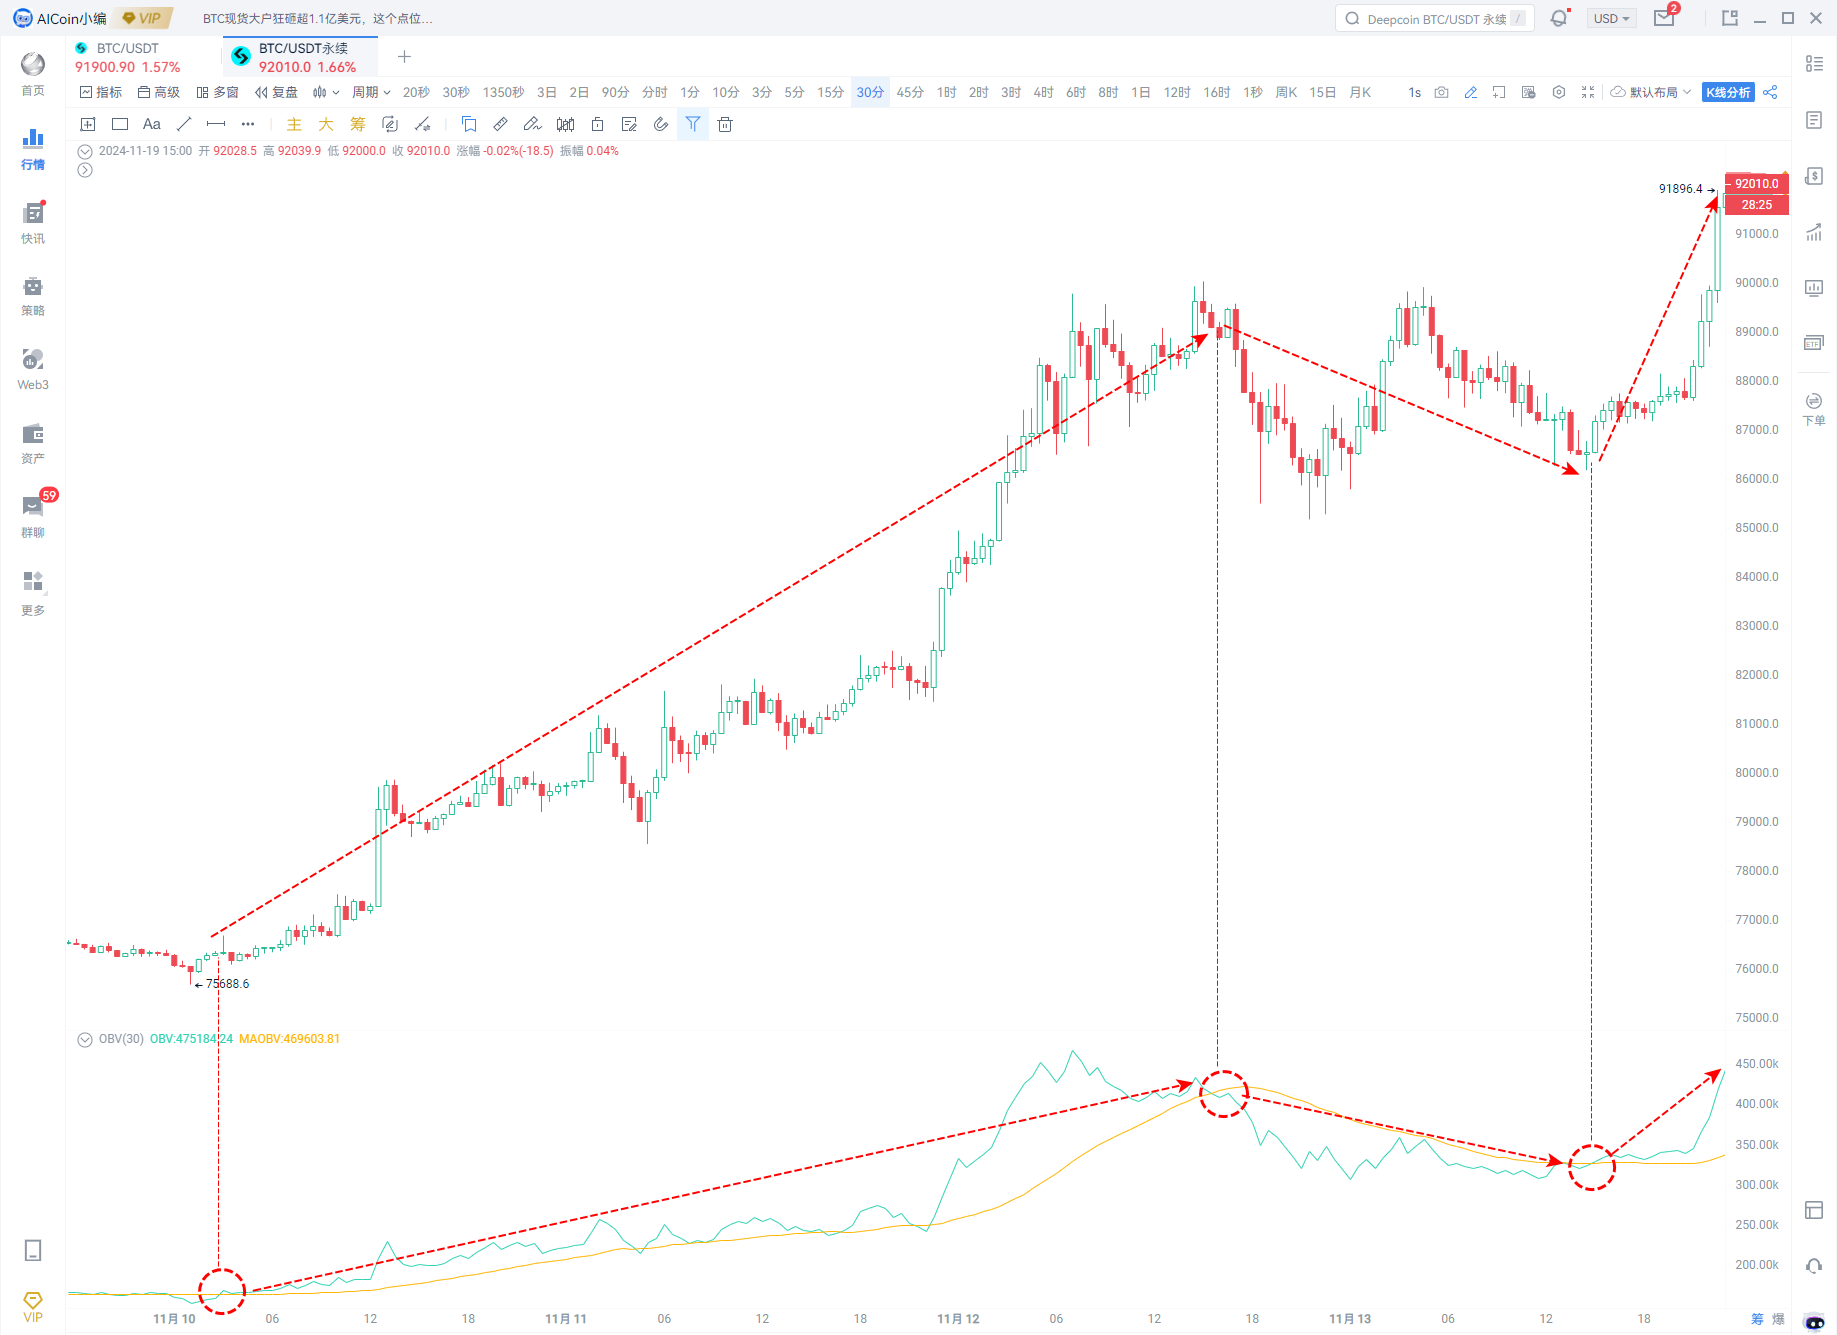
(1) Confirming Trends
● Uptrend: OBV rises as the price increases, indicating strong bullish momentum.
● Downtrend: OBV declines as the price decreases, indicating strong bearish momentum.
(2) Judging Major Player Behavior
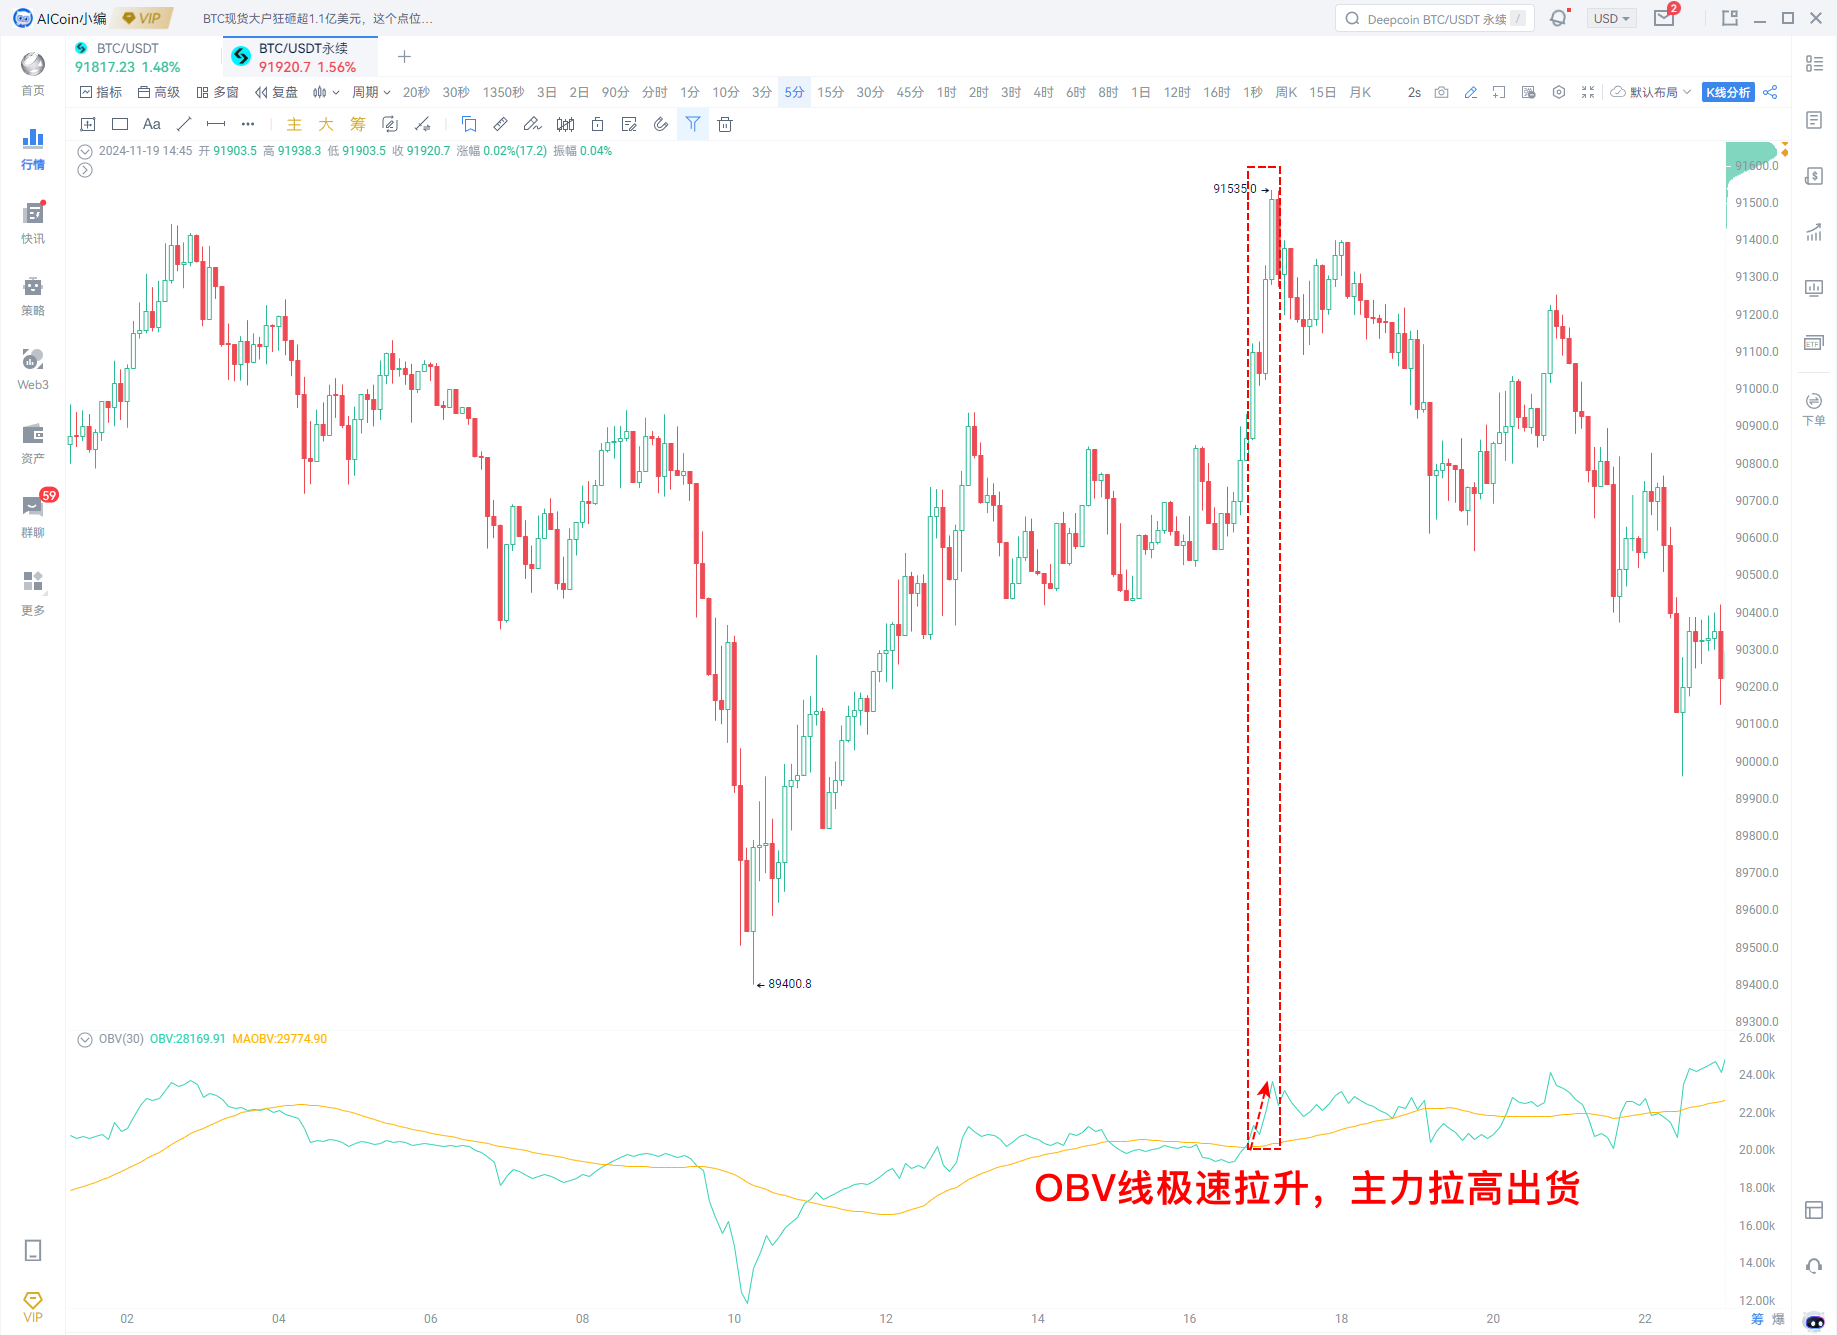
1. Major Players Pumping and Dumping
When the OBV line rises sharply, it indicates that buying power is about to be exhausted, and major players are pumping up to escape, which is considered a sell signal. If this occurs in the later stages of a trend, the effect is more pronounced.
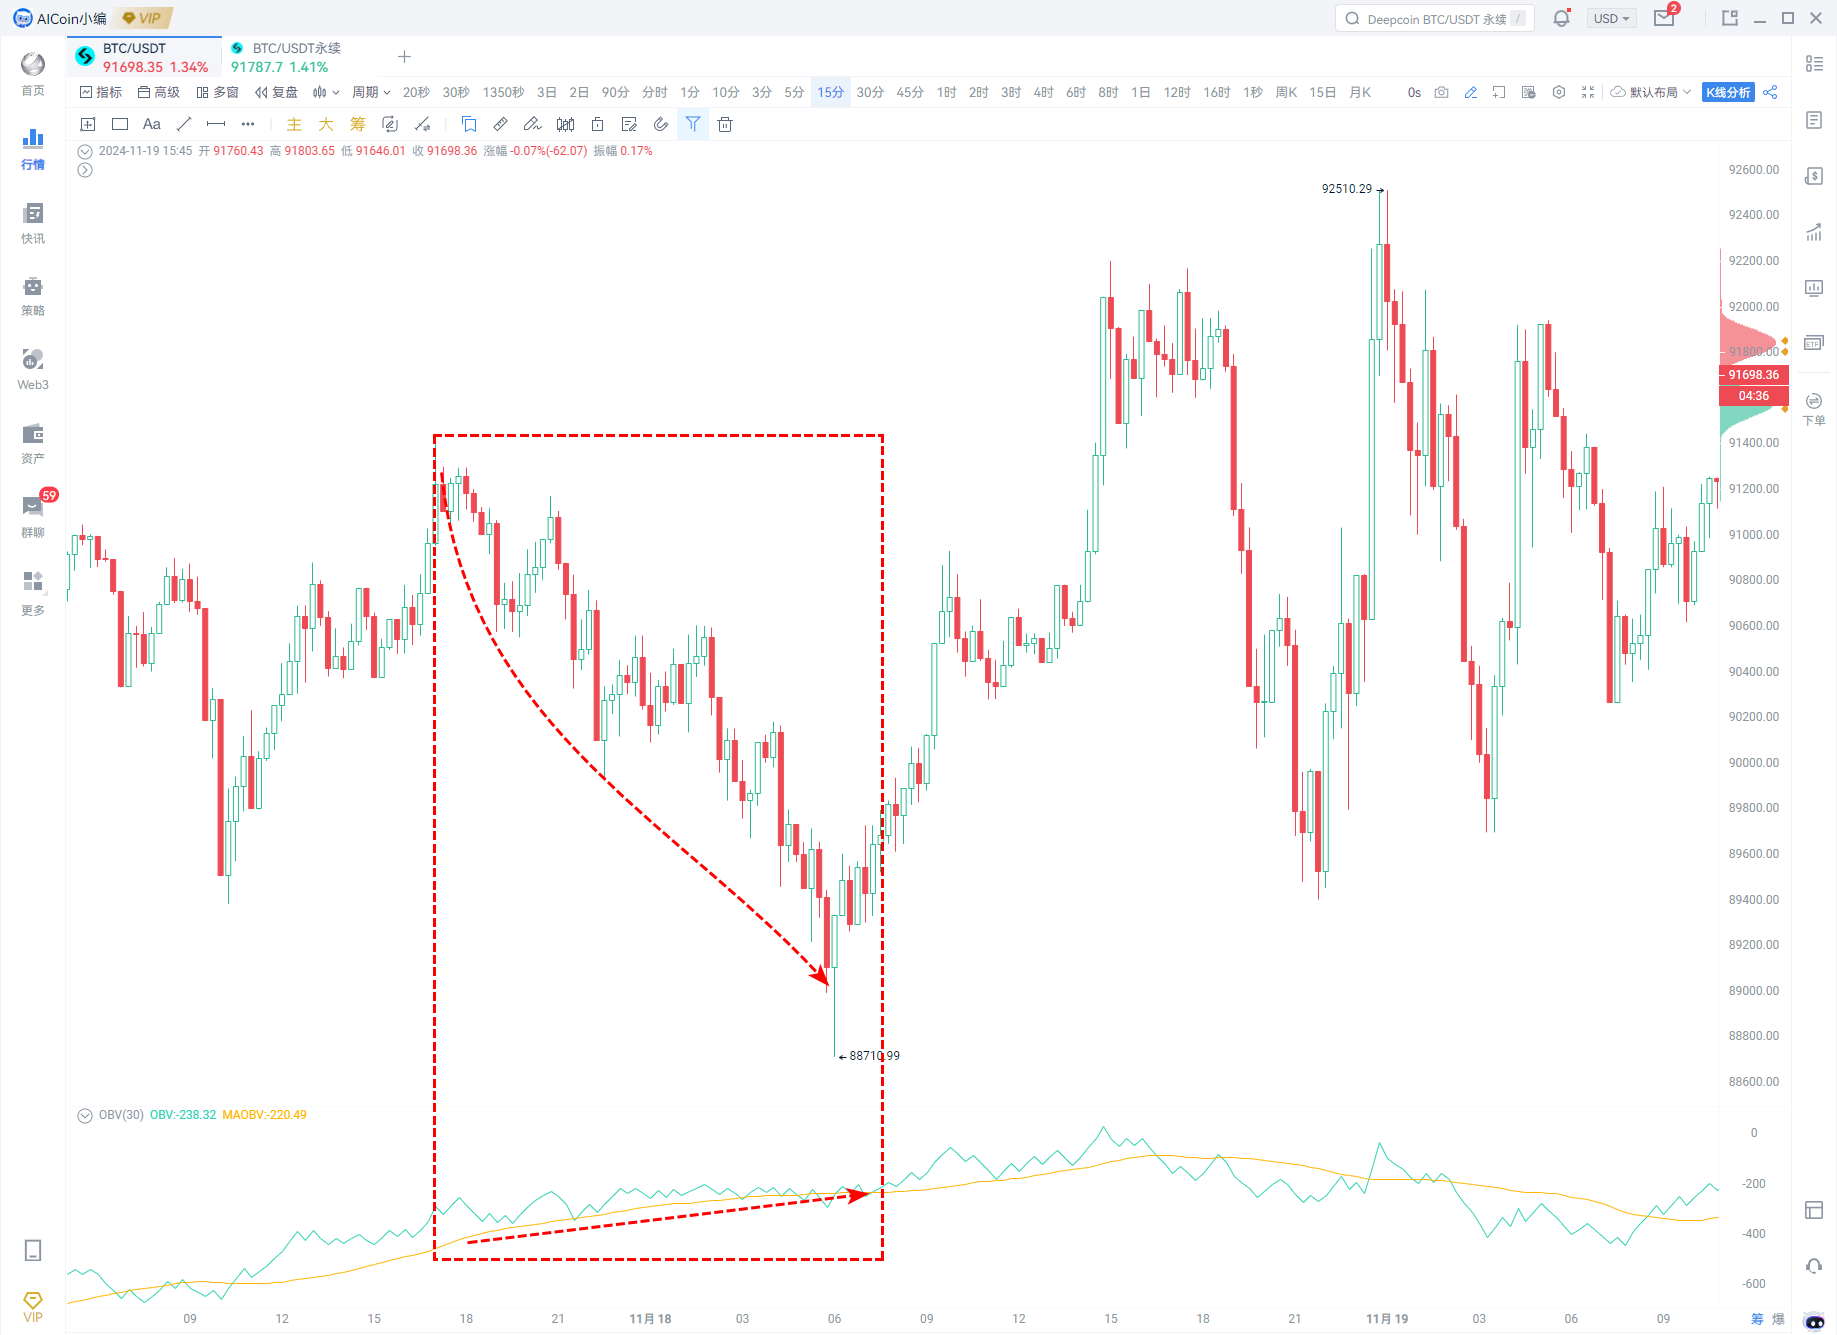
2. Major Players Pressing the Market
When the price declines but OBV rises, it indicates strong buying pressure, suggesting that major players are buying on dips, and the price may stop falling and rebound.
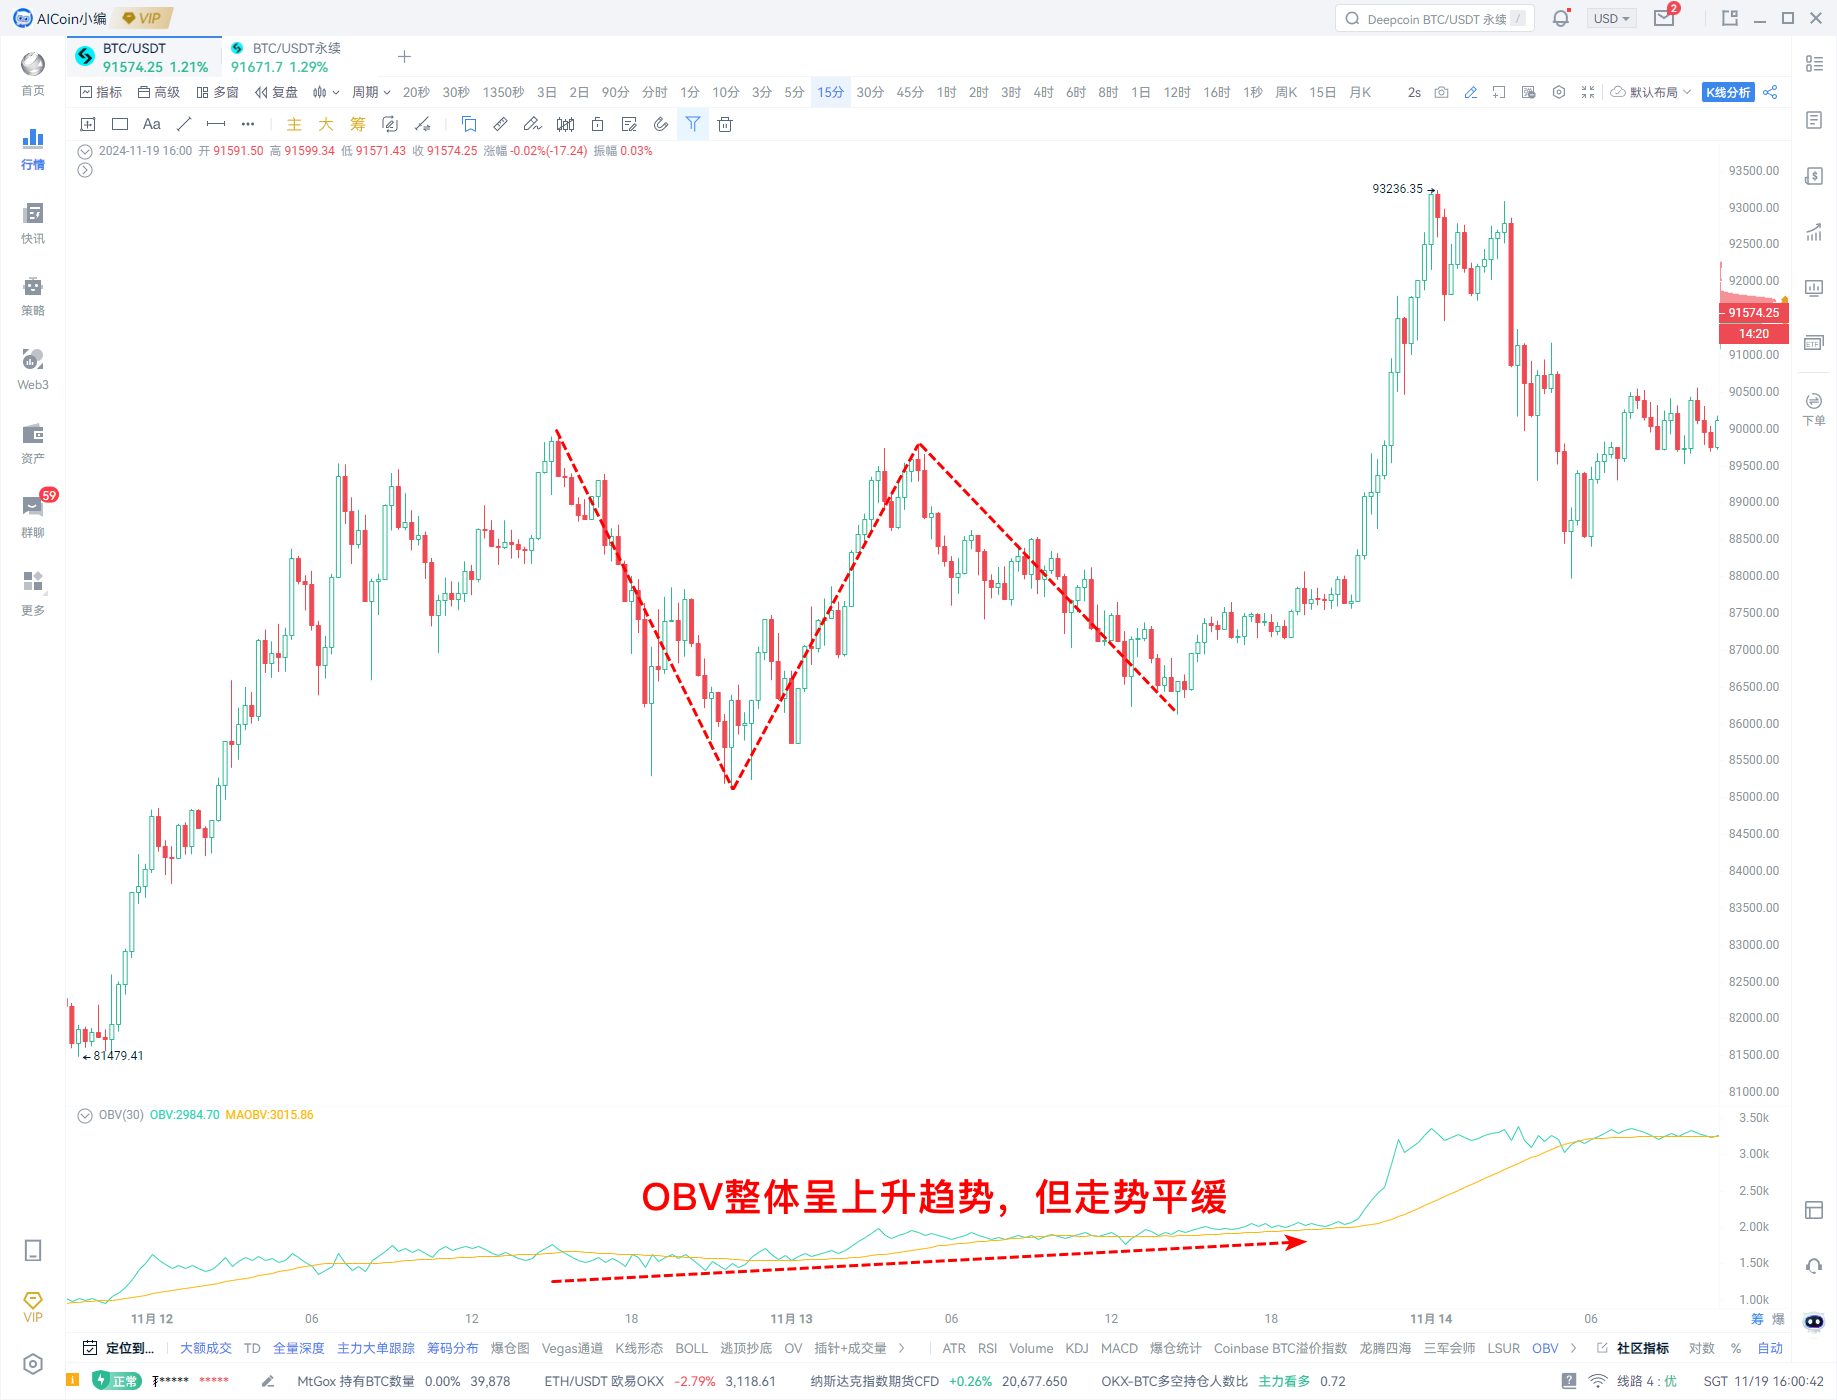
3. Major Players Washing Out
When the OBV line rises slowly but the price fluctuates violently, it indicates that buying power is gradually strengthening, which can be seen as a buy signal.
(3) Using in Conjunction with Other Indicators
1. Using with Moving Averages
Moving averages can be simple moving averages, and specific moving averages and parameters can be adjusted based on personal viewing habits. Taking EMA52 + OBV as an example:
When OBV rises while the price remains above the EMA52 moving average, it is considered a bullish trend;
When OBV falls from a high point while the price drops below and remains below the moving average, it is considered a bearish trend.
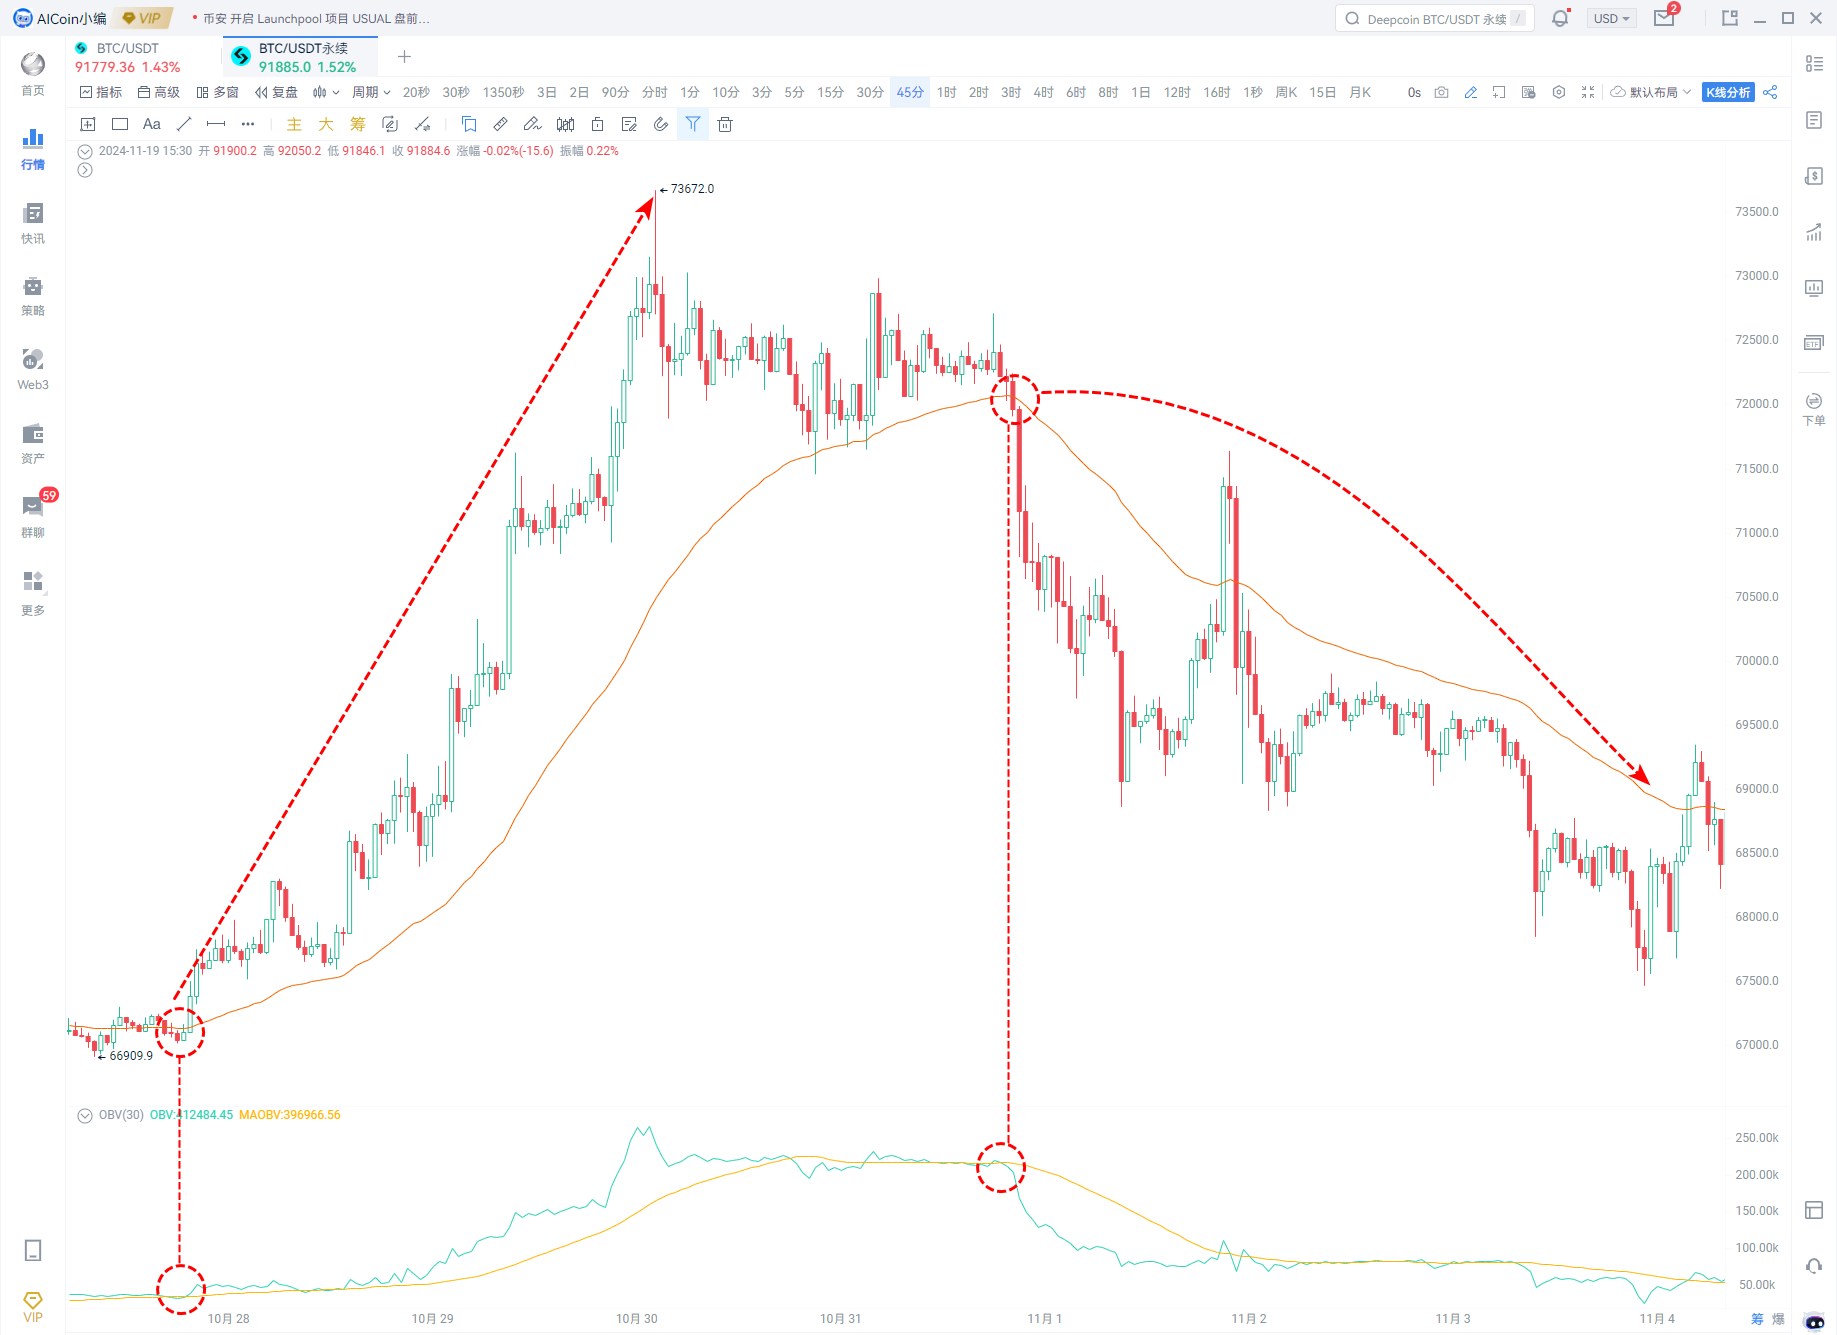
2. Breaking Key Support and Resistance
Buy Signal: Breaking through resistance or retracing without breaking support, while OBV breaks through, is considered a bullish signal.
Sell Signal: Falling below support or attempting to rise without breaking resistance, while OBV falls below, is considered a bearish signal.
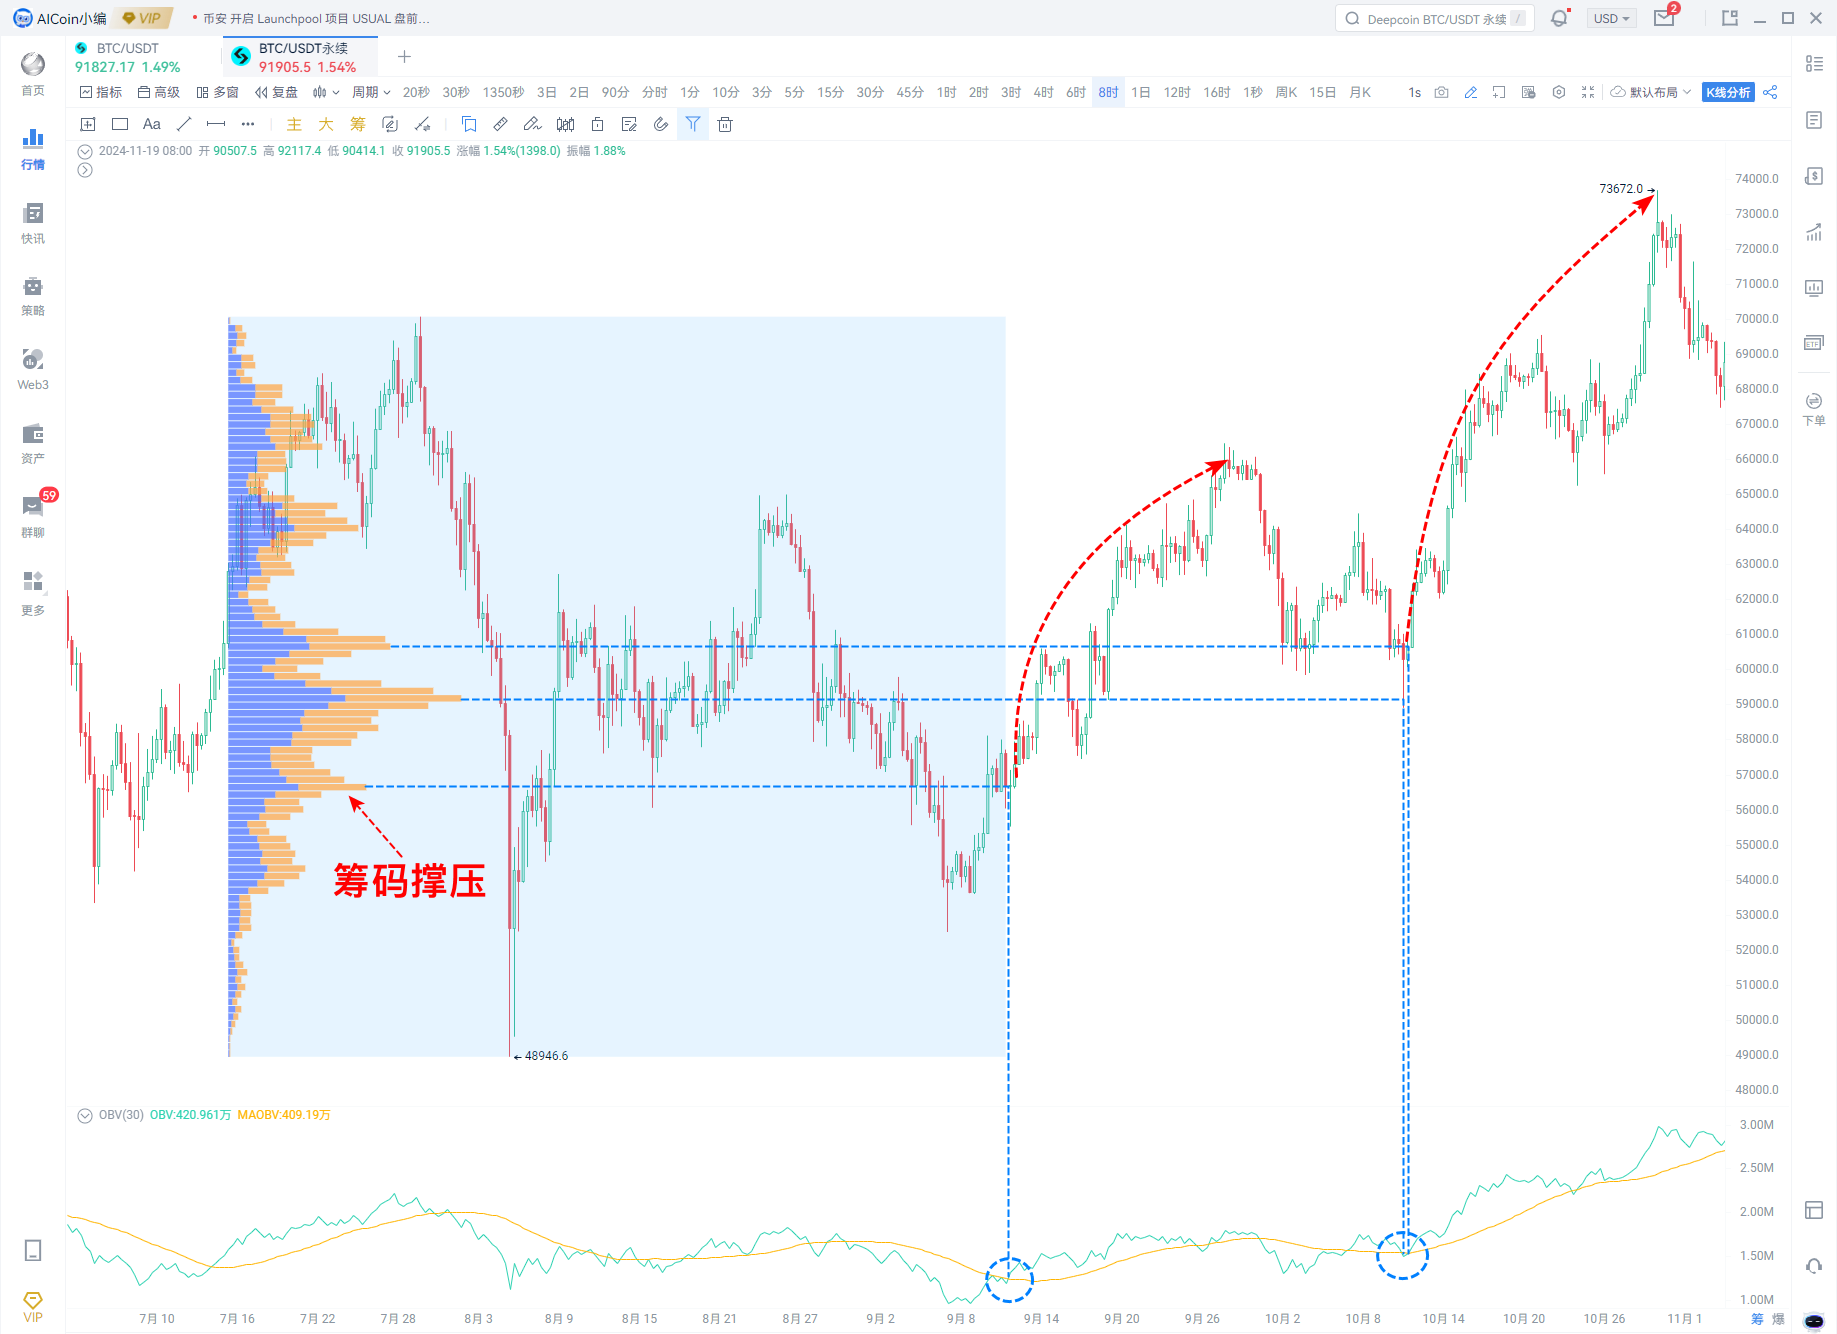
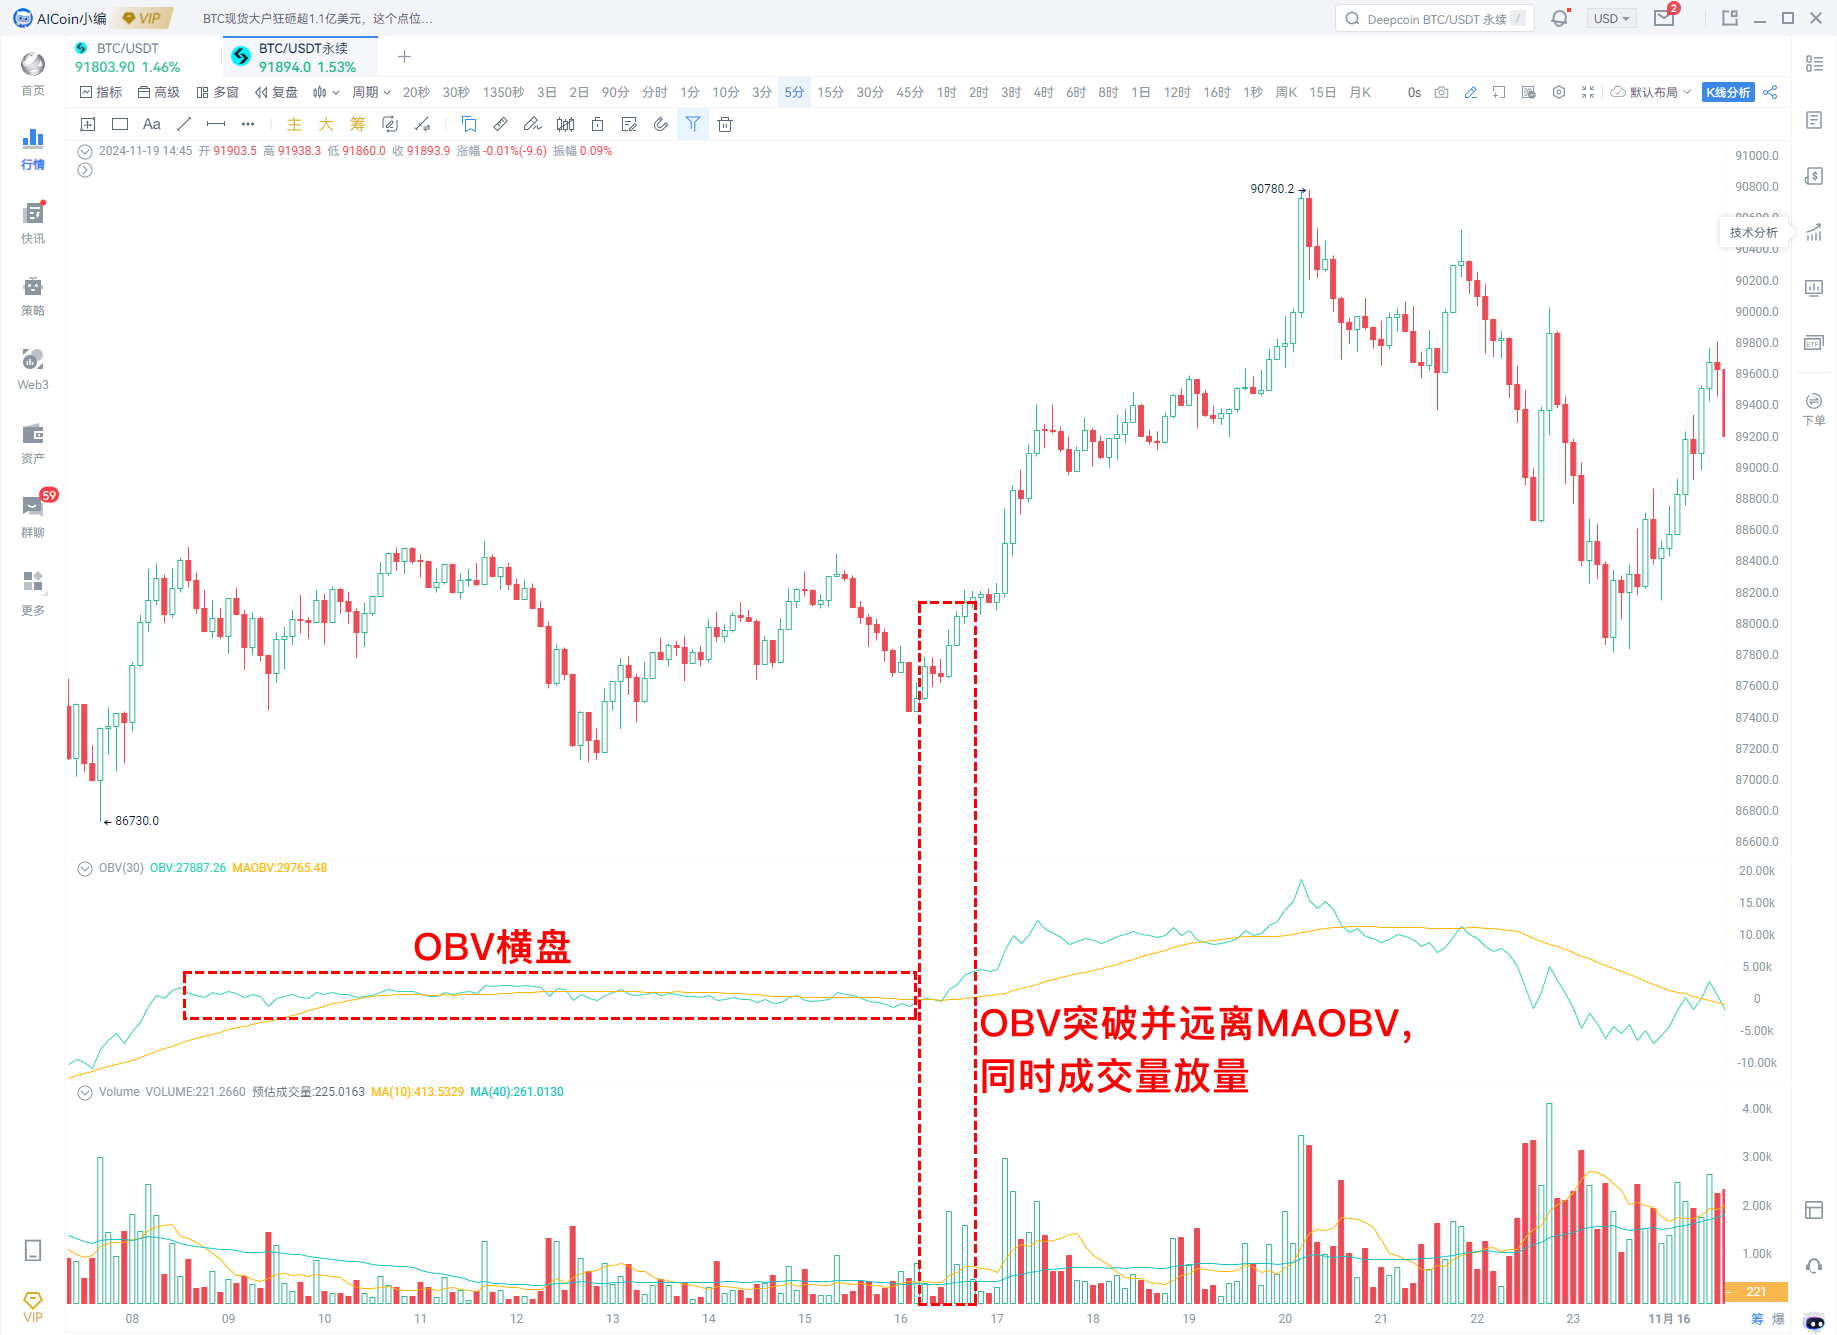
3. Using with Trading Volume
a. Trading Volume
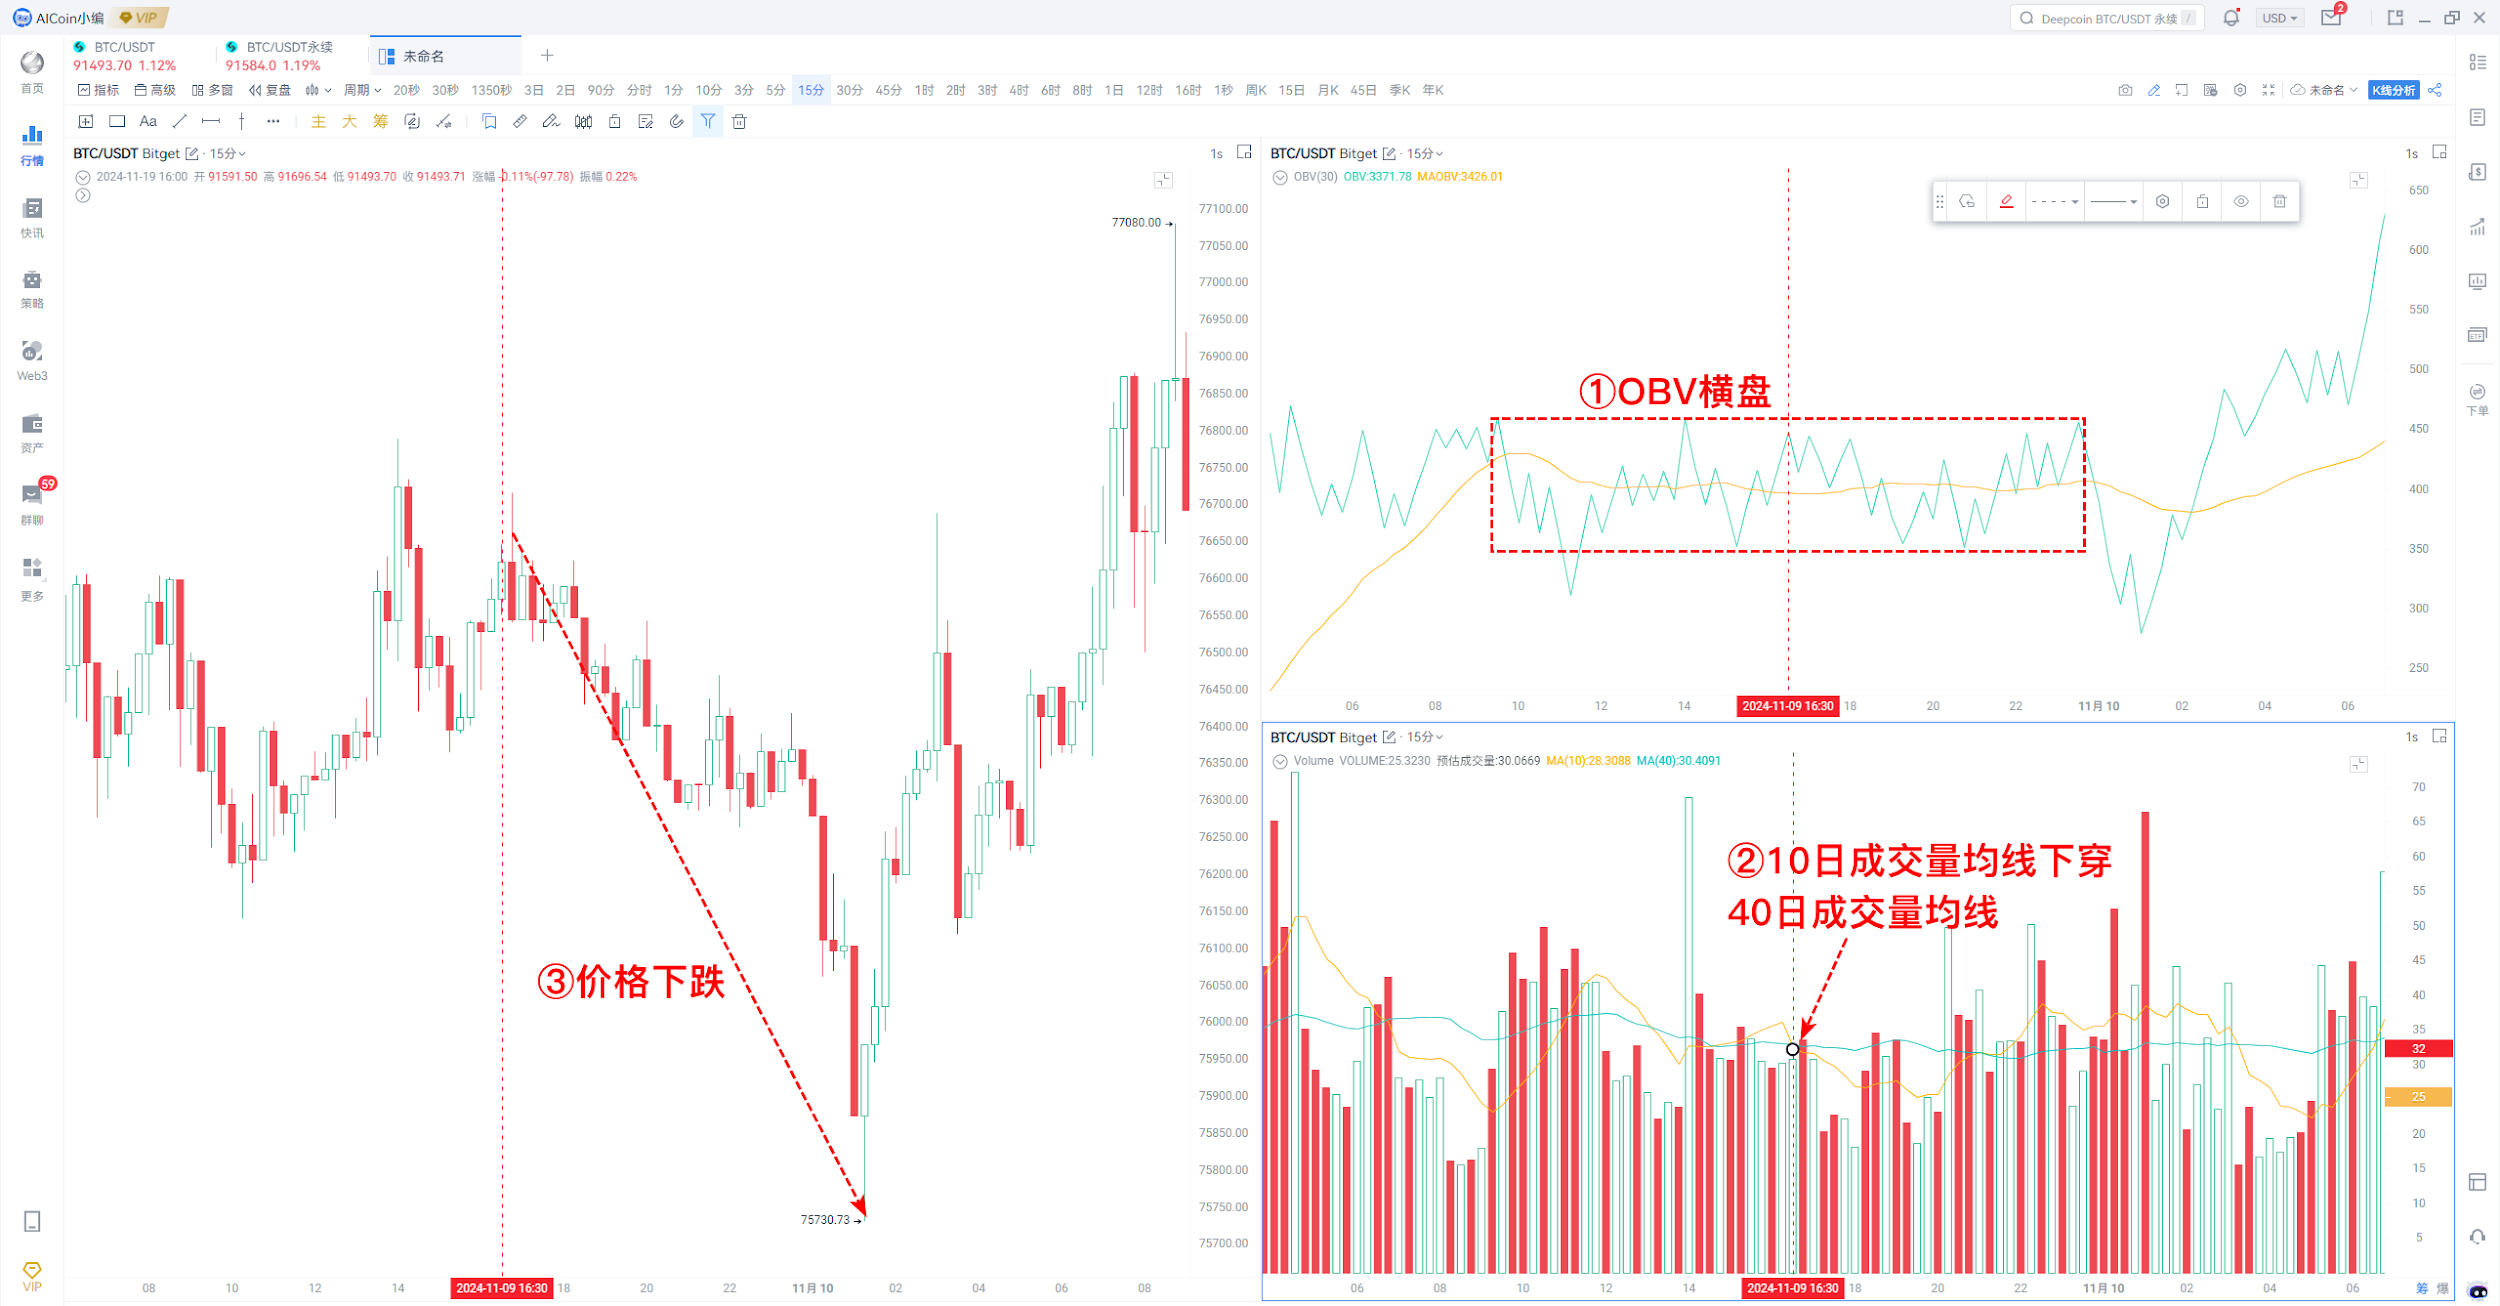
After OBV consolidates for a period, breaking through MAOBV while trading volume increases is a good buying opportunity.
b. Volume Moving Average
Volume moving averages can be defined as MA10, MA40, and specific parameters can be defined based on personal habits.
Buy Signal: OBV rises, and the 10-day moving average crosses above the 40-day moving average.
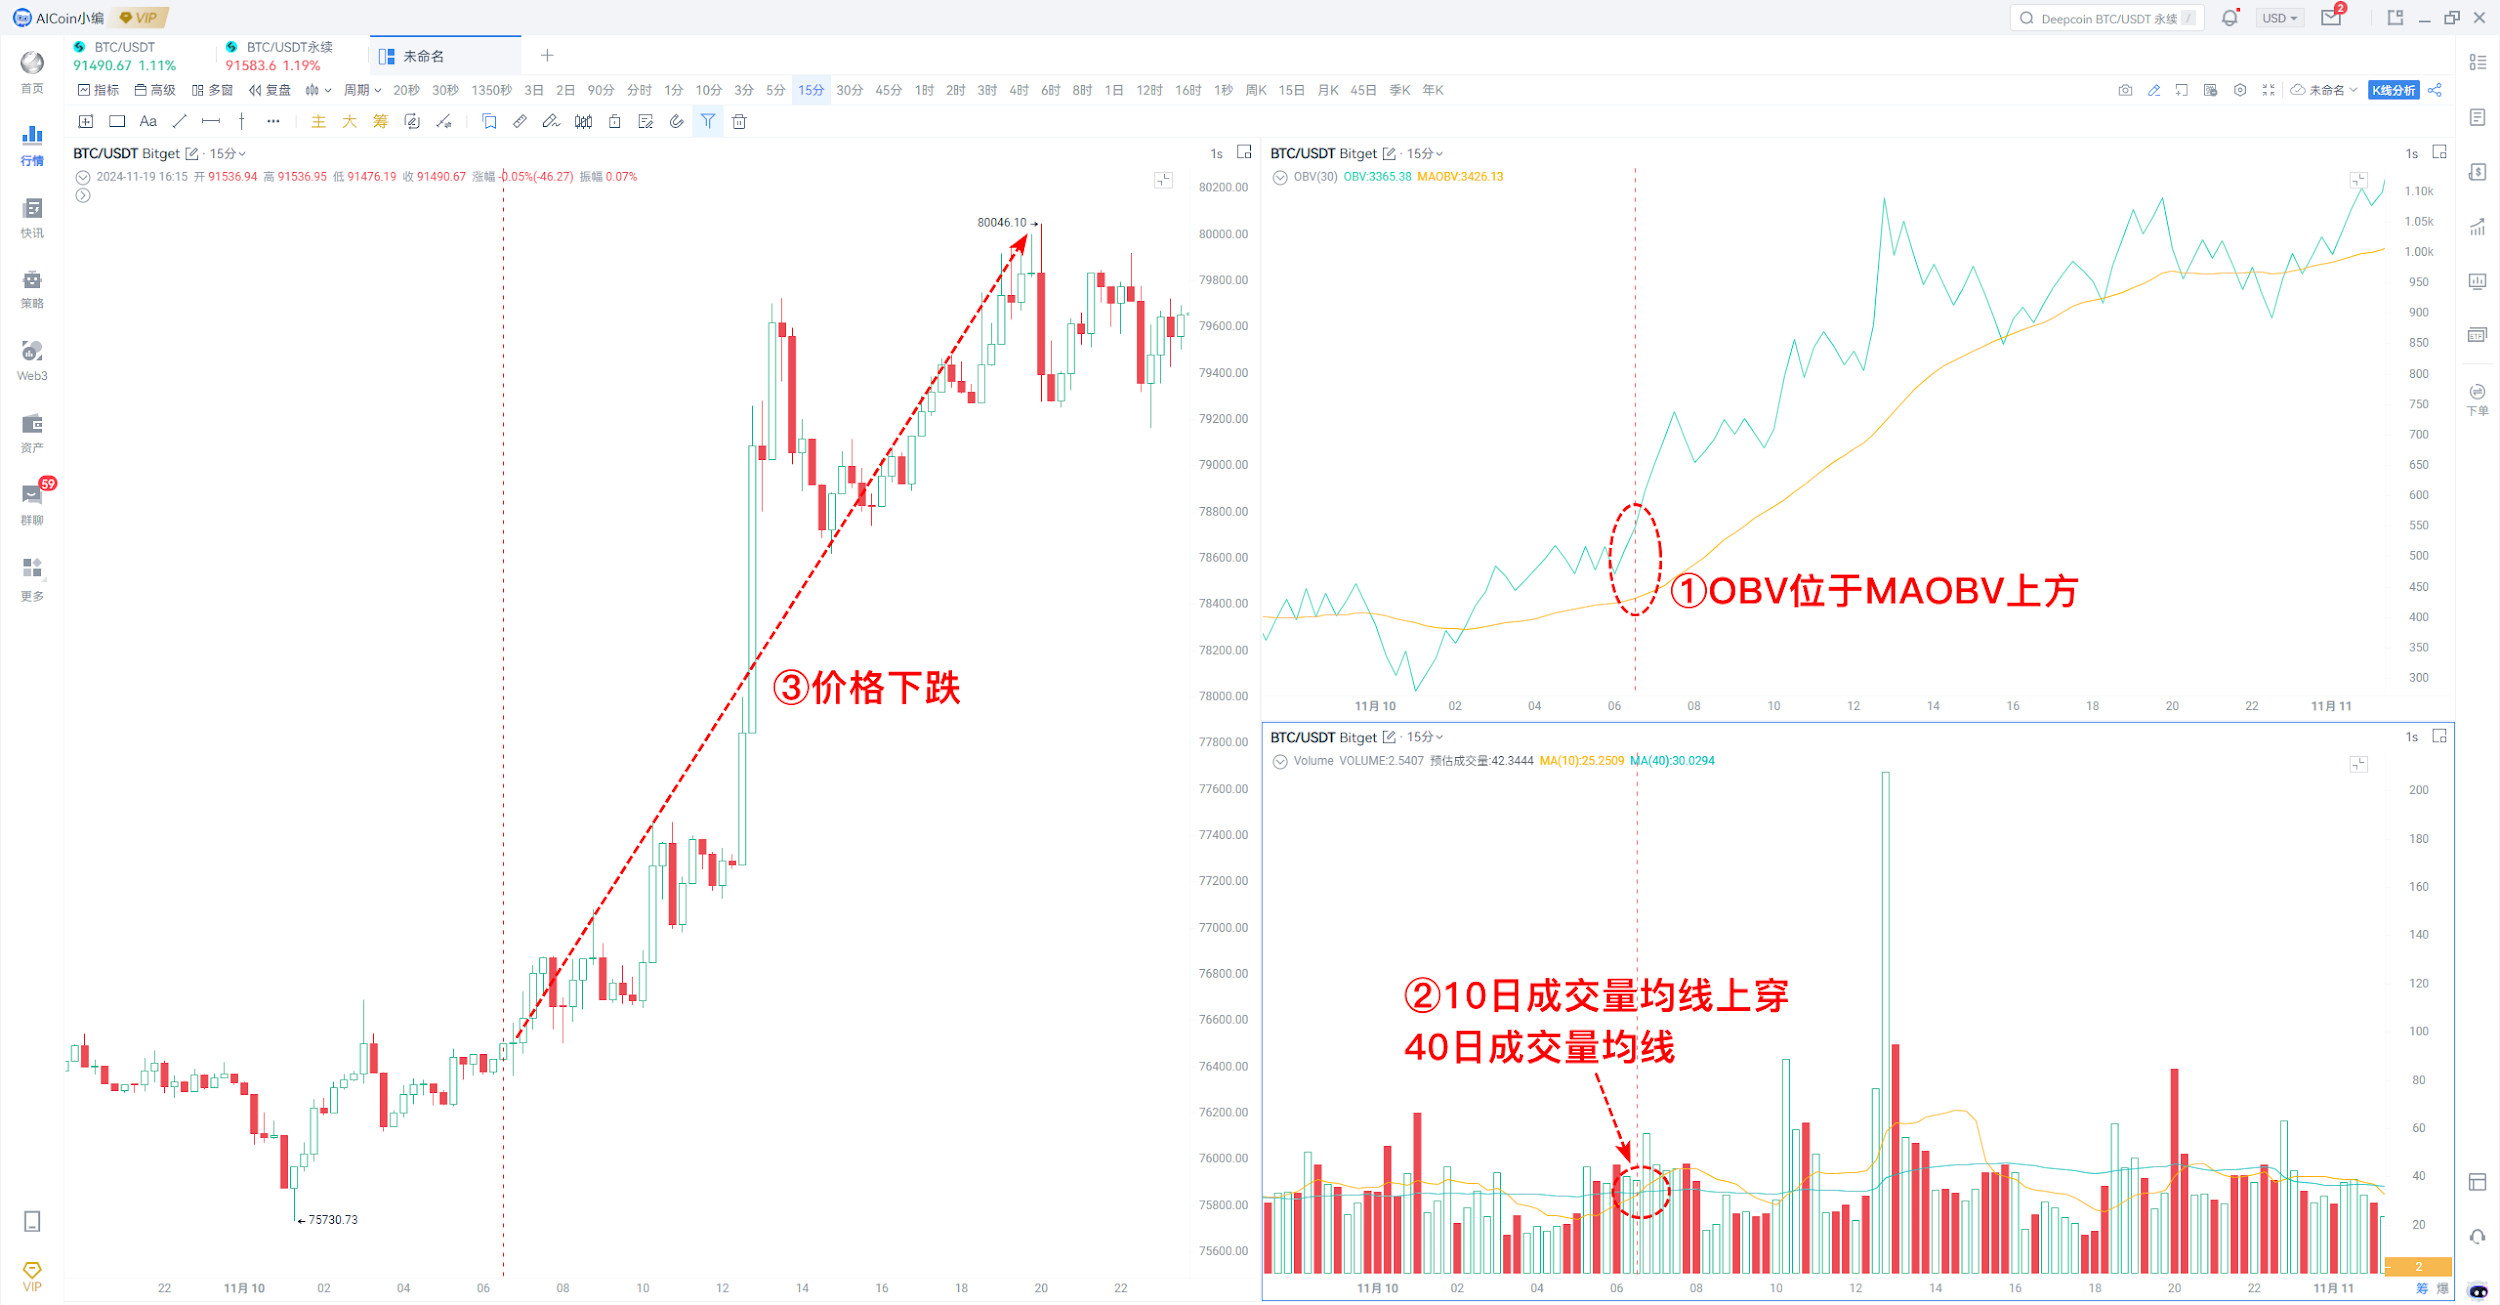
Sell Signal: OBV is in a non-trending state, and the 10-day moving average crosses below the 40-day moving average.
2. Peak Escaping and Bottom Fishing
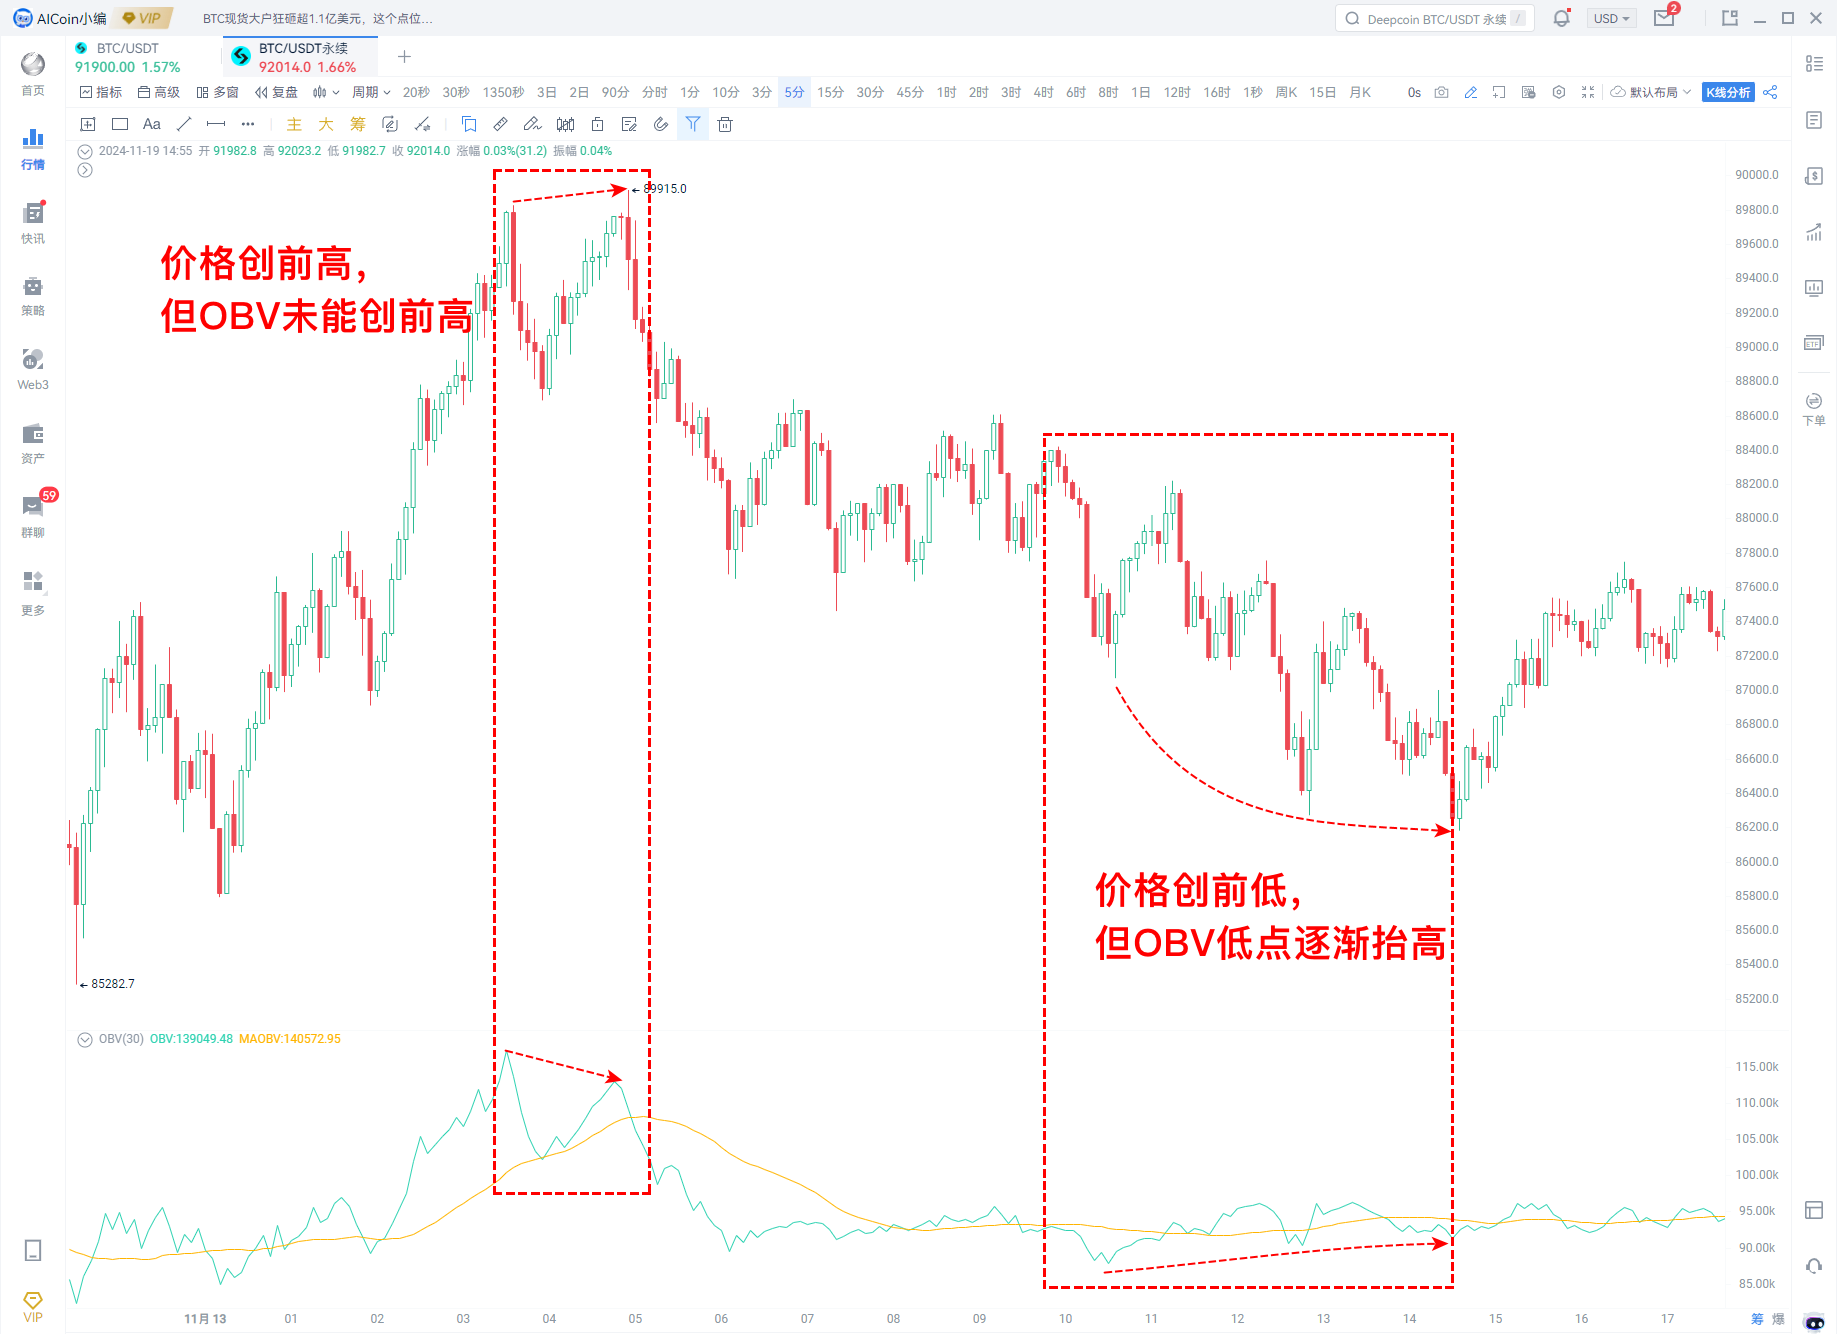
1. Bottom Fishing - OBV Bottom Divergence
Description: The price creates a new low, while OBV fails to create a new low.
Interpretation: Selling pressure weakens, and the downward force in the market is insufficient, usually indicating that the price may reverse upwards, which can be seen as a signal. OBV demonstrates strong capability in identifying bottom fishing signals. When the price is in a downtrend, if OBV does not create a new low, known as "low divergence," it usually indicates that the downward momentum is weakening, and bottom fishing opportunities may arise.
2. Peak Escaping - OBV Top Divergence
Description: The price creates a new high, while OBV fails to create a new high.
Interpretation: The price is rising, but trading volume has not increased, indicating that bullish momentum is weakening, usually signaling that the price may pull back, which can be seen as a sell or reduction signal. Similar to capturing bottom signals, when the price creates a new high but OBV does not correspondingly create a new high, a high divergence occurs, which may indicate that the upward momentum is fading, serving as a signal for investors to consider exiting. In the top region of a bull market, investors are often easily swayed by market sentiment, and abnormal changes in OBV can serve as a warning, helping investors decide whether to reassess their holding strategies.
3. OBV Indicator Backtesting
This period conducts backtesting on the OBV indicator using three models:
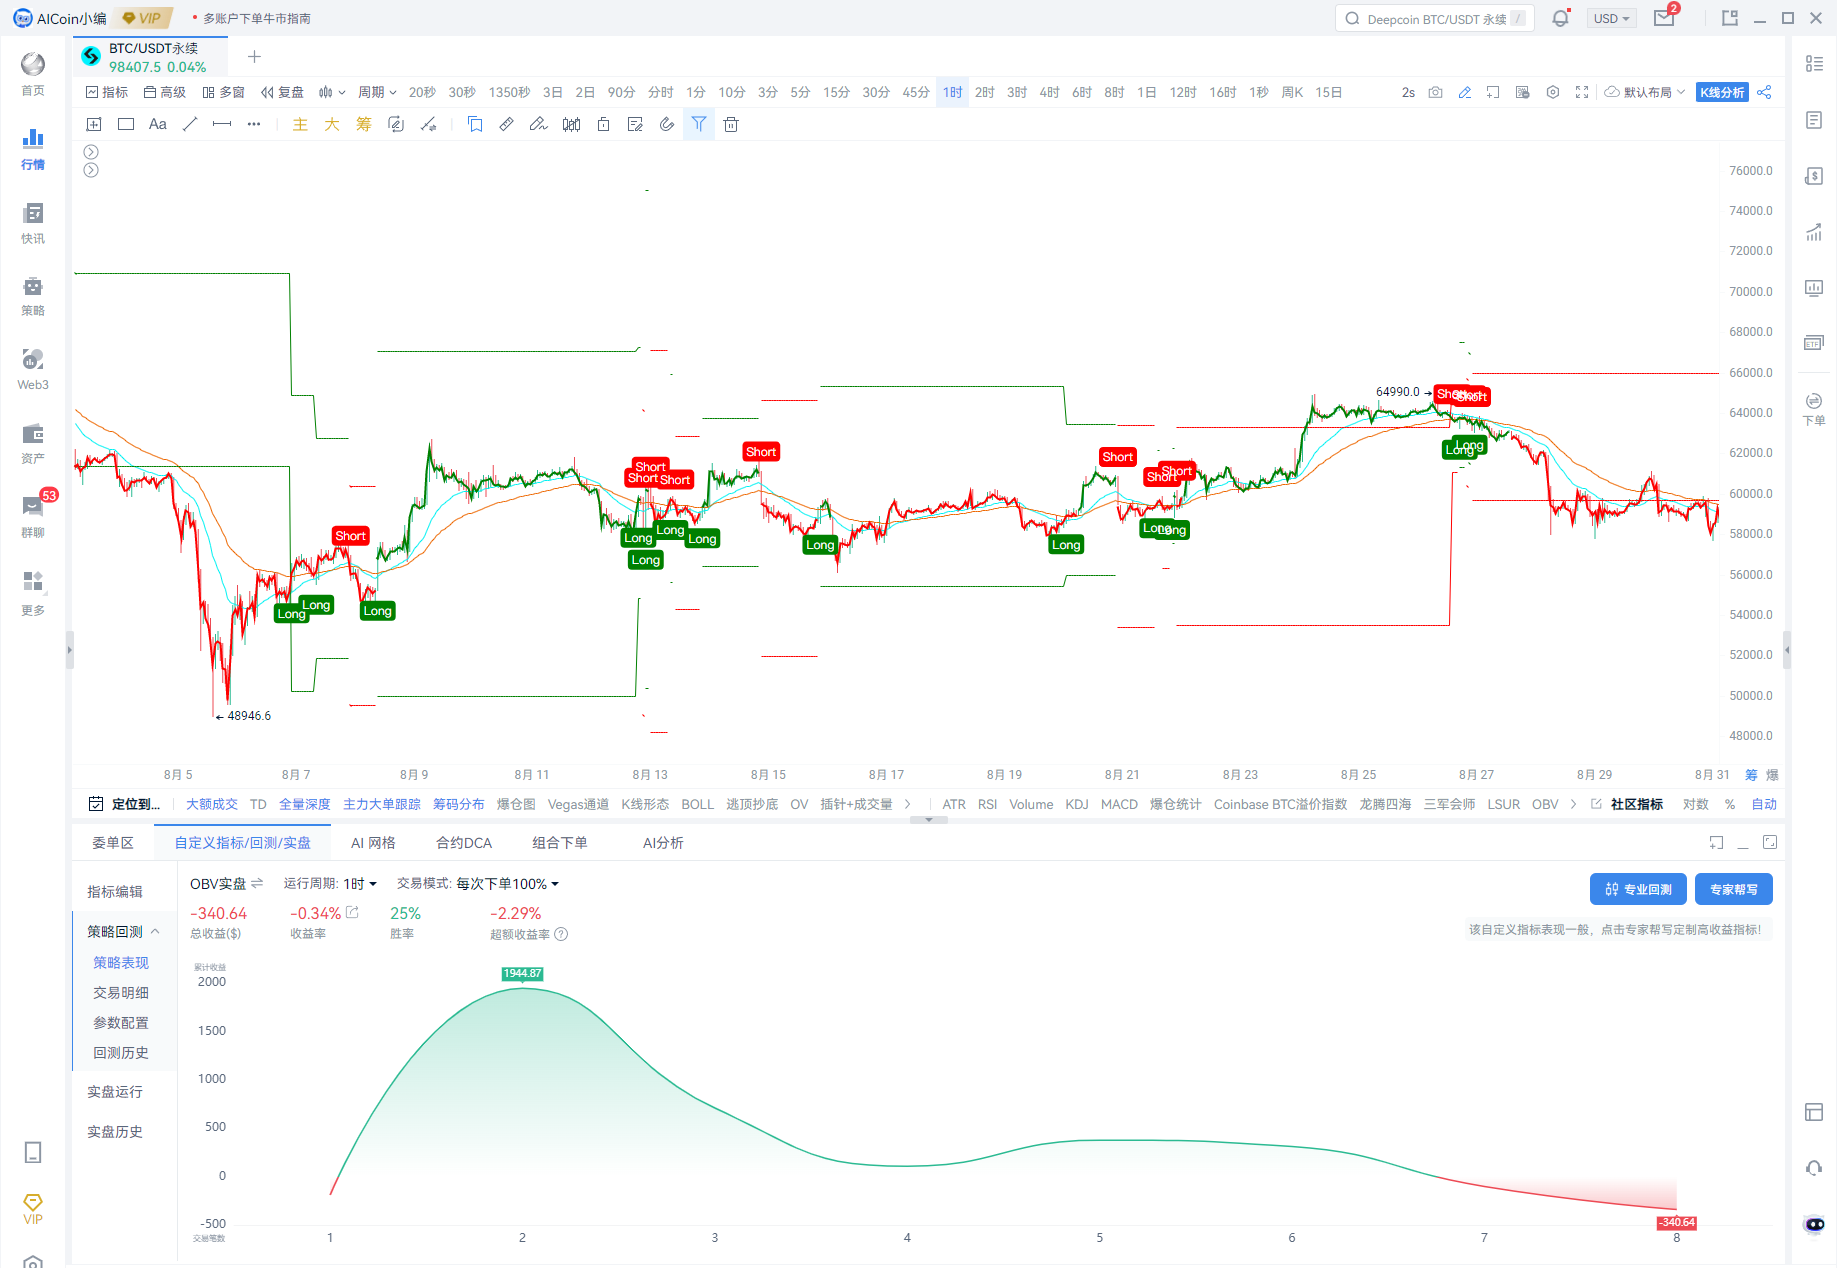
Model 1: OBV Bottom Fishing and Peak Escaping Signals in a 1h Consolidation Period
Win Rate: 20%, Return Rate: -0.34%
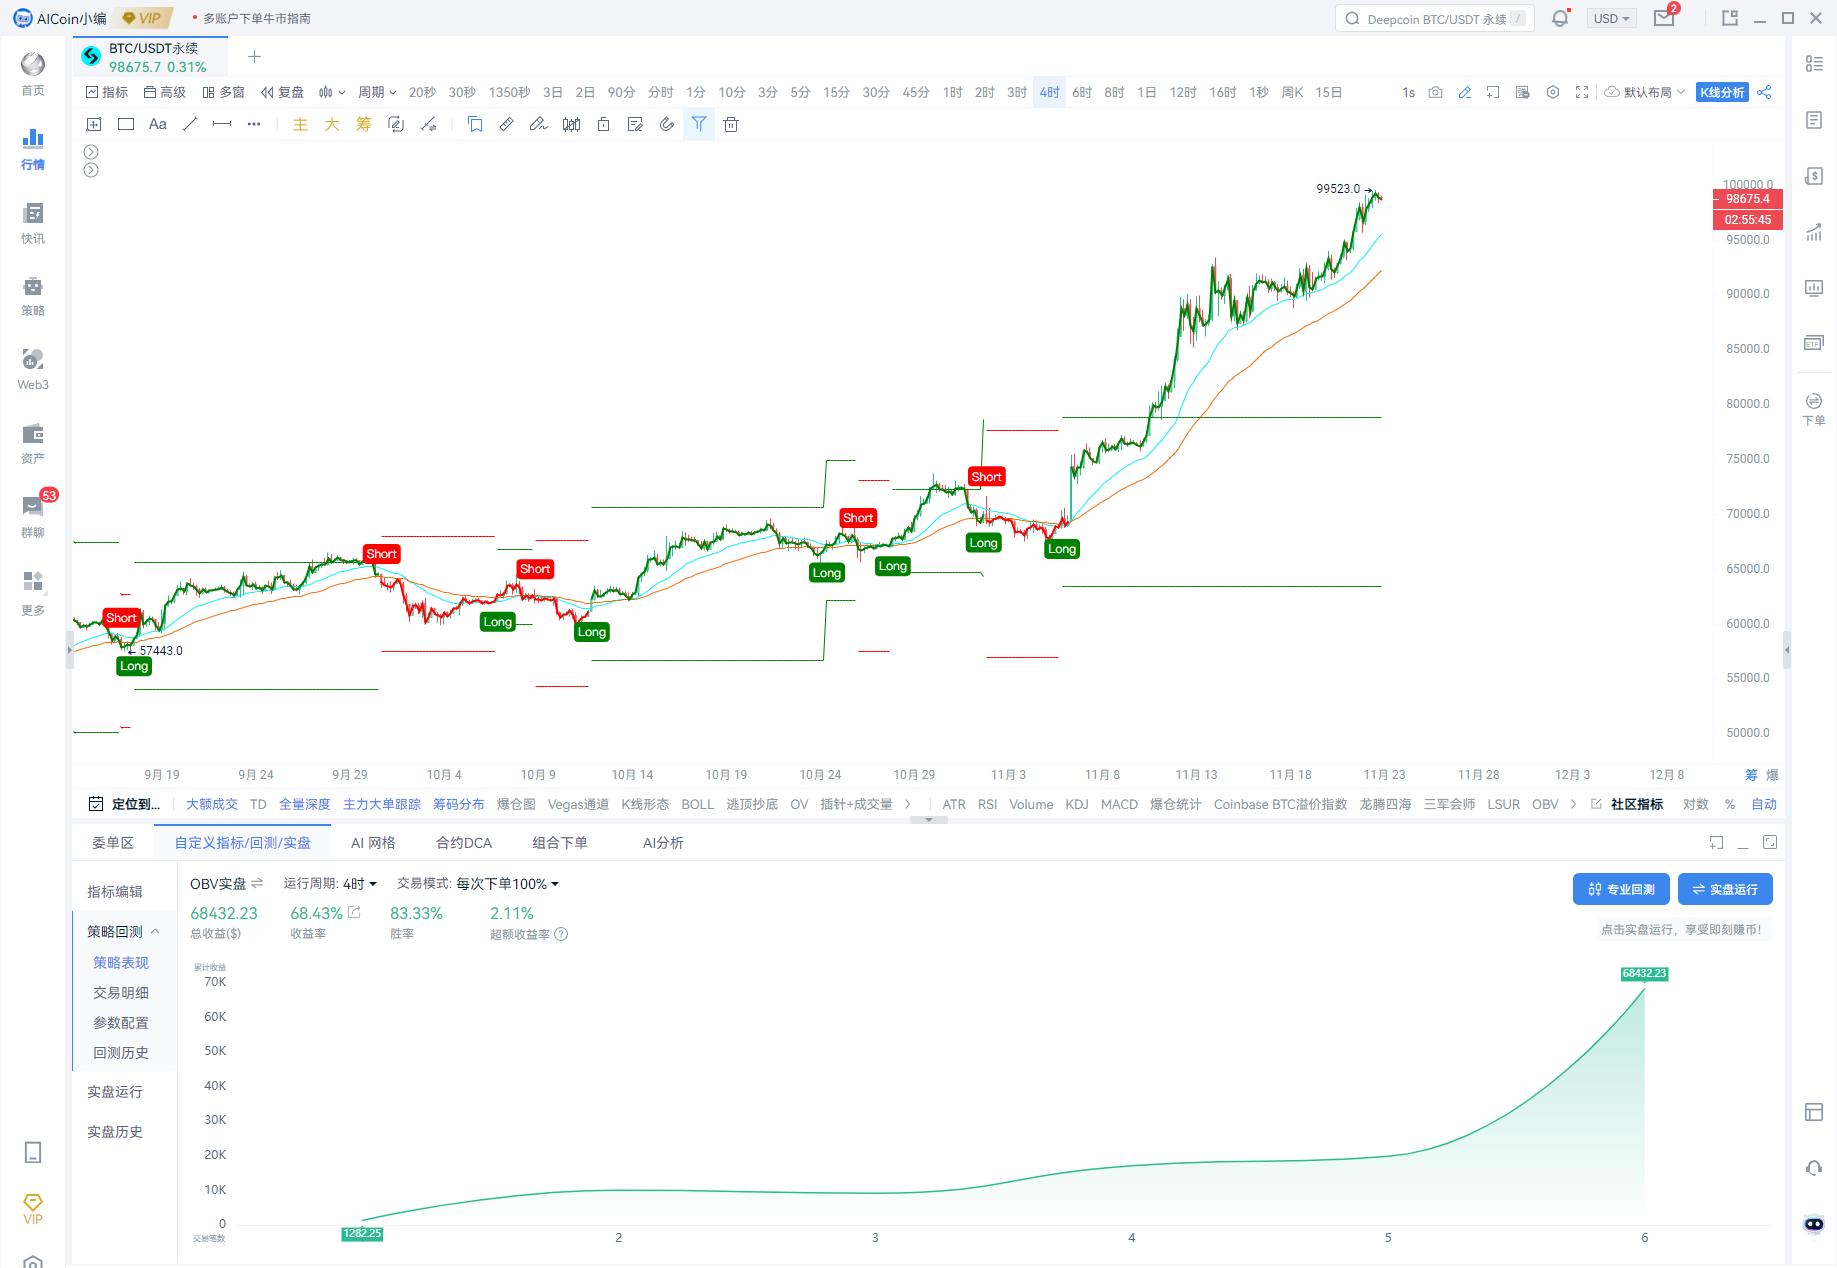
Model 2: OBV Bottom Fishing and Peak Escaping Signals in a 4h Uptrend
Win Rate: 83.33%, Return Rate: 68.43%
Model 3: OBV Bottom Fishing and Peak Escaping Signals in a 4h Downtrend
Insufficient data, not included in statistics.
According to AICoin backtesting, the OBV indicator is suitable for upward trends, with many signals and relatively stable win rates and return rates.
Note: The underlying logic of the above strategies is based on OBV + EMA52 moving average.
4. Analysis and Summary
In summary, the OBV indicator has significant application value in the dynamic cryptocurrency market. Investors should flexibly apply OBV strategies based on different market conditions:
● Bottom Fishing Timing: When the price creates a new low while OBV does not create a new low, forming a bottom divergence signal, this indicates weakened selling pressure and presents a good buying opportunity.
● Peak Escaping Timing: When the price creates a new high while OBV fails to create a new high, forming a top divergence signal, this indicates weakened bullish momentum, and investors may consider reducing positions or closing to avoid potential risks.
● Confirming Trends: OBV changes with price trends, effectively discerning market strength and weakness.
Through this joint research, we hope that users can master the techniques of using the OBV indicator to capture bottom fishing and peak escaping, enhancing trading efficiency in a bull market. In the future, AICoin and Bitget will continue to collaborate, exploring the application of more classic strategies to provide investors with more valuable market insights, helping them progress steadily in the cryptocurrency market.
About AICoin OBV Indicator and Custom Indicators
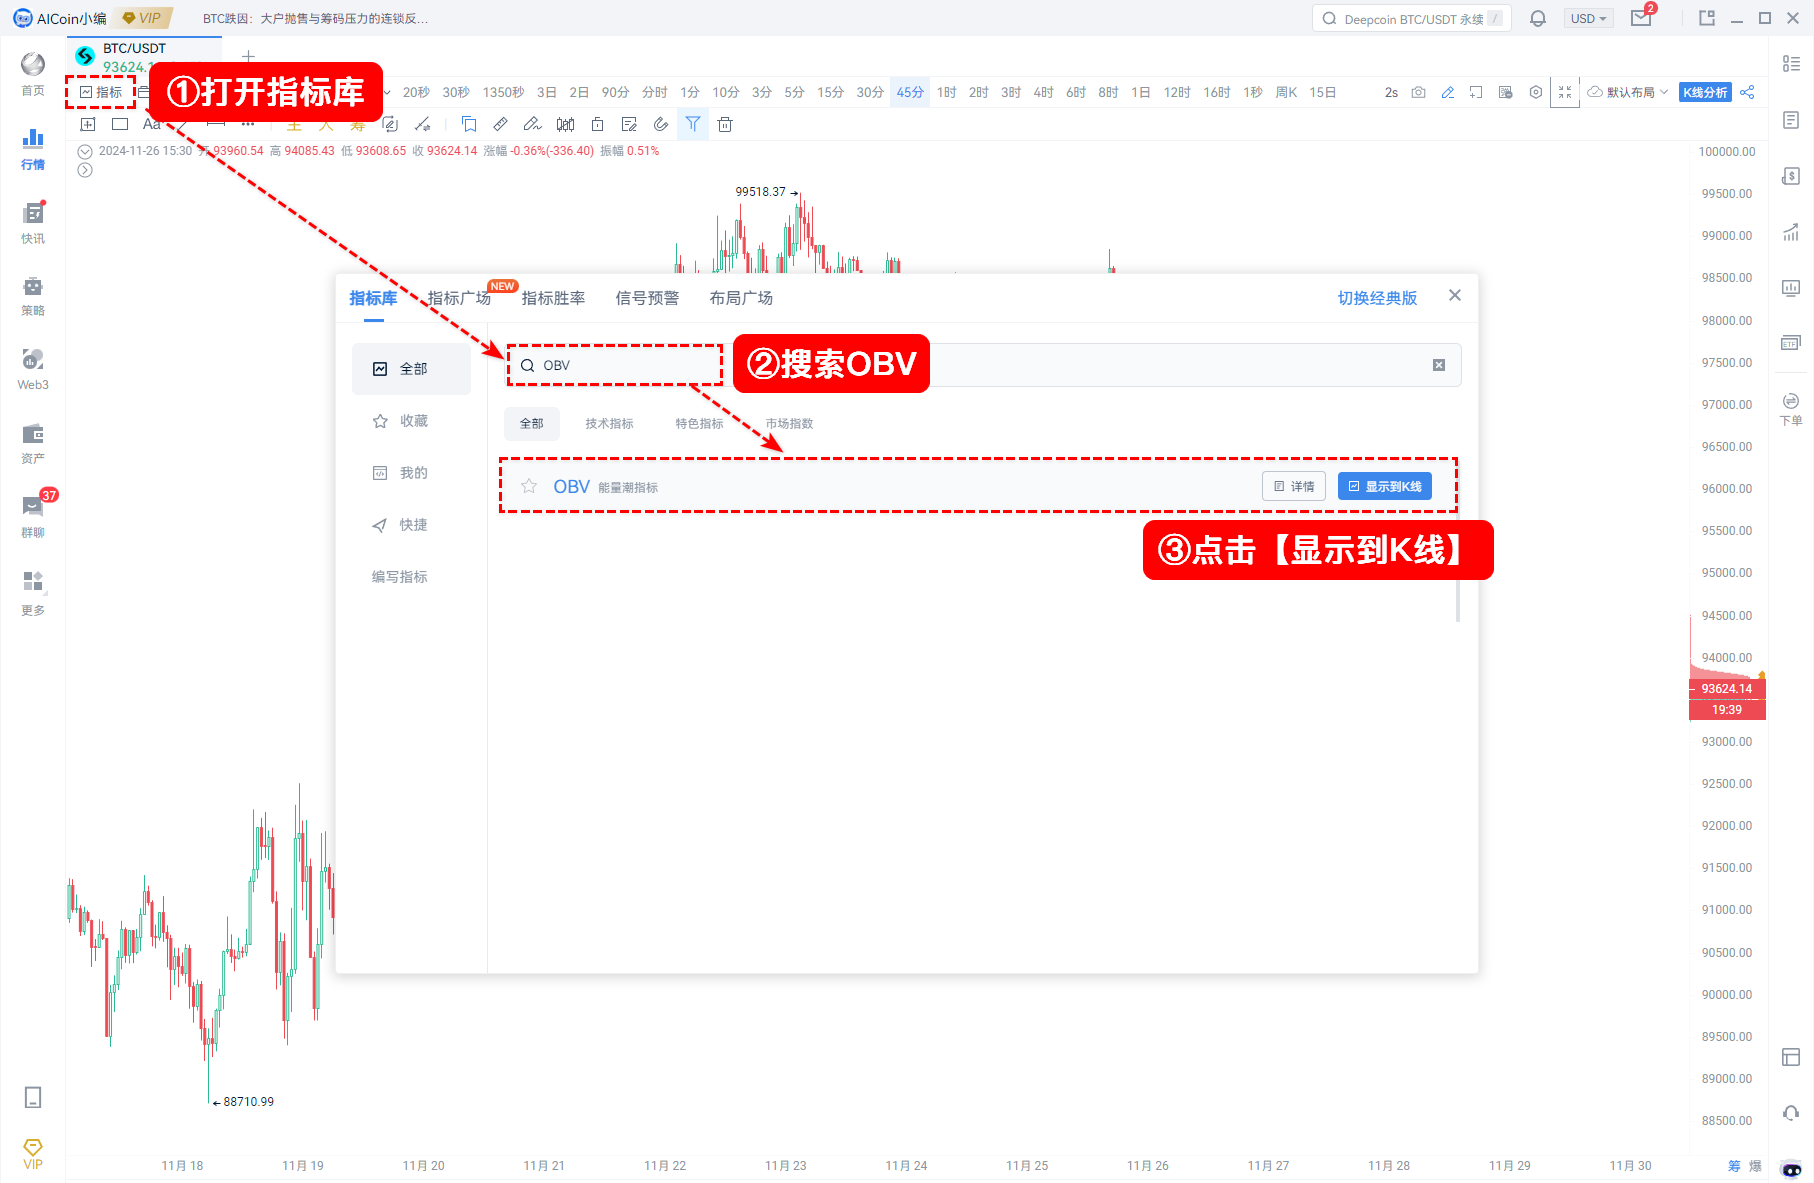
(1) AICoin OBV Indicator:
Download and log in to AICoin.
Check the OBV indicator in the indicator library on the candlestick chart page.
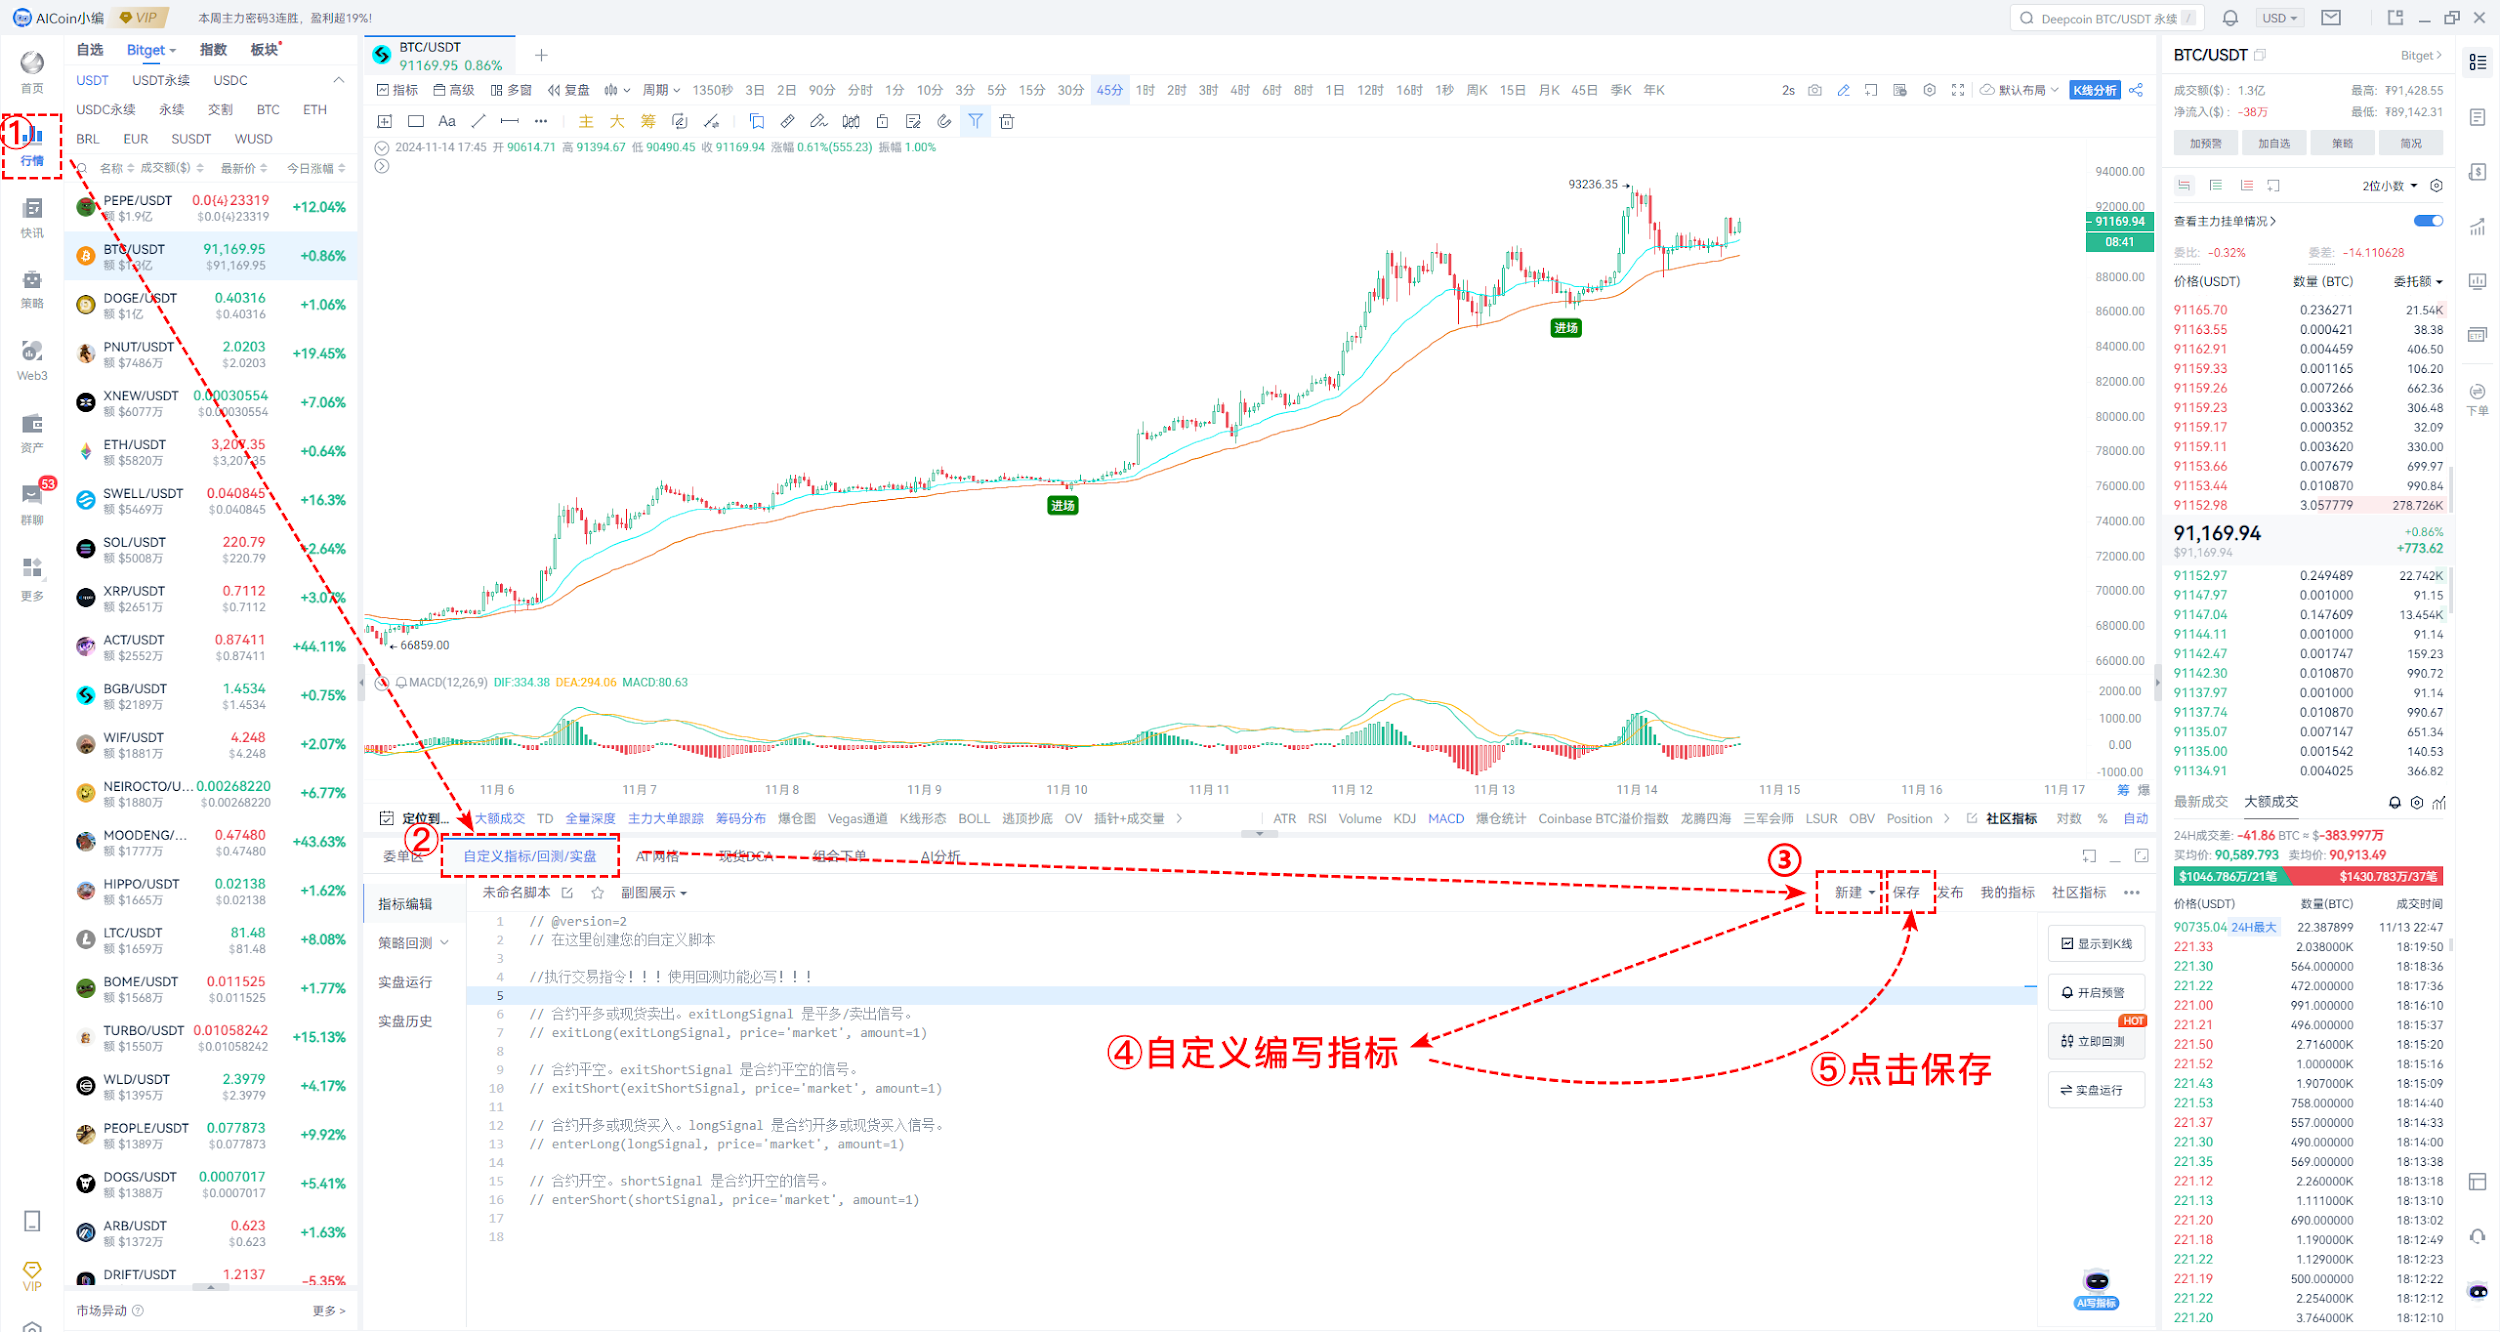
(2) AICoin Custom Indicators: Achieve Quantitative Trading for All Cryptocurrencies on Bitget!
AICoin's custom indicators allow users to deeply customize based on their trading strategies and risk preferences. Whether tracking market trends, quantifying signals, or setting specific trading conditions, users can create indicators that meet their unique needs with simple adjustments!
At the same time, AICoin's custom indicators fully support all cryptocurrencies on the Bitget platform. Whether mainstream coins or emerging hot coins, users can easily apply custom indicators for analysis and trading, ensuring they can navigate every trade with ease.
Choose AICoin custom indicators to start your quantitative trading journey, seize every market opportunity, and achieve more efficient investment returns!
About Bitget OBV Indicator and Copy Trading Products
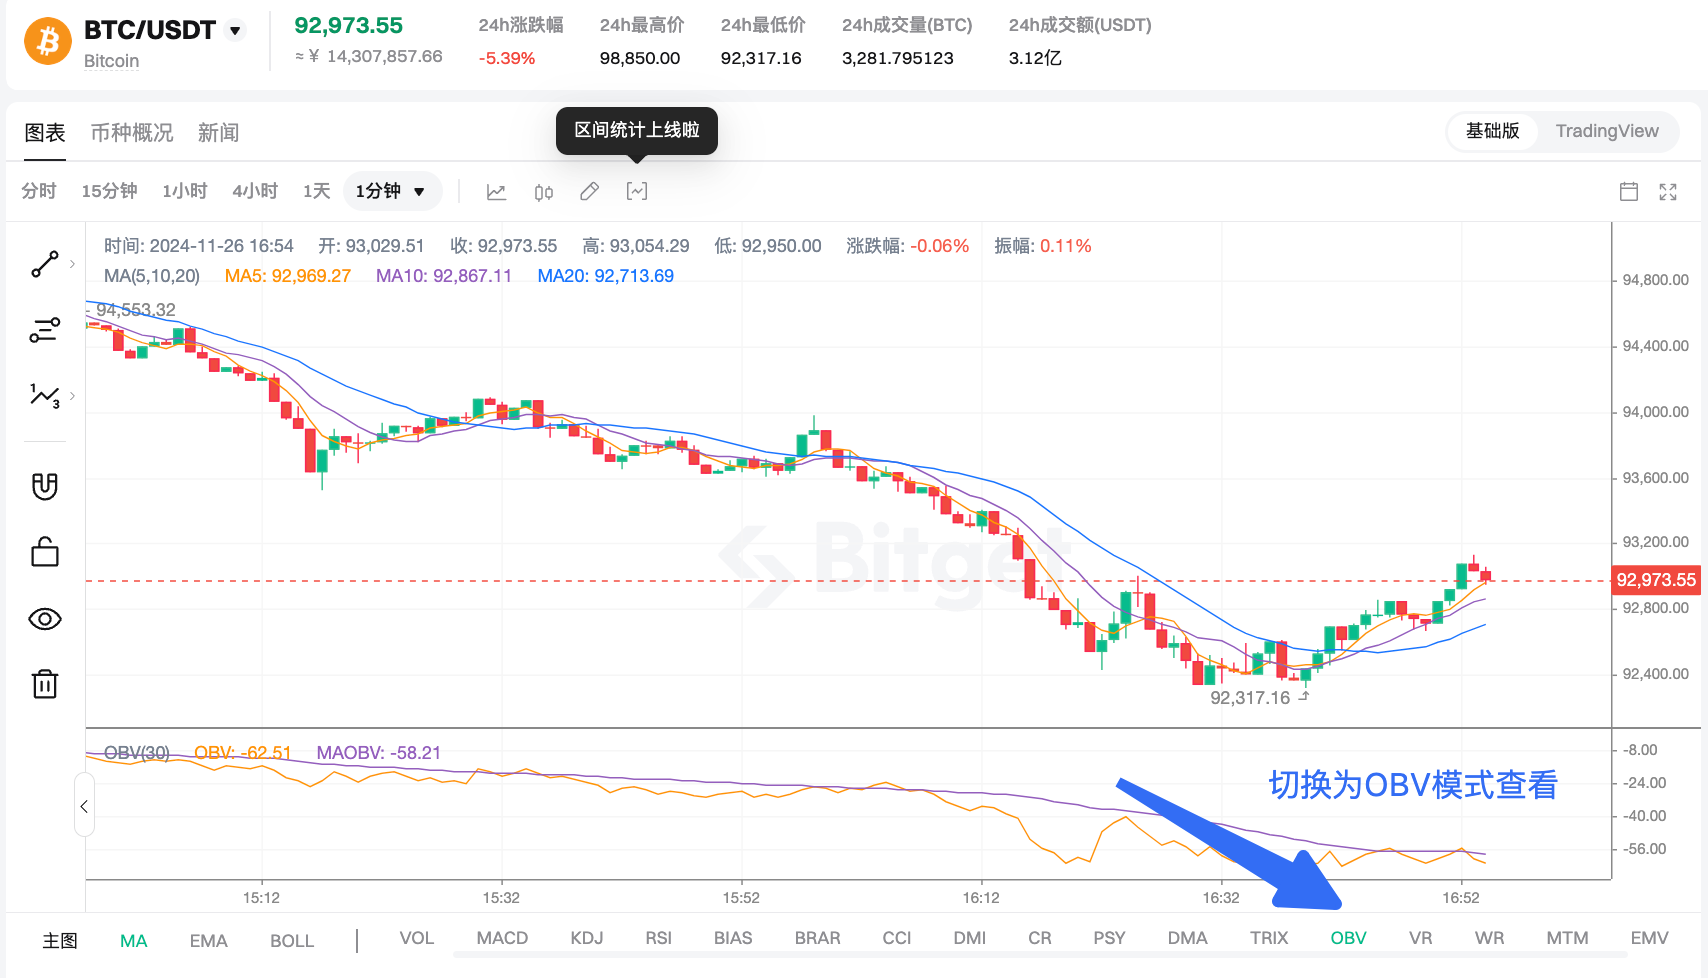
(1) Bitget OBV Indicator
Download and log in to Bitget.
Switch to view OBV at the bottom of the candlestick chart page; this indicator can be viewed on both the web and mobile versions.
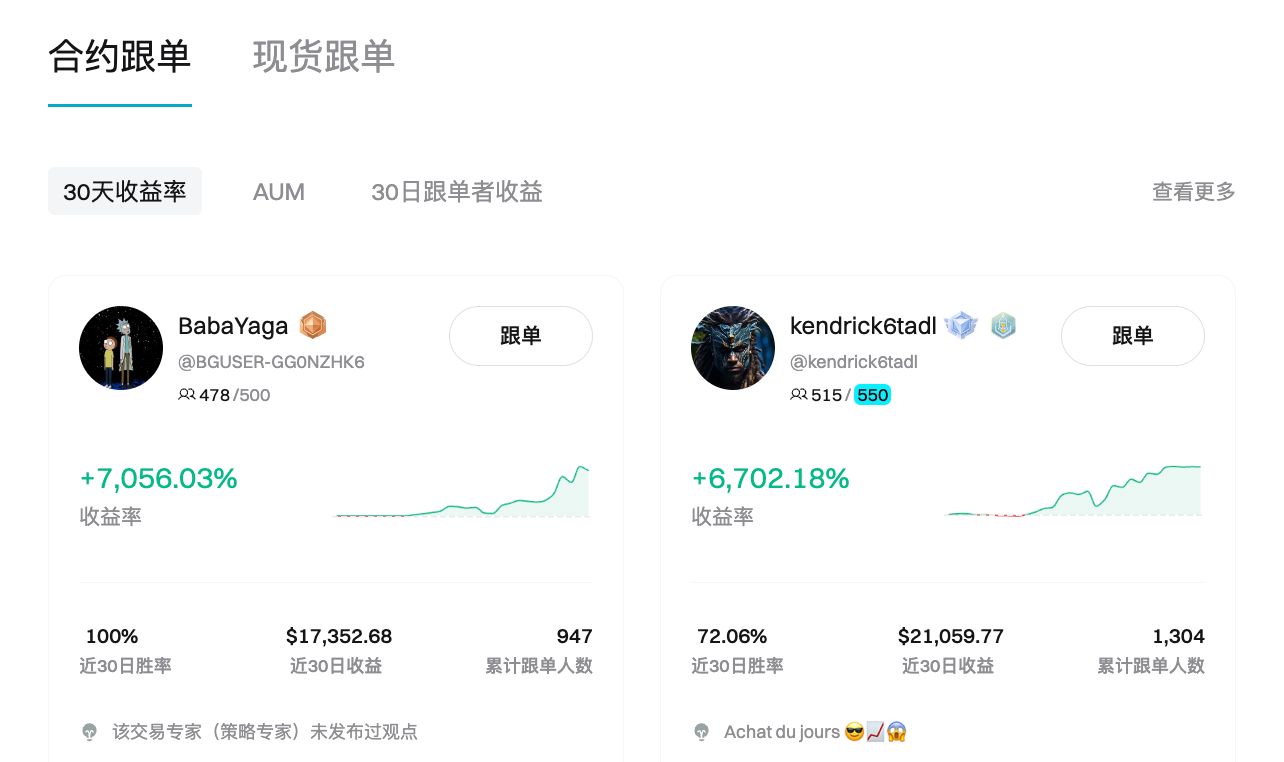
(2) About Bitget Copy Trading Products: Fearless of Market Changes, Accurately Grasp Bullish and Bearish Trends
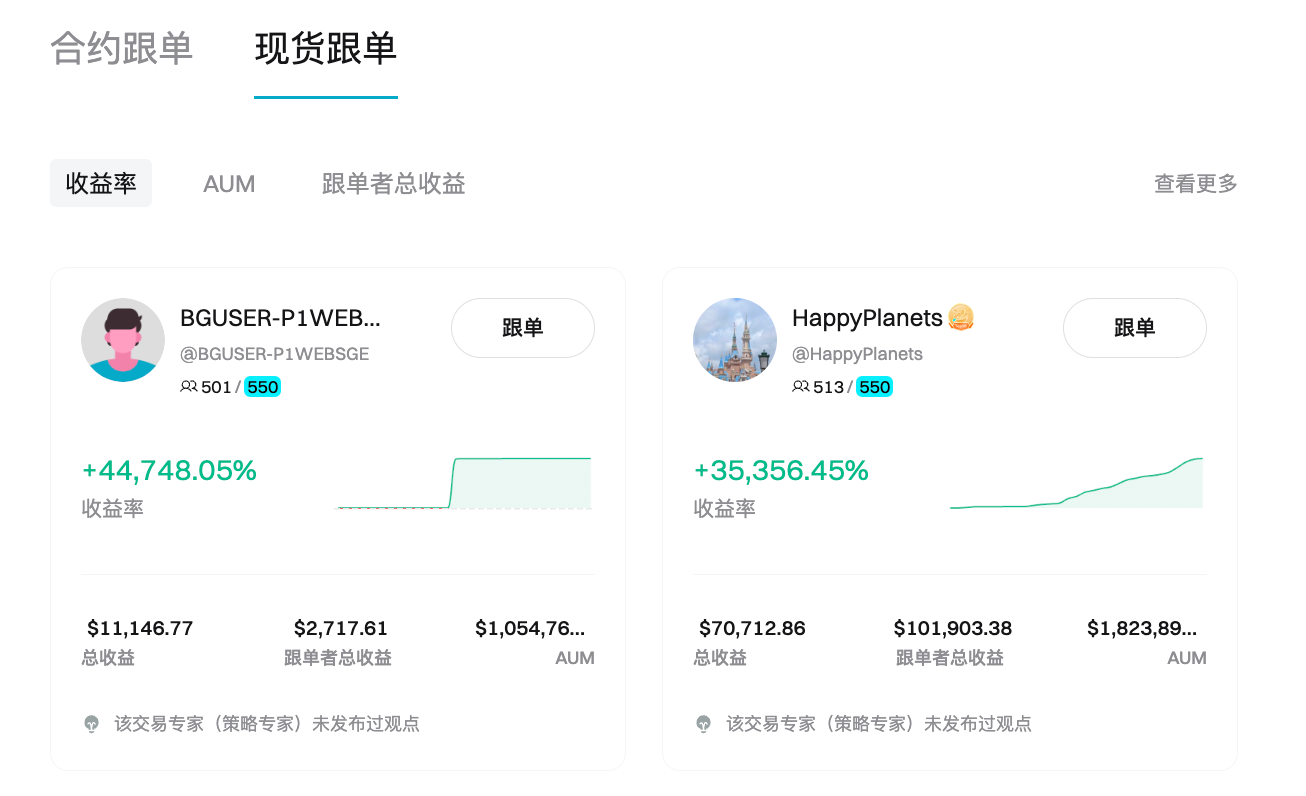
Bitget is the first cryptocurrency trading platform to introduce copy trading, officially launched in May 2020. Currently, Bitget supports both spot and contract copy trading, allowing novice traders to review the investment portfolios and historical performance of trading experts, choose to subscribe to strategies that meet their return expectations and risk preferences, and gather top trading experts to share strategies. The platform hosts over 180,000 trading experts and 800,000 copy traders, with over 90 million successful trades.
Disclaimer
This article is for information sharing only and represents the author's personal views, not the positions of Bitget and AICoin. We do not provide any form of trading advice, including but not limited to specific investment recommendations, buying and selling advice for digital assets, or financial, legal, and tax guidance. The information presented may be inaccurate or incomplete; therefore, please carefully assess the relevant risks before making investments. Trading and holding digital assets may face significant price volatility, and it is essential to consider whether to participate based on personal financial circumstances.
免责声明:本文章仅代表作者个人观点,不代表本平台的立场和观点。本文章仅供信息分享,不构成对任何人的任何投资建议。用户与作者之间的任何争议,与本平台无关。如网页中刊载的文章或图片涉及侵权,请提供相关的权利证明和身份证明发送邮件到support@aicoin.com,本平台相关工作人员将会进行核查。


