As a veteran in the cryptocurrency space, I have been deeply involved in this captivating and challenging industry for many years. Having experienced the ups and downs of the crypto market and witnessed the rise and fall of countless cryptocurrencies, I have accumulated rich practical experience and unique market insights. Investing is a long-term practice, and this is especially true in the cryptocurrency space. Continuous learning and improving one's cognitive and judgment abilities are essential to navigate this challenging field steadily.
Old Yang from the Crypto Circle: Bitcoin Market Analysis on November 25, 2024
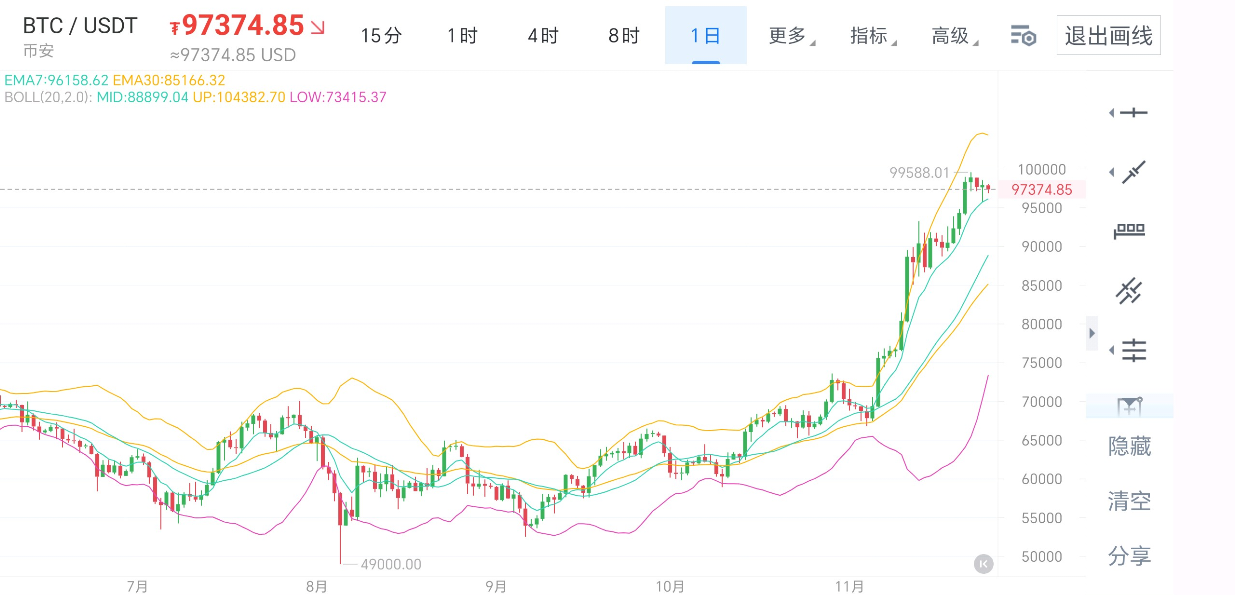
The daily chart shows a pullback trend, and the neckline at the daily level is yet to be clarified. The EMA12 trend line provides support at 93,255 and continues to rise, indicating some bullish strength. The MACD indicator shows a top divergence, but the volume has decreased, and the DIF and DEA are contracting at high levels, suggesting that while the upward momentum has weakened, the trend has not completely reversed. The upper Bollinger Band is contracting, with resistance at the 104,000 level stagnating, while the middle band remains in a stretching state after breaking through 88,500. Overall, the current large-scale trend still leans bullish.

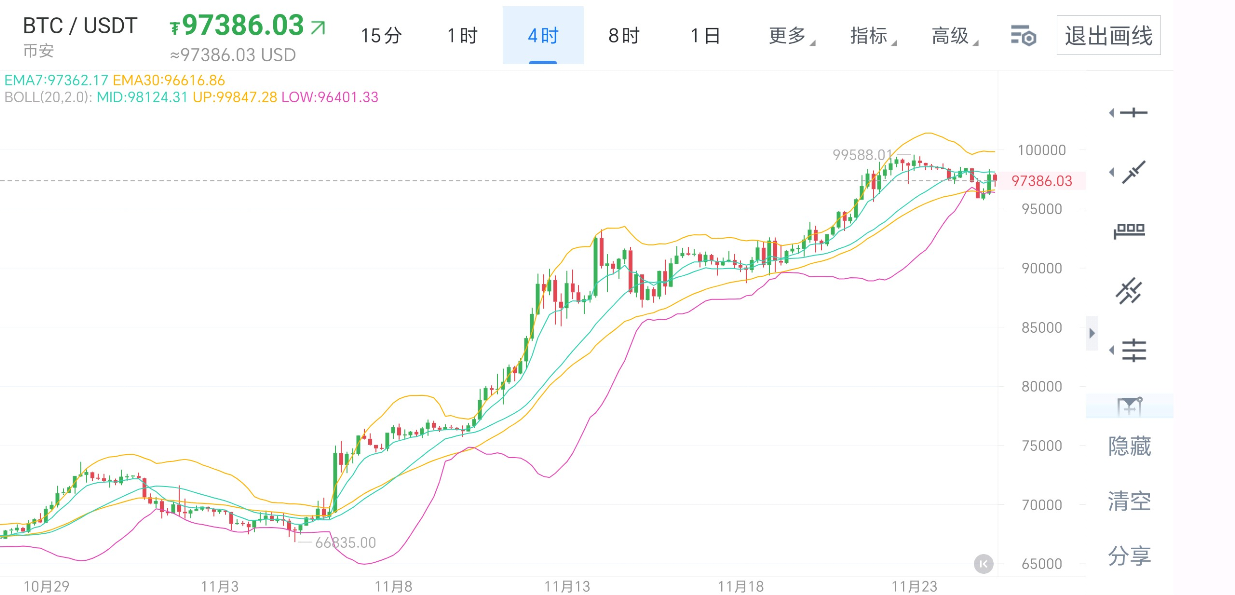
The four-hour chart has pulled back to the neckline around 96,000 formed by previous lows, which is a key turning point for short-term bulls and bears. If this line holds, the bullish pattern continues, and there is no need to panic about positions. The MACD is contracting with concentrated positions, and the DIF and DEA are facing resistance at high levels. The Bollinger Band is in a contracting state, with the K-line breaking below the lower band at 96,400 and then pulling back, currently challenging the middle band resistance at 98,136, while the upper band resistance at 99,850 also needs attention. The KDJ has formed a golden cross upwards, highlighting bullish momentum. The current strategy is clear; the bullish trend remains unchanged, and one can hold firmly.

Short-term strategy:
Short from 99,700 to 102,000, add positions at 103,000, stop loss at 500 points, target 98,000.
Long from 96,000 to 96,700, add positions at 95,400, stop loss at 500 points, target 99,000.
Disclaimer: The above analysis represents the author's personal views and does not constitute specific operational advice. Trading based on this analysis is at your own risk; investing carries risks, and caution is advised when entering the market.
This article is exclusively planned and published by Old Yang from the Crypto Circle. For more real-time investment strategies, spot contract trading techniques, and operational skills, you can consult me for learning and exchange. I have focused on BTC, ETH, and altcoin spot contracts for many years and hope to help you achieve remarkable results!

Friendly reminder: The above content is solely created by the author on the public account. The advertisements at the end of the article and in the comments section are unrelated to the author. Please discern carefully, and thank you for reading.
免责声明:本文章仅代表作者个人观点,不代表本平台的立场和观点。本文章仅供信息分享,不构成对任何人的任何投资建议。用户与作者之间的任何争议,与本平台无关。如网页中刊载的文章或图片涉及侵权,请提供相关的权利证明和身份证明发送邮件到support@aicoin.com,本平台相关工作人员将会进行核查。


