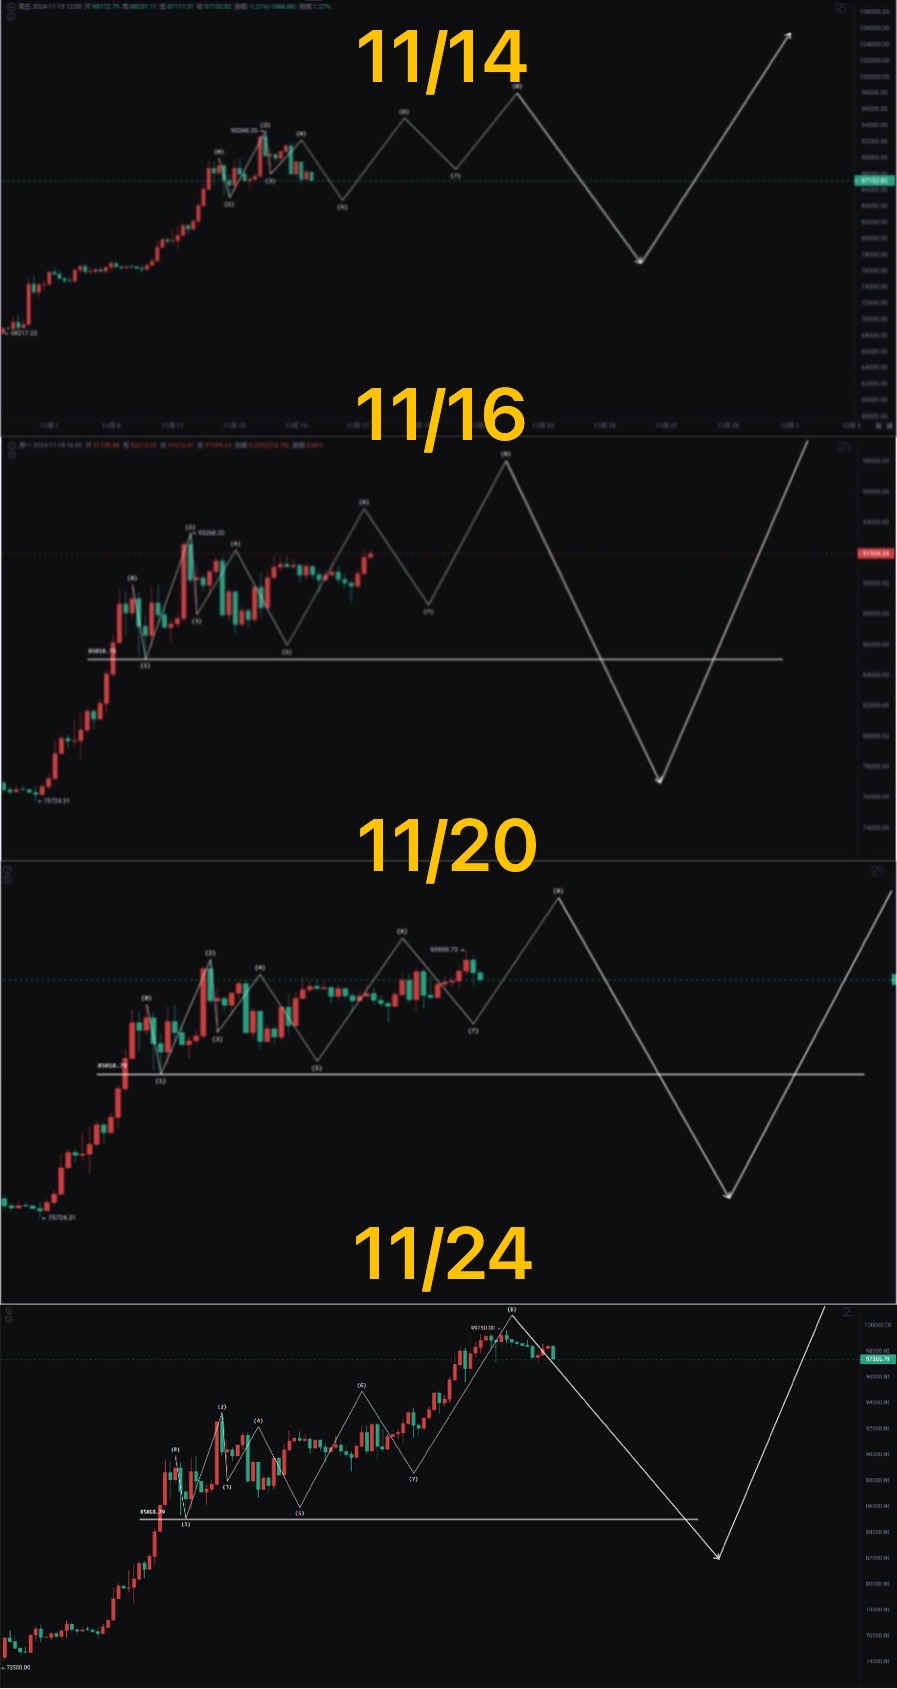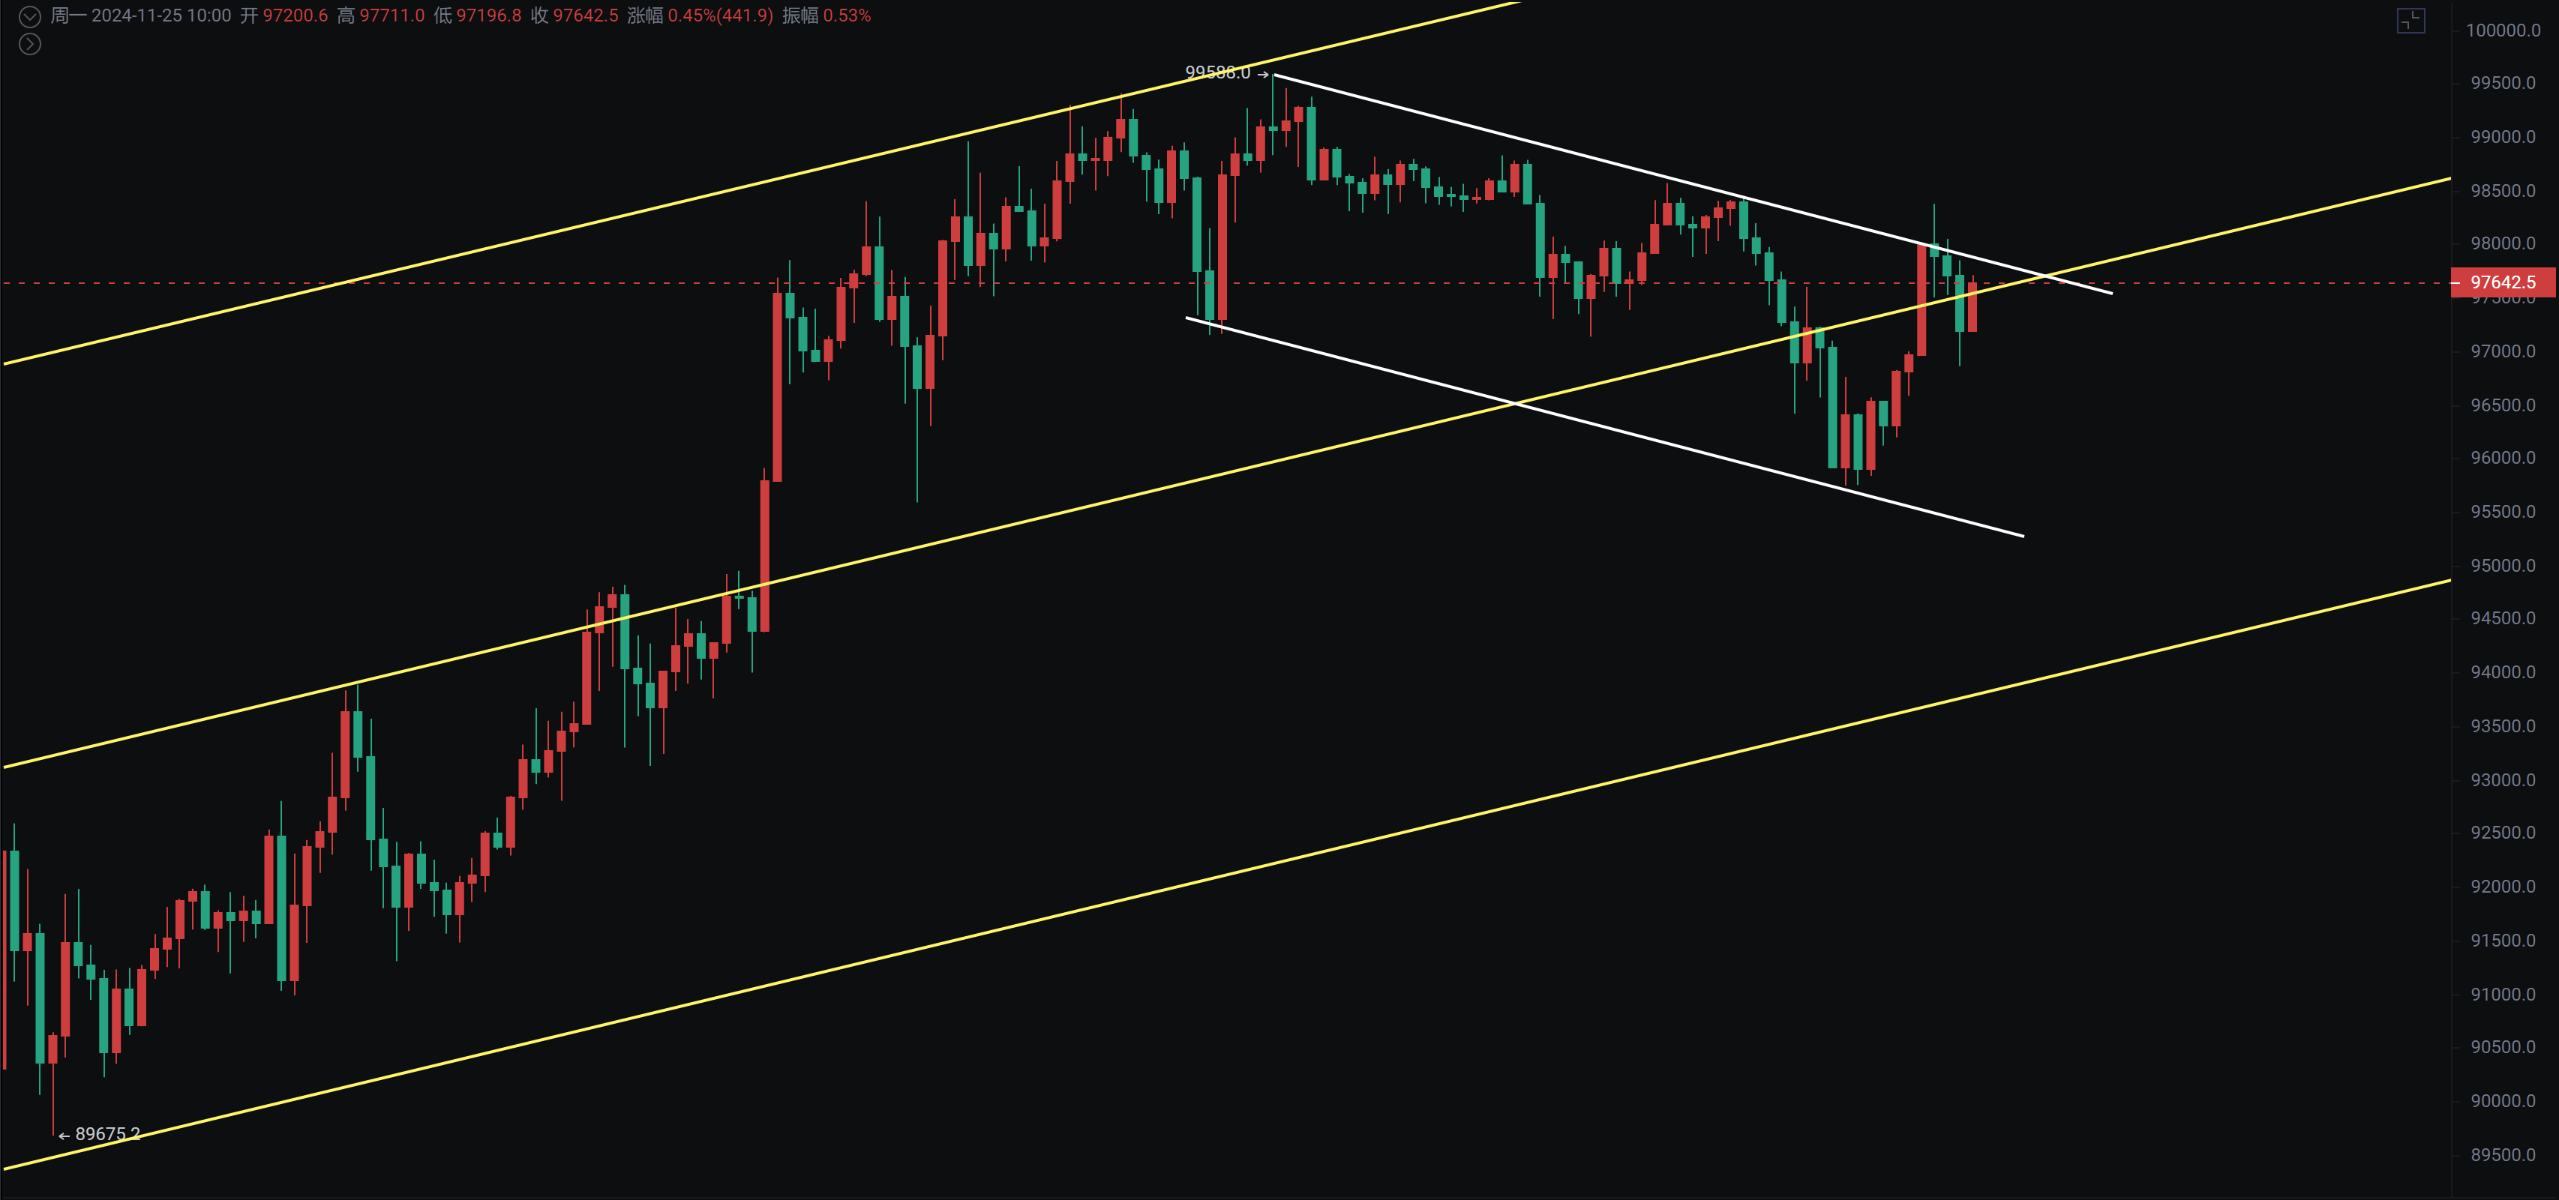
Yesterday early morning, I reminded of the risk of a pullback, and during the day, I reminded again that the BTC liquidation risk increased on 24/11/24. The ETH rebound is still ongoing, and the old altcoins are taking turns to rebound. Last night, it dropped to 95734 and rebounded to a morning high of 98369, just testing the price area of yesterday's drop for the second time.
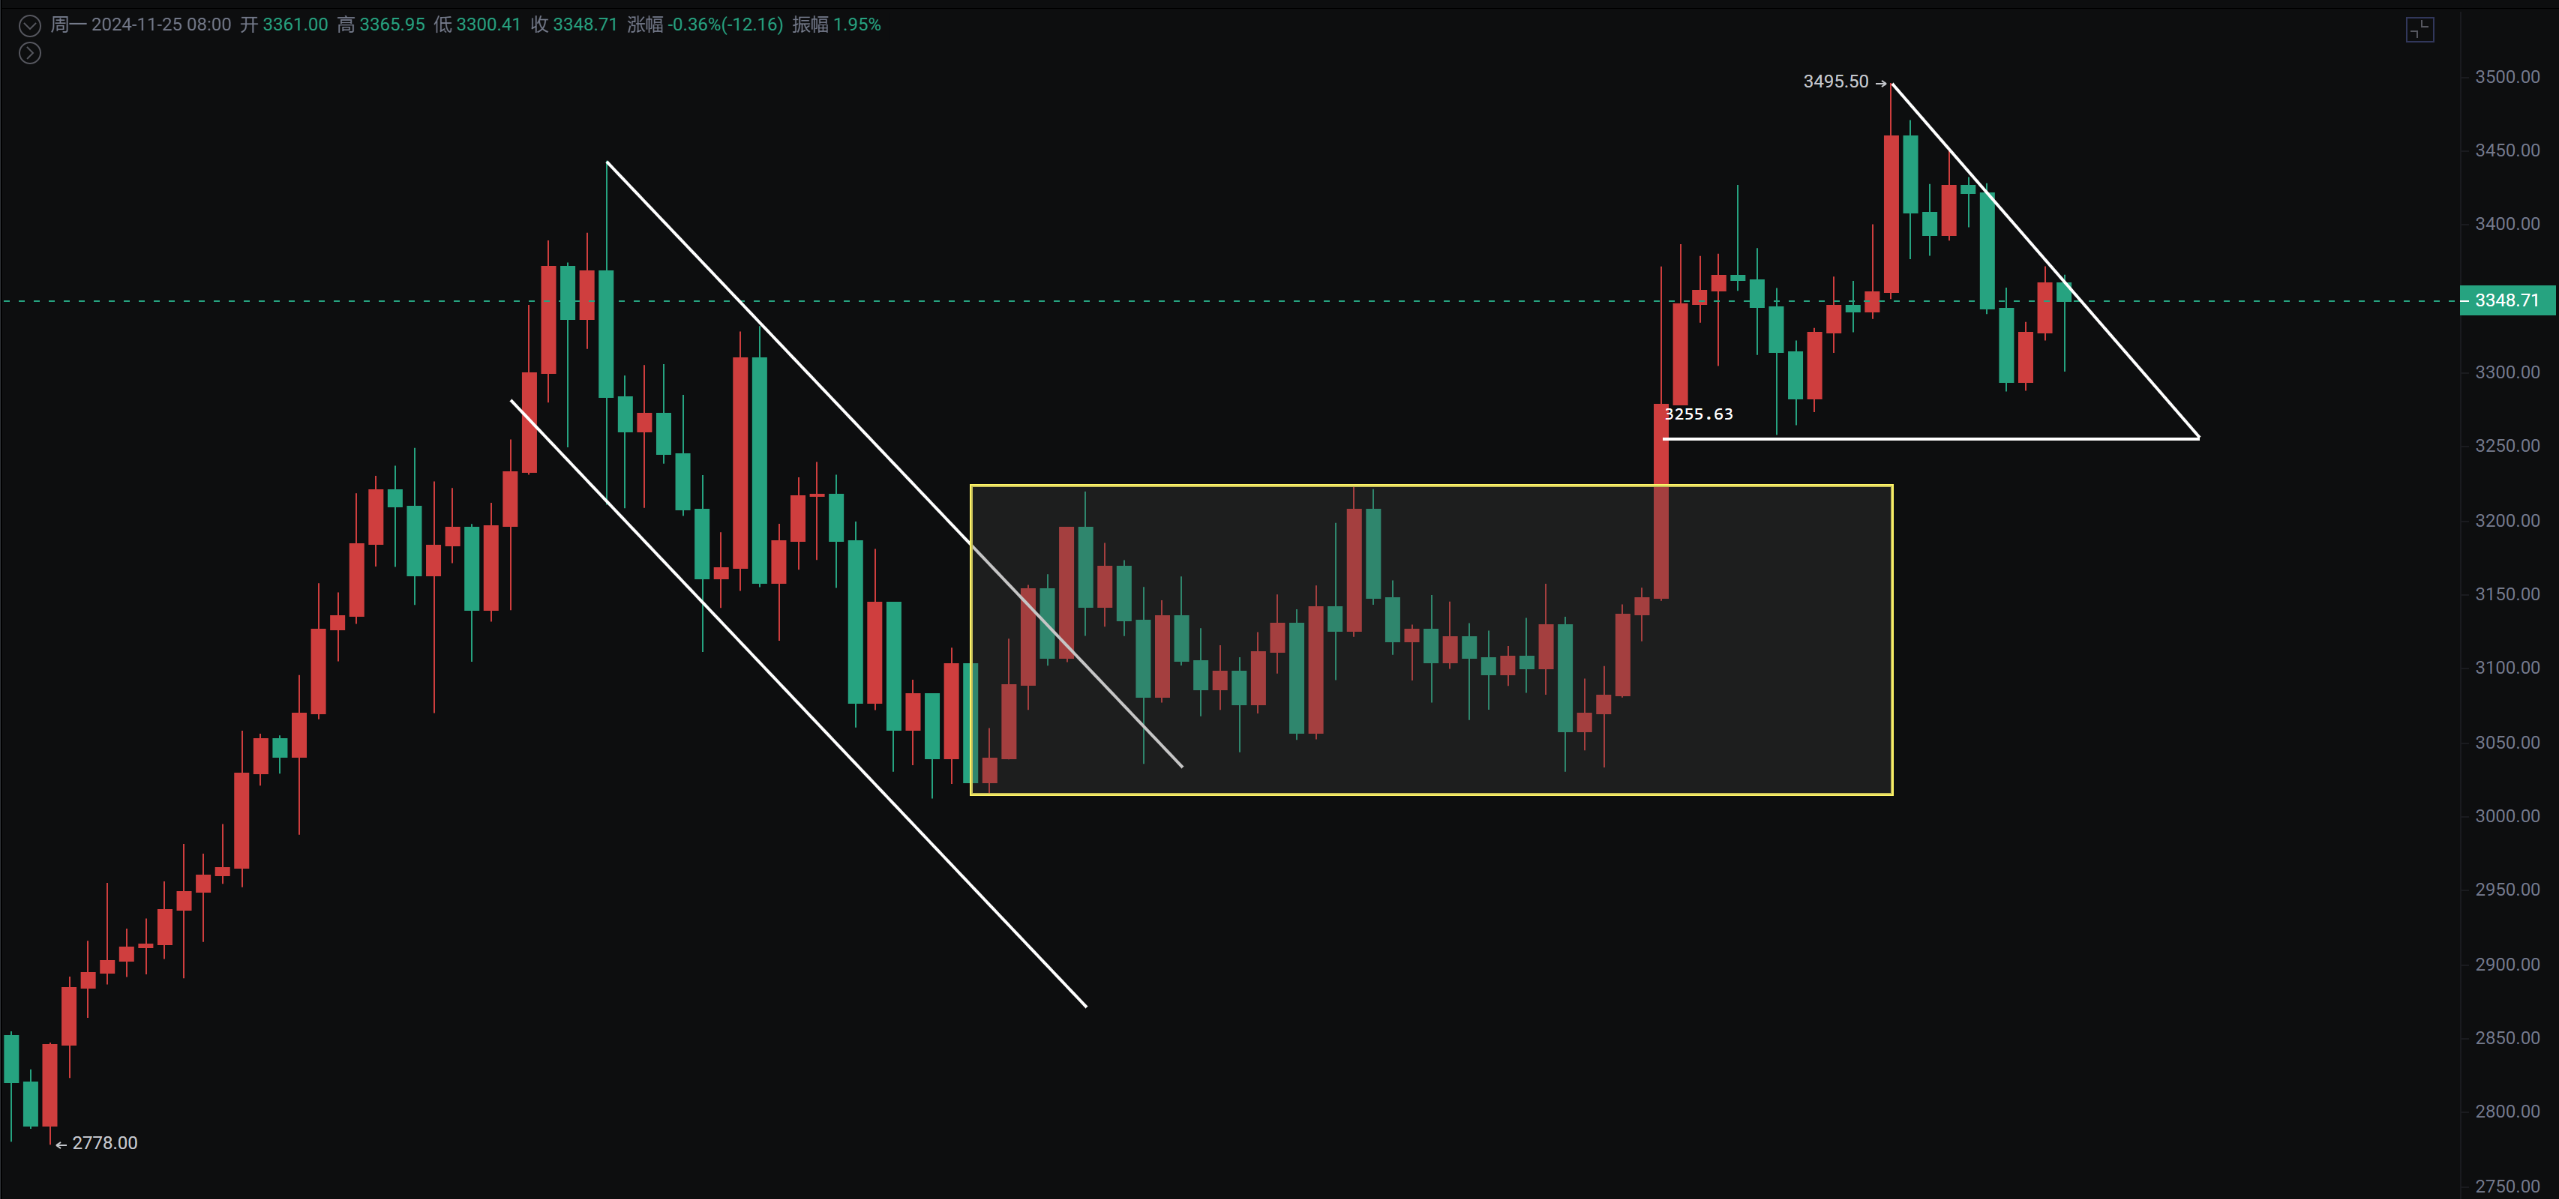
The daily chart of Ethereum shows an engulfing pattern. After reaching a new high of 3497 for the second time, it fell back, forming a false breakout. Yesterday, Bitcoin dropped by more than 2 points, while altcoins fell by a dozen or twenty points. In the evening, there was another rebound, and the market turned red again, although we see that altcoins are still continuously rebounding, and the gains are substantial.

However, if Bitcoin slightly adjusts by 10 or 15 points, many altcoins could be halved. From the market perspective, the bulls are strong, but a key resistance must be effectively broken. Unless a new high is effectively broken and stabilized, we will consider entering the market, or we will wait for a drop back to 85000—87000 for medium to long-term positioning.
Bitcoin
The weekly closing shows three consecutive bullish candles, approaching the 100,000 mark. The daily chart shows a evening star pattern. Today, it will test the upper resistance at 98369 again. If it can break through, there will be a small increase; if it cannot, the pullback will continue.
The 4-hour chart shows a descending channel, and the upper rebound meets resistance, which is also the Fibonacci 0.618 retracement level. An increase will not be completed in one day, and a decline will not end overnight; we should go with the trend. We will wait for lower price levels to position for medium to long-term trends.
Support: Resistance:

Ethereum
The daily chart shows an engulfing pattern, and after rebounding to 3497, it fell back, forming a false breakout. The price line is below the previous 3444 spike platform. The 4-hour daily MACD shows severe divergence at the top, and it will need time to digest; we must patiently wait for the trend to change.
Support: Resistance:

If you like my views, please like, comment, and share. Let's navigate through the bull and bear markets together!!!
The article is time-sensitive and for reference only; it is updated in real-time.
Focusing on K-line technical research, sharing global investment opportunities. Official account: Trading Prince Fusu

免责声明:本文章仅代表作者个人观点,不代表本平台的立场和观点。本文章仅供信息分享,不构成对任何人的任何投资建议。用户与作者之间的任何争议,与本平台无关。如网页中刊载的文章或图片涉及侵权,请提供相关的权利证明和身份证明发送邮件到support@aicoin.com,本平台相关工作人员将会进行核查。


