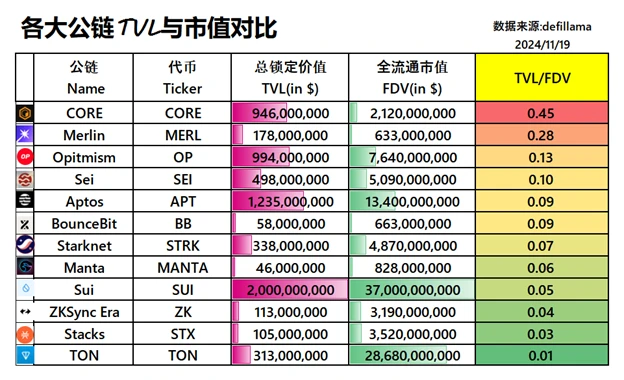
As shown in the figure, from the key indicators of TVL (Total Value Locked), FDV (Fully Diluted Valuation), and the TVL/FDV ratio, we can roughly assess the "size of the market," market expectations, and whether there is "undervalued potential" for these public chains.
In simple terms, TVL represents how much money is coming in, FDV is the market's valuation of the project, and TVL/FDV shows whether this valuation is solid or just an illusion. Let's break it down one by one.
1. TVL — The Higher the Locked Amount, the More "Attractive" the Ecosystem
This is the most intuitive indicator; the amount locked represents how much the ecosystem can "sustain people."
From the table:
Sui has locked 2 billion USD, which is indeed impressive, but hold on, let's look at FDV before making any conclusions.
Aptos and Optimism have both locked nearly 1 billion, and these two ecosystems seem quite stable, with active funding.
Merlin, although it has only 178 million, is not at the bottom of the list and shows decent capital attraction.
2. FDV — Is the Valuation Realistic Enough?
FDV is the "market valuation expectation" for the project. If the valuation is too high but funding doesn't keep up, it enters the "bubble danger zone"; if the valuation is moderate and the locked funds are high, it is a "potential stock."
Let's take a look at these projects:
Sui's FDV skyrocketed to 37 billion, but 2 billion TVL can't support that, which is clearly "a pie drawn in the sky while funds are on the ground." The risk is significant.
TON has an FDV of 2.8 billion, with only 300 million in TVL, making this ratio absurdly low, somewhat relying on sentiment and hype to hold up.
In contrast, Merlin has an FDV of only 633 million, but a TVL of 178 million, indicating that market expectations are not unreasonable and there is still considerable room for growth.
3. TVL/FDV — Is It True Strength or Just a Master of Drawing Pies?
This ratio looks at the proportion of locked funds to market valuation expectations; the higher it is, the more efficient the funds are, and the more solid the development.
Let's analyze:
CORE (0.45): This ratio is directly impressive on the list; a lot of money is coming in, and the valuation is modest, indicating minimal bubble risk. If capital inflow continues to grow, explosive potential is evident.
Merlin (0.28): The second-ranked entity, with a decent proportion of locked funds, and a valuation that isn't too inflated, making it a stable option for investment.
Optimism (0.13) and Sei (0.10): Average performance, not undervalued, but also lacking any particularly surprising aspects, considered "steady players" among mainstream public chains.
Sui (0.05) and TON (0.01): These two have pulled the TVL/FDV ratio down significantly; market expectations are at a ceiling, but locked funds are lacking, appearing more like a bubble, making them less suitable for high-risk investments.
A high TVL/FDV ratio indicates less bubble risk and more potential; a low ratio suggests a larger bubble, requiring caution.
Combining the above data:
High Potential Candidates: CORE and Merlin, both have high capital utilization rates, reasonable valuations, and stable ecosystems, especially suitable for medium-term investments.
Steady Progress Veterans: Optimism and Aptos, with substantial locked funds, although their valuations are slightly inflated, their ecosystems are still expanding, making them solid blue-chip options.
Bubble Suspects: Sui and TON, these two are too "underwhelming," relying solely on FDV for inflated valuations without sufficient TVL support, making them likely to face declines or valuation shrinkage in the future.
免责声明:本文章仅代表作者个人观点,不代表本平台的立场和观点。本文章仅供信息分享,不构成对任何人的任何投资建议。用户与作者之间的任何争议,与本平台无关。如网页中刊载的文章或图片涉及侵权,请提供相关的权利证明和身份证明发送邮件到support@aicoin.com,本平台相关工作人员将会进行核查。


