Since BTC strongly reached a historical high of 93,265 points on November 14, the market has been oscillating at a high level between 88,000 and 92,000. During this period, there were two attempts to break the new high, but they were unsuccessful. The current price is 90,515.
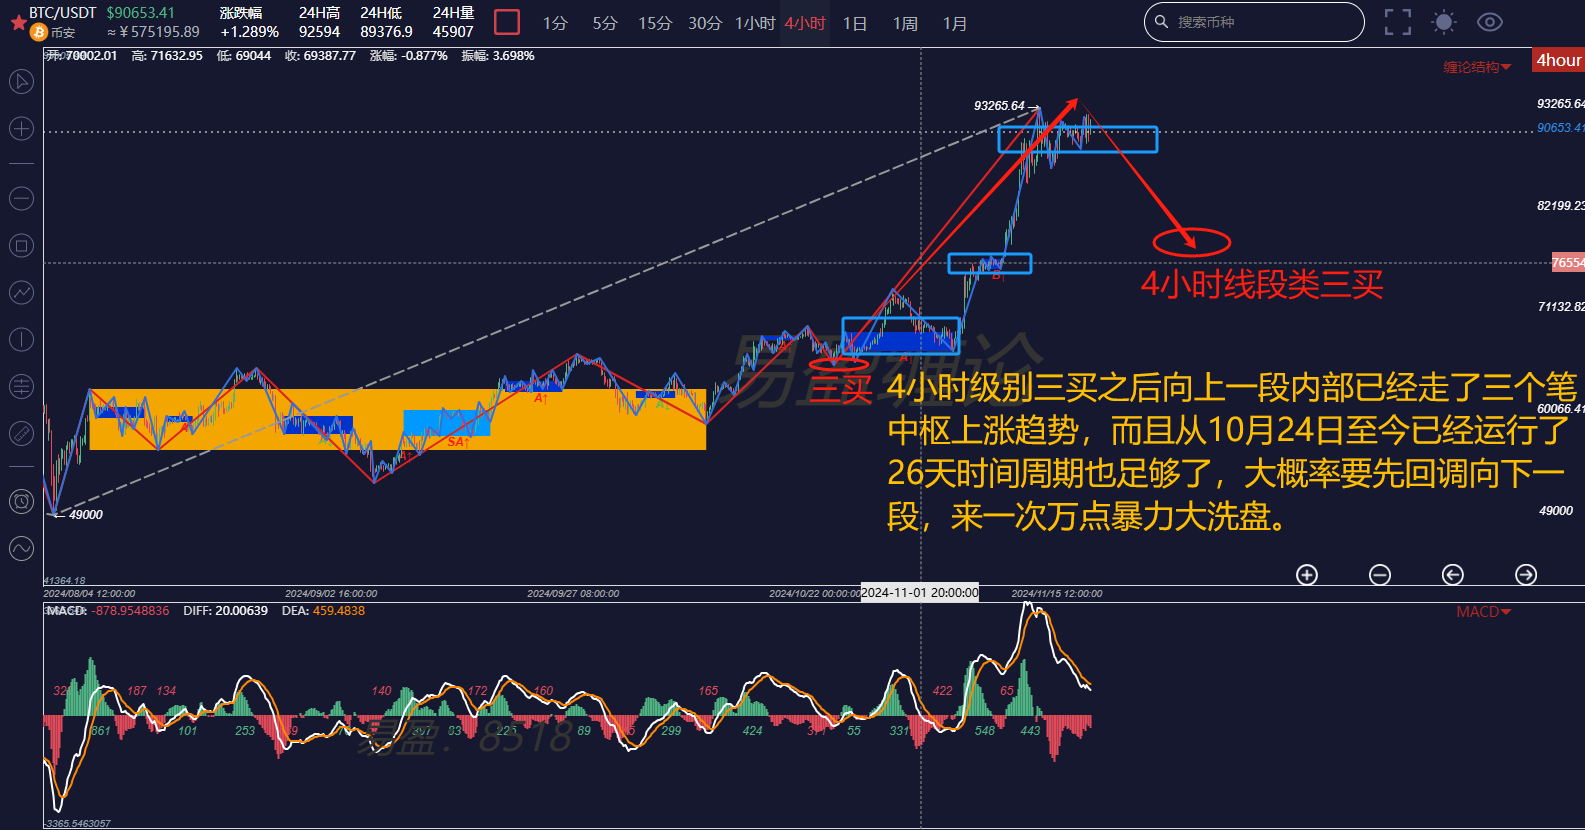
The market has now fallen into a state of anxiety. From the perspective of technical structure analysis based on the Chande theory, whether it will set a new historical high again in the short term is no longer the key issue. The key point is that the one-sided upward trend that started from 58,946 on October 11 has lasted for more than a month and a half, and the strong three-buy operation at the 4-hour level that began from 65,260 on October 24 has also lasted for more than 26 days, approaching a month. There is no market that only rises without falling, and from the perspective of time cycles, the mid-short-term market is already at its end.
From the perspective of the long-short game, the prolonged volume increase has completely wiped out the shorts, while the market has also accumulated too many profit positions. The market's long-short sentiment has remained above the extremely greedy level of 80 points for several consecutive days. Based on past historical experience, the market often chooses to move in the direction with less resistance. It is evident that continuing upward now faces significant resistance. The BTC is currently burdened with countless "vampires," and to continue rising healthily, a violent correction of over 10,000 points is needed for a thorough cleansing. In terms of time, the next few days will reveal the outcome!

First, let's look at the 4-hour Chande structure chart. It is clear from the chart that after the three-buy, there has been a segment of volume increase and rise, which has already formed three central upward trends within the segment, undoubtedly at the end of the segment. The only suspense lies in whether it will break the new high again to lure in more buyers before a drop, or if it will drop directly without breaking the new high.
Of course, the overall direction remains upward, as the daily level is still in a volume-increasing non-divergent upward phase, and no internal structure has appeared yet. The current pullback is merely a correction for the mid-short term, or rather, a 4-hour downward segment. This downward correction is likely to lead to another upward push to challenge the historical high after a segment-like three-buy.

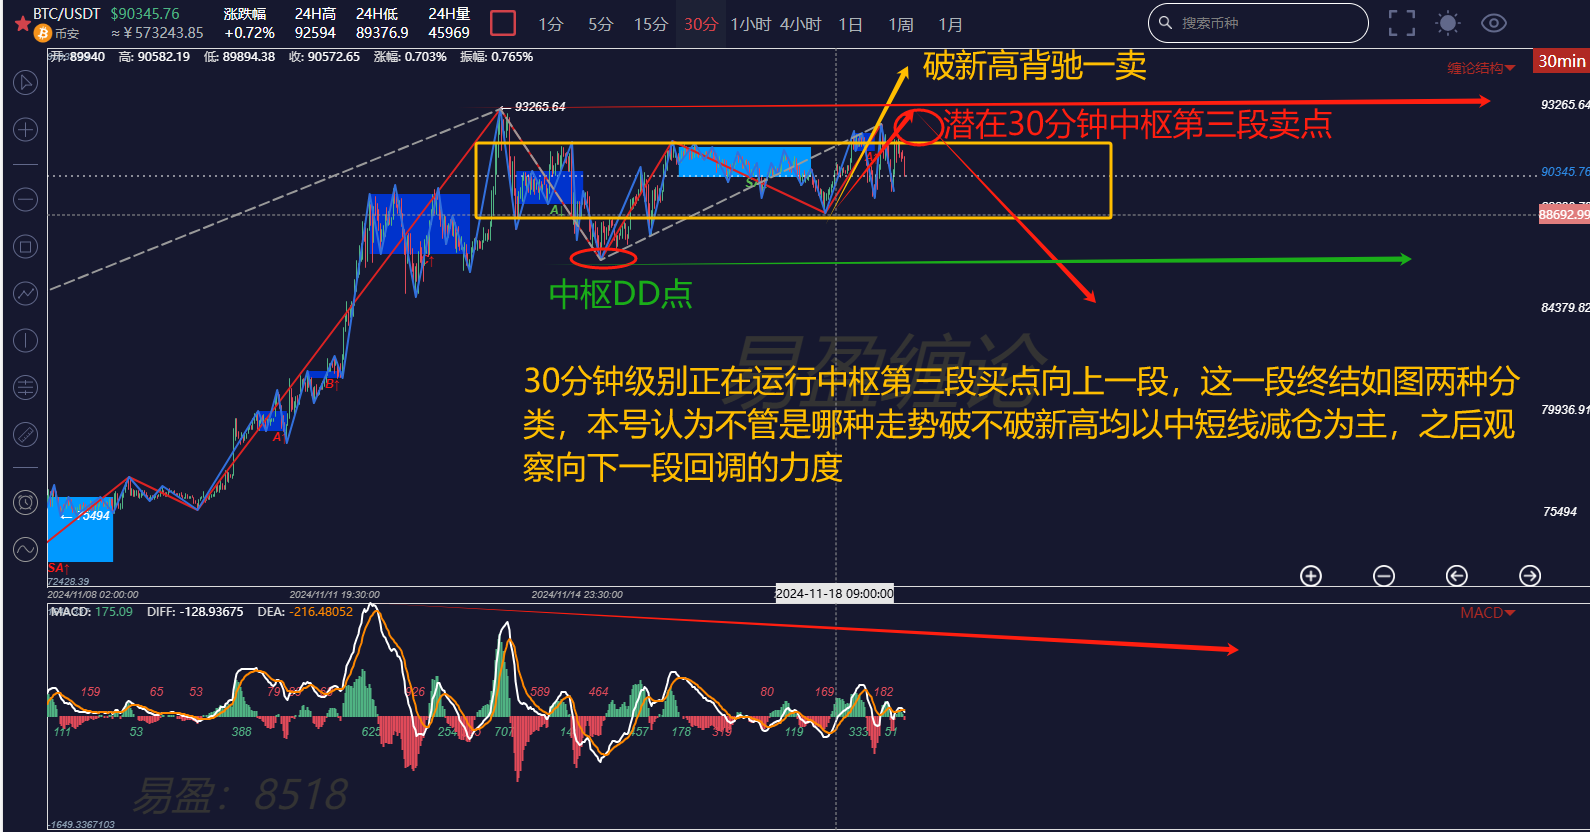
Next, let's look at the lower-level 30-minute chart. The new central structure has been completed, and it is currently running as the third segment buy point of the central structure moving upward. The chart presents two classifications; regardless of whether it breaks the new high or not, even if it does break the new high, it is likely to be a lure for more buyers. The mid-short term should focus on reducing positions, and any long positions should be short-term, as the cost-effectiveness is low and it is not worth chasing the high.
In summary: Selling points always appear during crazy rises! Regardless, when the market is filled with FOMO sentiment, gradually reducing positions to take profits is the best strategy. Reducing three to four tenths of the position is advisable to cope with the upcoming large fluctuations.
The above analysis is for reference only and does not constitute any investment advice!
Friends, if you are interested in the Chande theory and want to obtain free learning materials, watch public live broadcasts, participate in offline training camps, improve your trading skills, build your trading system to achieve stable profit goals, and use Chande techniques to escape peaks and buy bottoms in a timely manner, you can scan the QR code to follow the public account and privately chat to get and add this WeChat account!

免责声明:本文章仅代表作者个人观点,不代表本平台的立场和观点。本文章仅供信息分享,不构成对任何人的任何投资建议。用户与作者之间的任何争议,与本平台无关。如网页中刊载的文章或图片涉及侵权,请提供相关的权利证明和身份证明发送邮件到support@aicoin.com,本平台相关工作人员将会进行核查。


