On November 18 at 16:00, the AICoin editor conducted a graphic and text sharing session titled "Market Truth: Volume First, Price Later" in the 【AICoin PC - Group Chat - Live】. Below is a summary of the live content.
This time, I will share how to interpret trading volume.
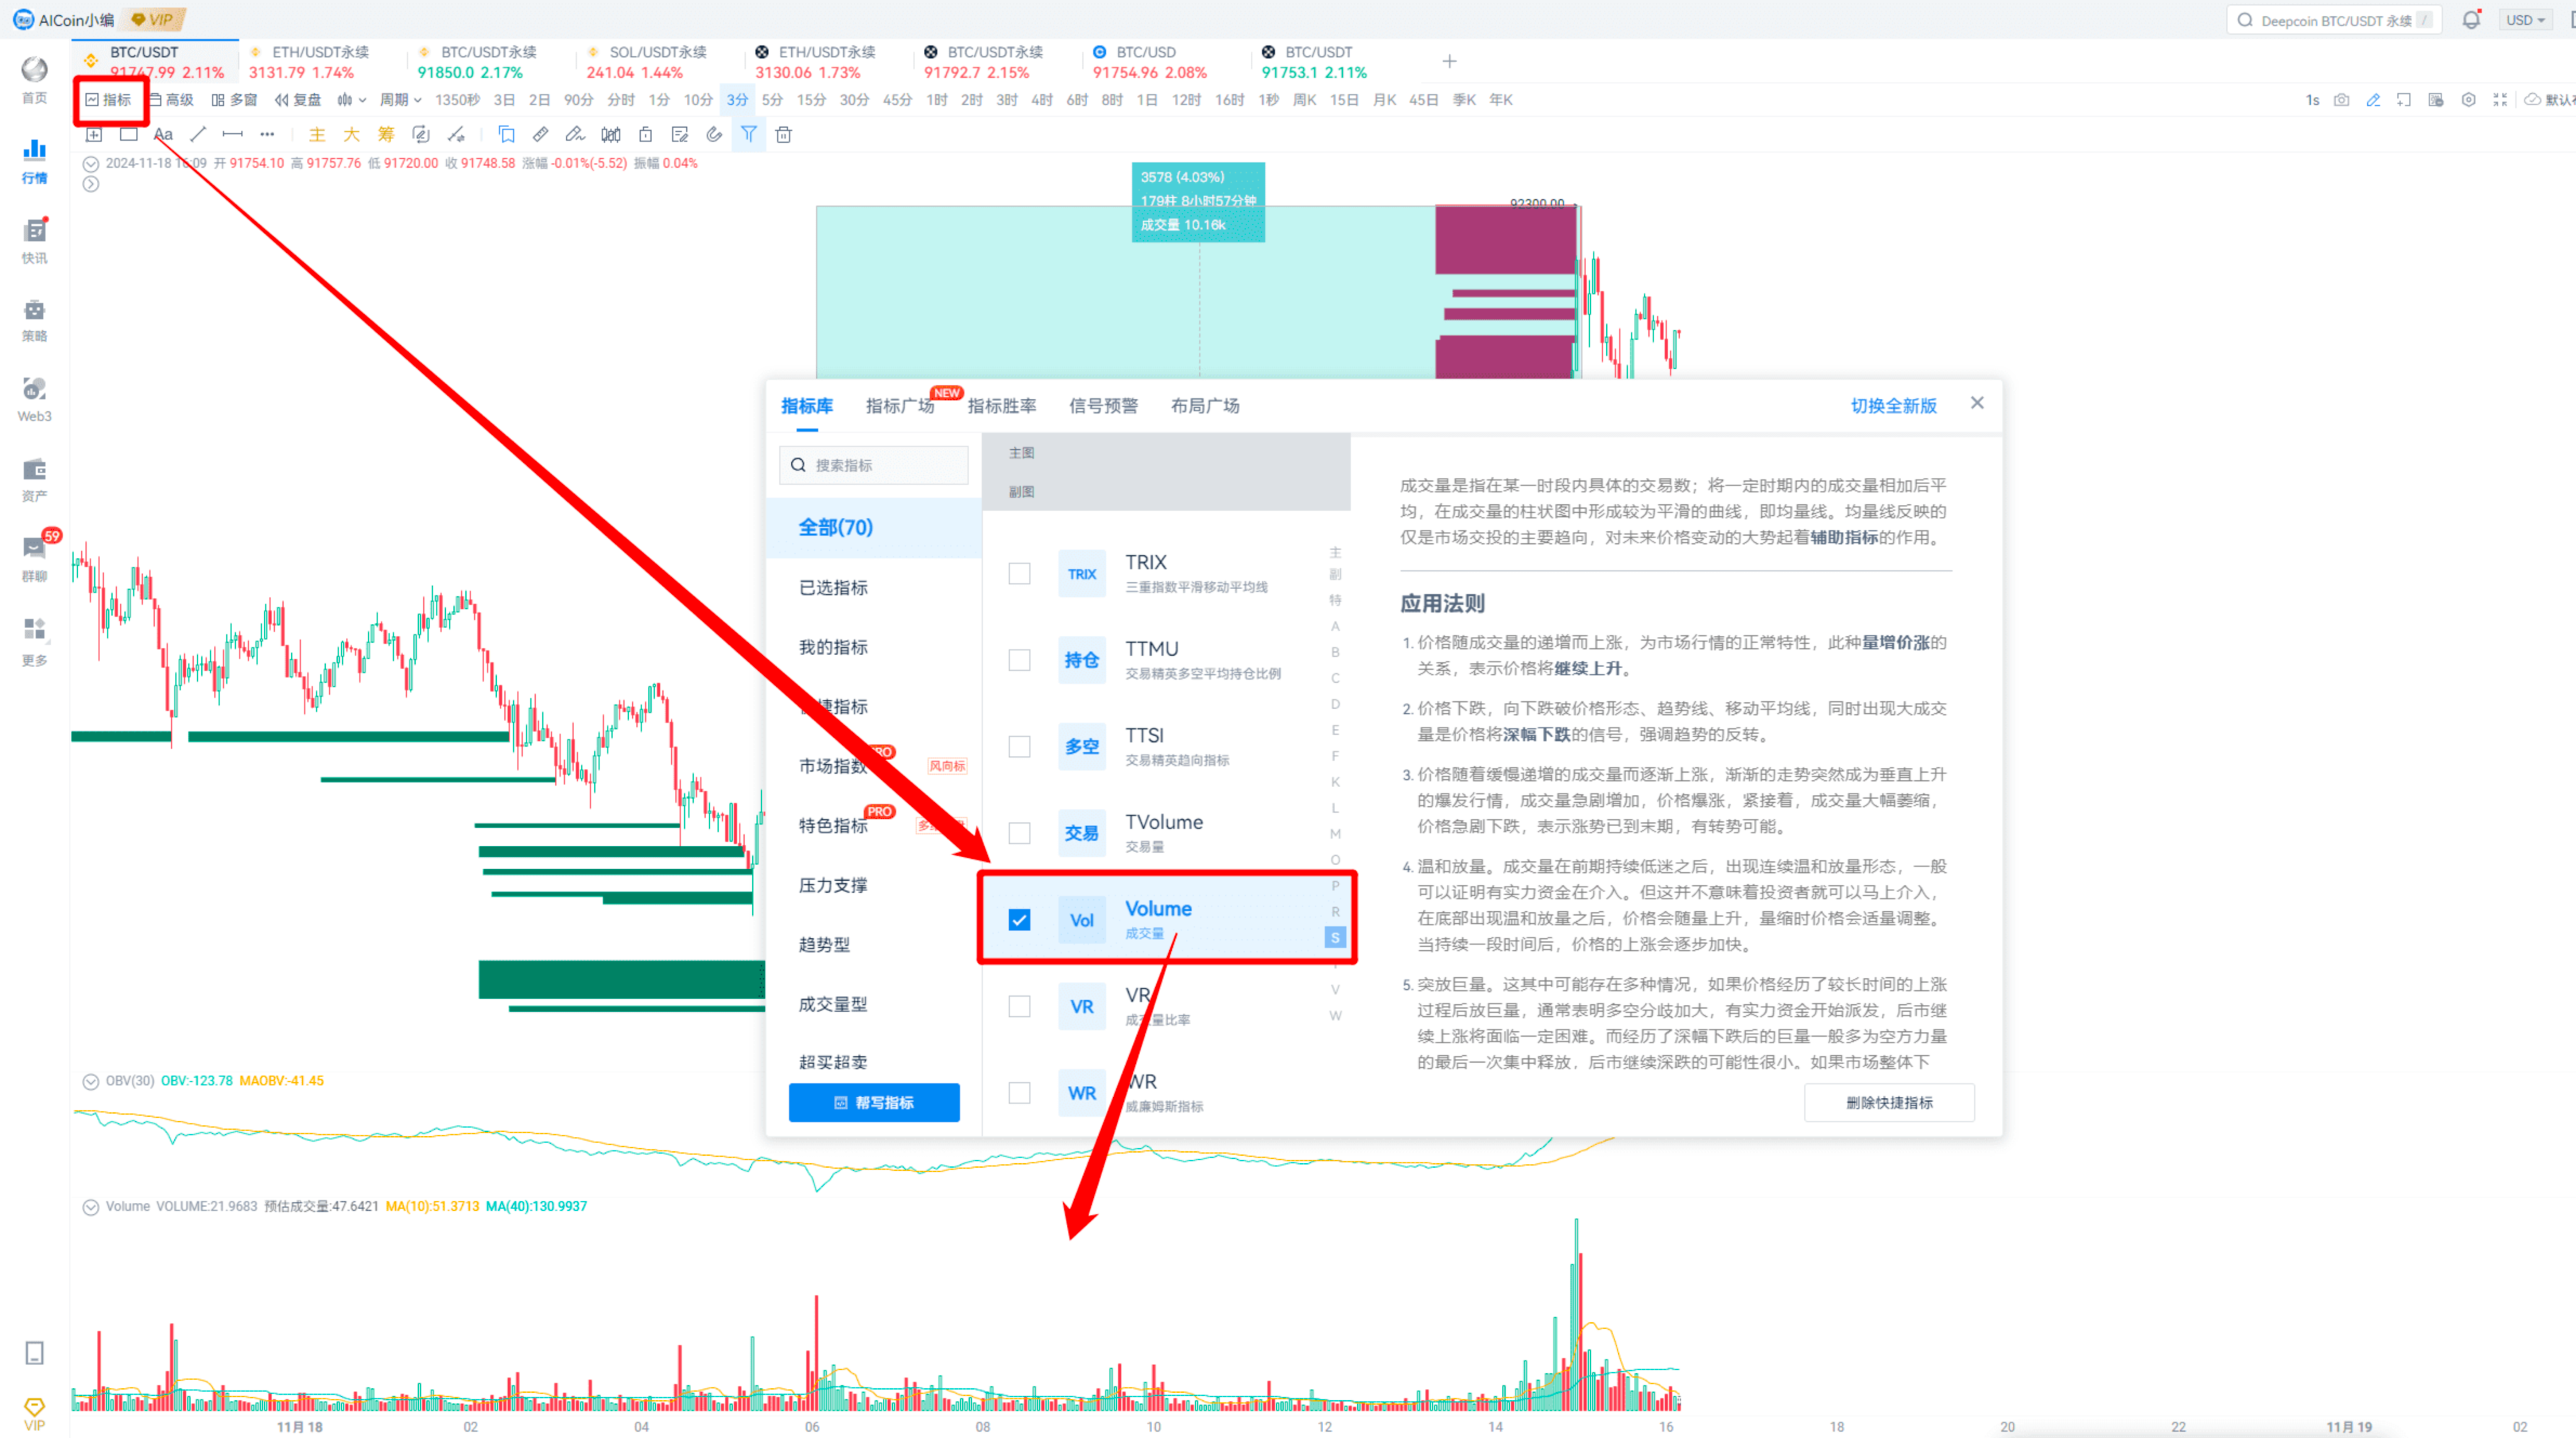
Trading Volume refers to the specific quantity of trades within a certain period, which can directly reflect the inflow of funds.
Interpreting trading volume in isolation is meaningless, as it simultaneously represents equal numbers of buyers and sellers. It usually needs to be combined with price trends, the position of the price, and indicators such as limit orders and market orders.
As the saying goes, beginners look at price, while veterans look at volume. But how exactly should we look at it?
There are mainly the following patterns.
6 Patterns of Trading Volume
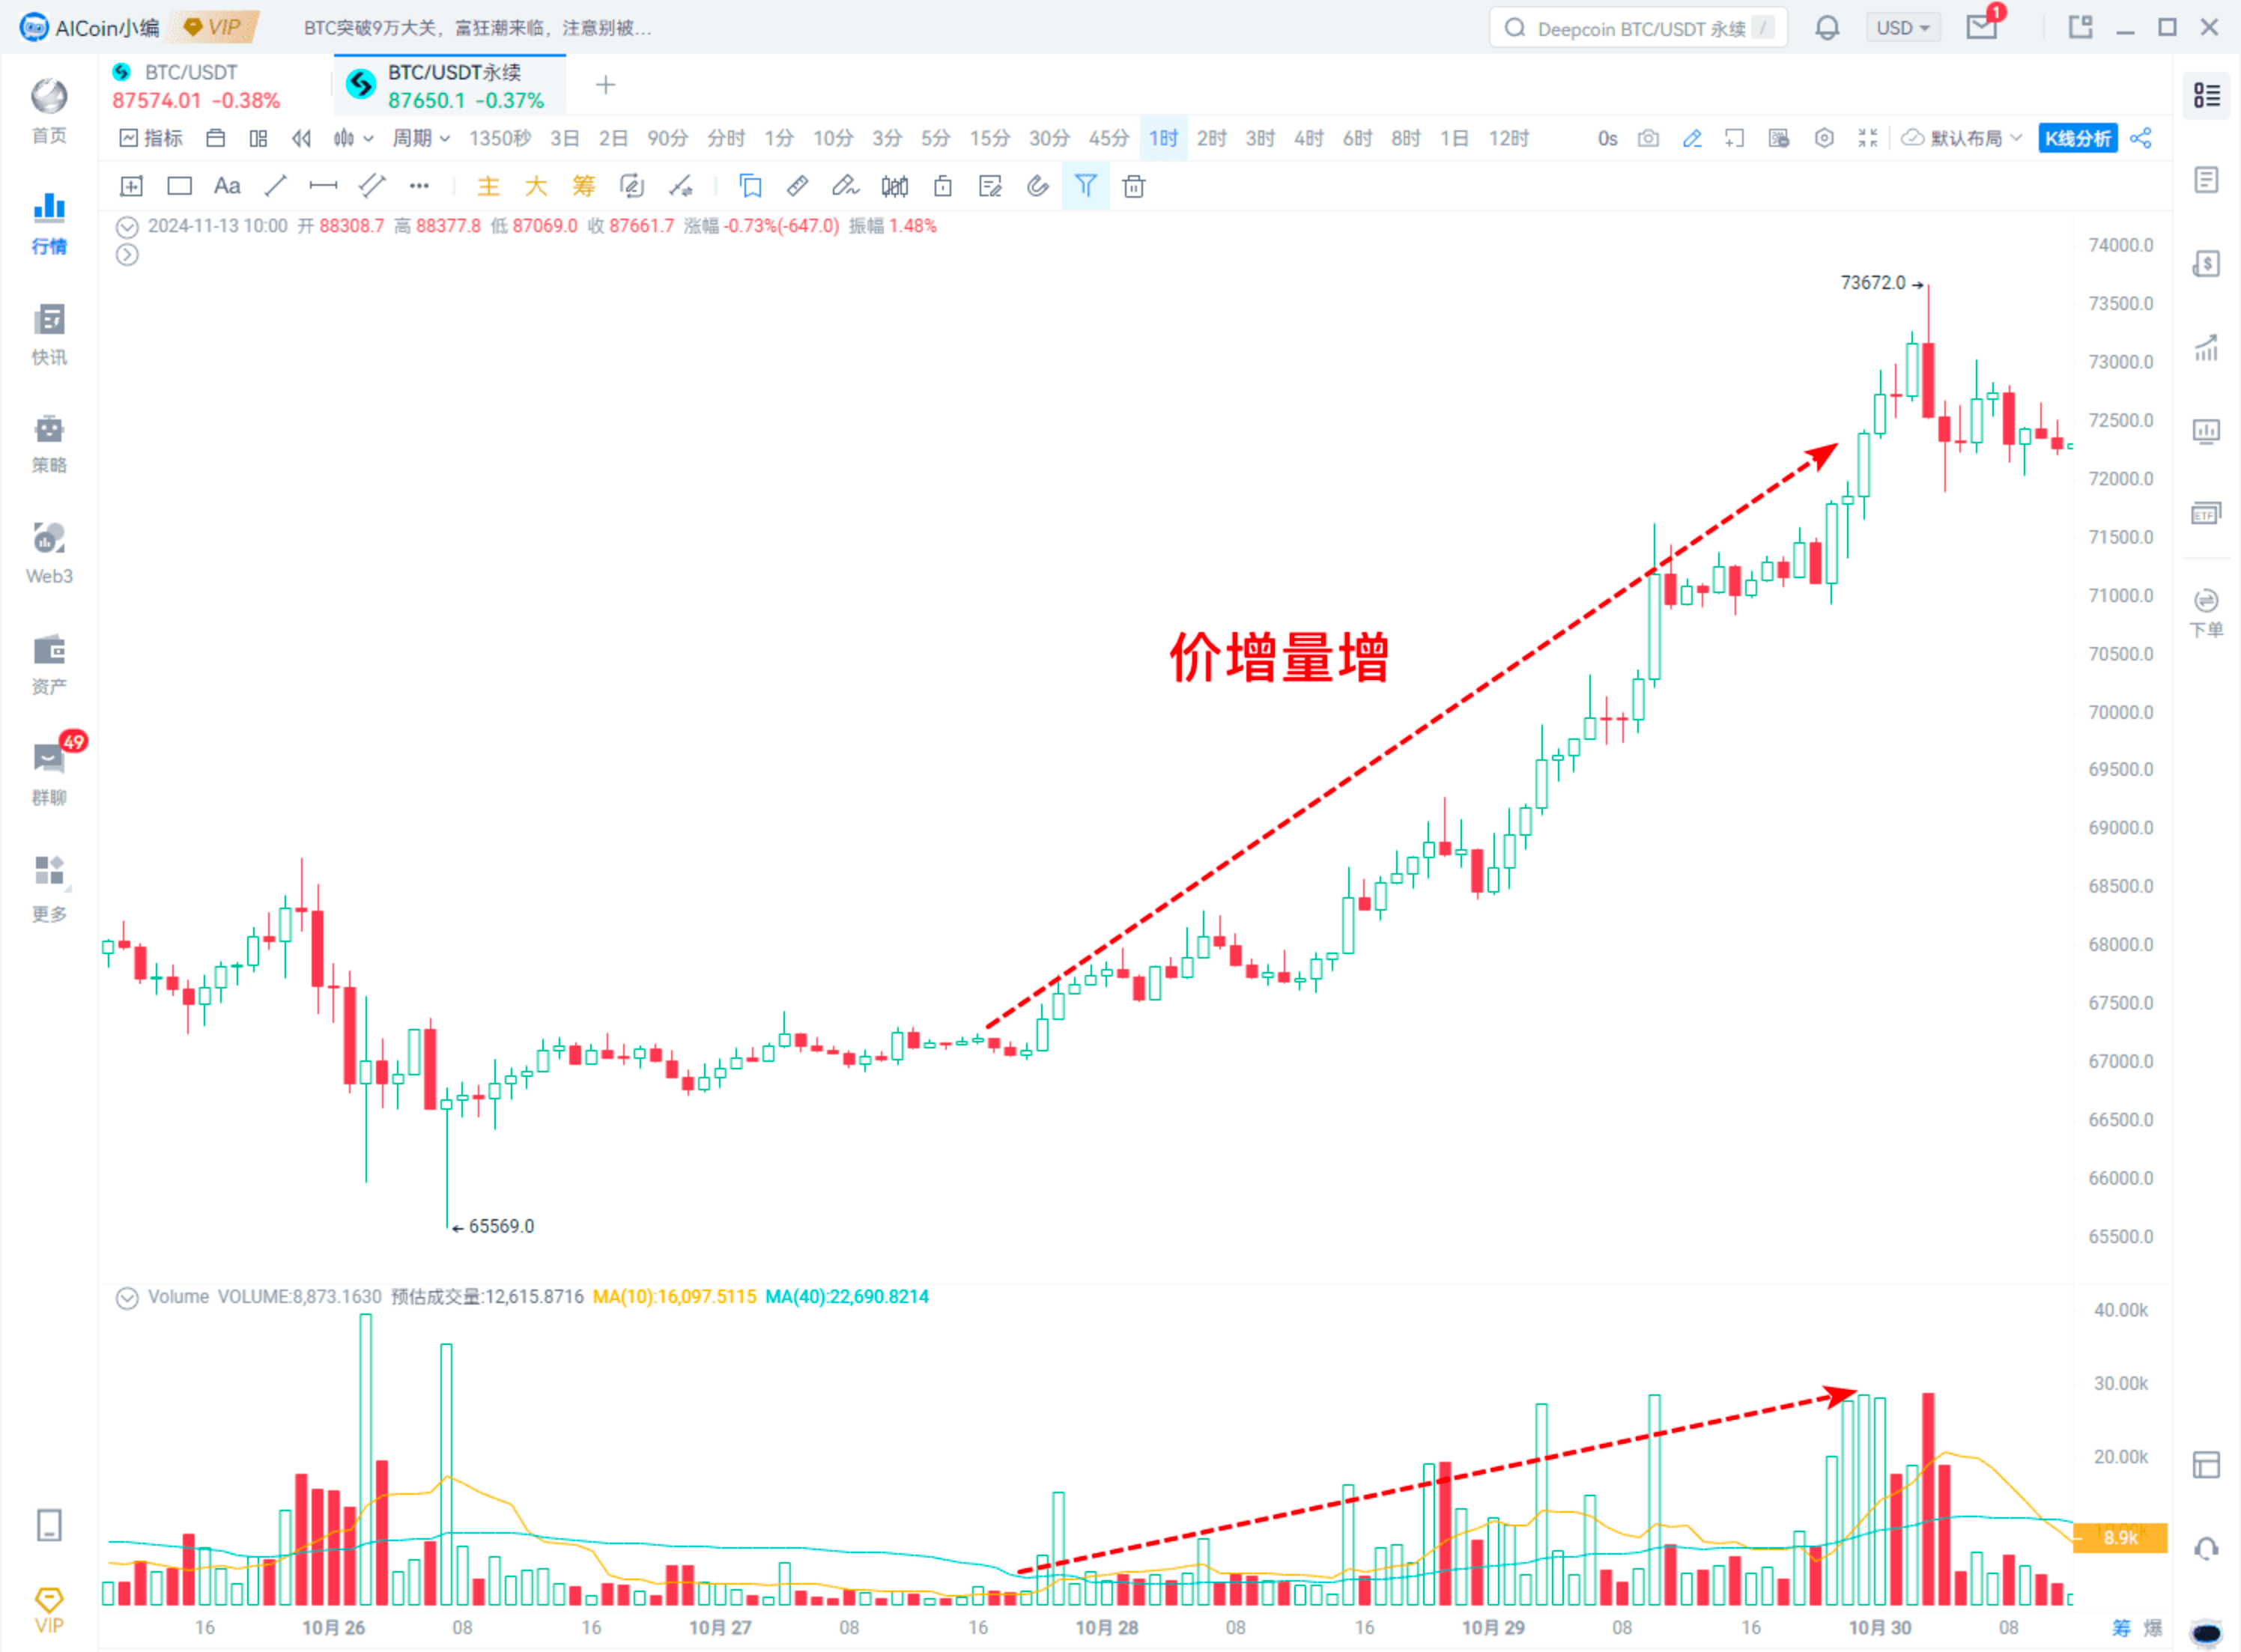
1. Price Up, Volume Up
Literally, both price and trading volume are increasing. This is a strong bullish signal!
It usually indicates strong buying power, an active and optimistic market.
Example:
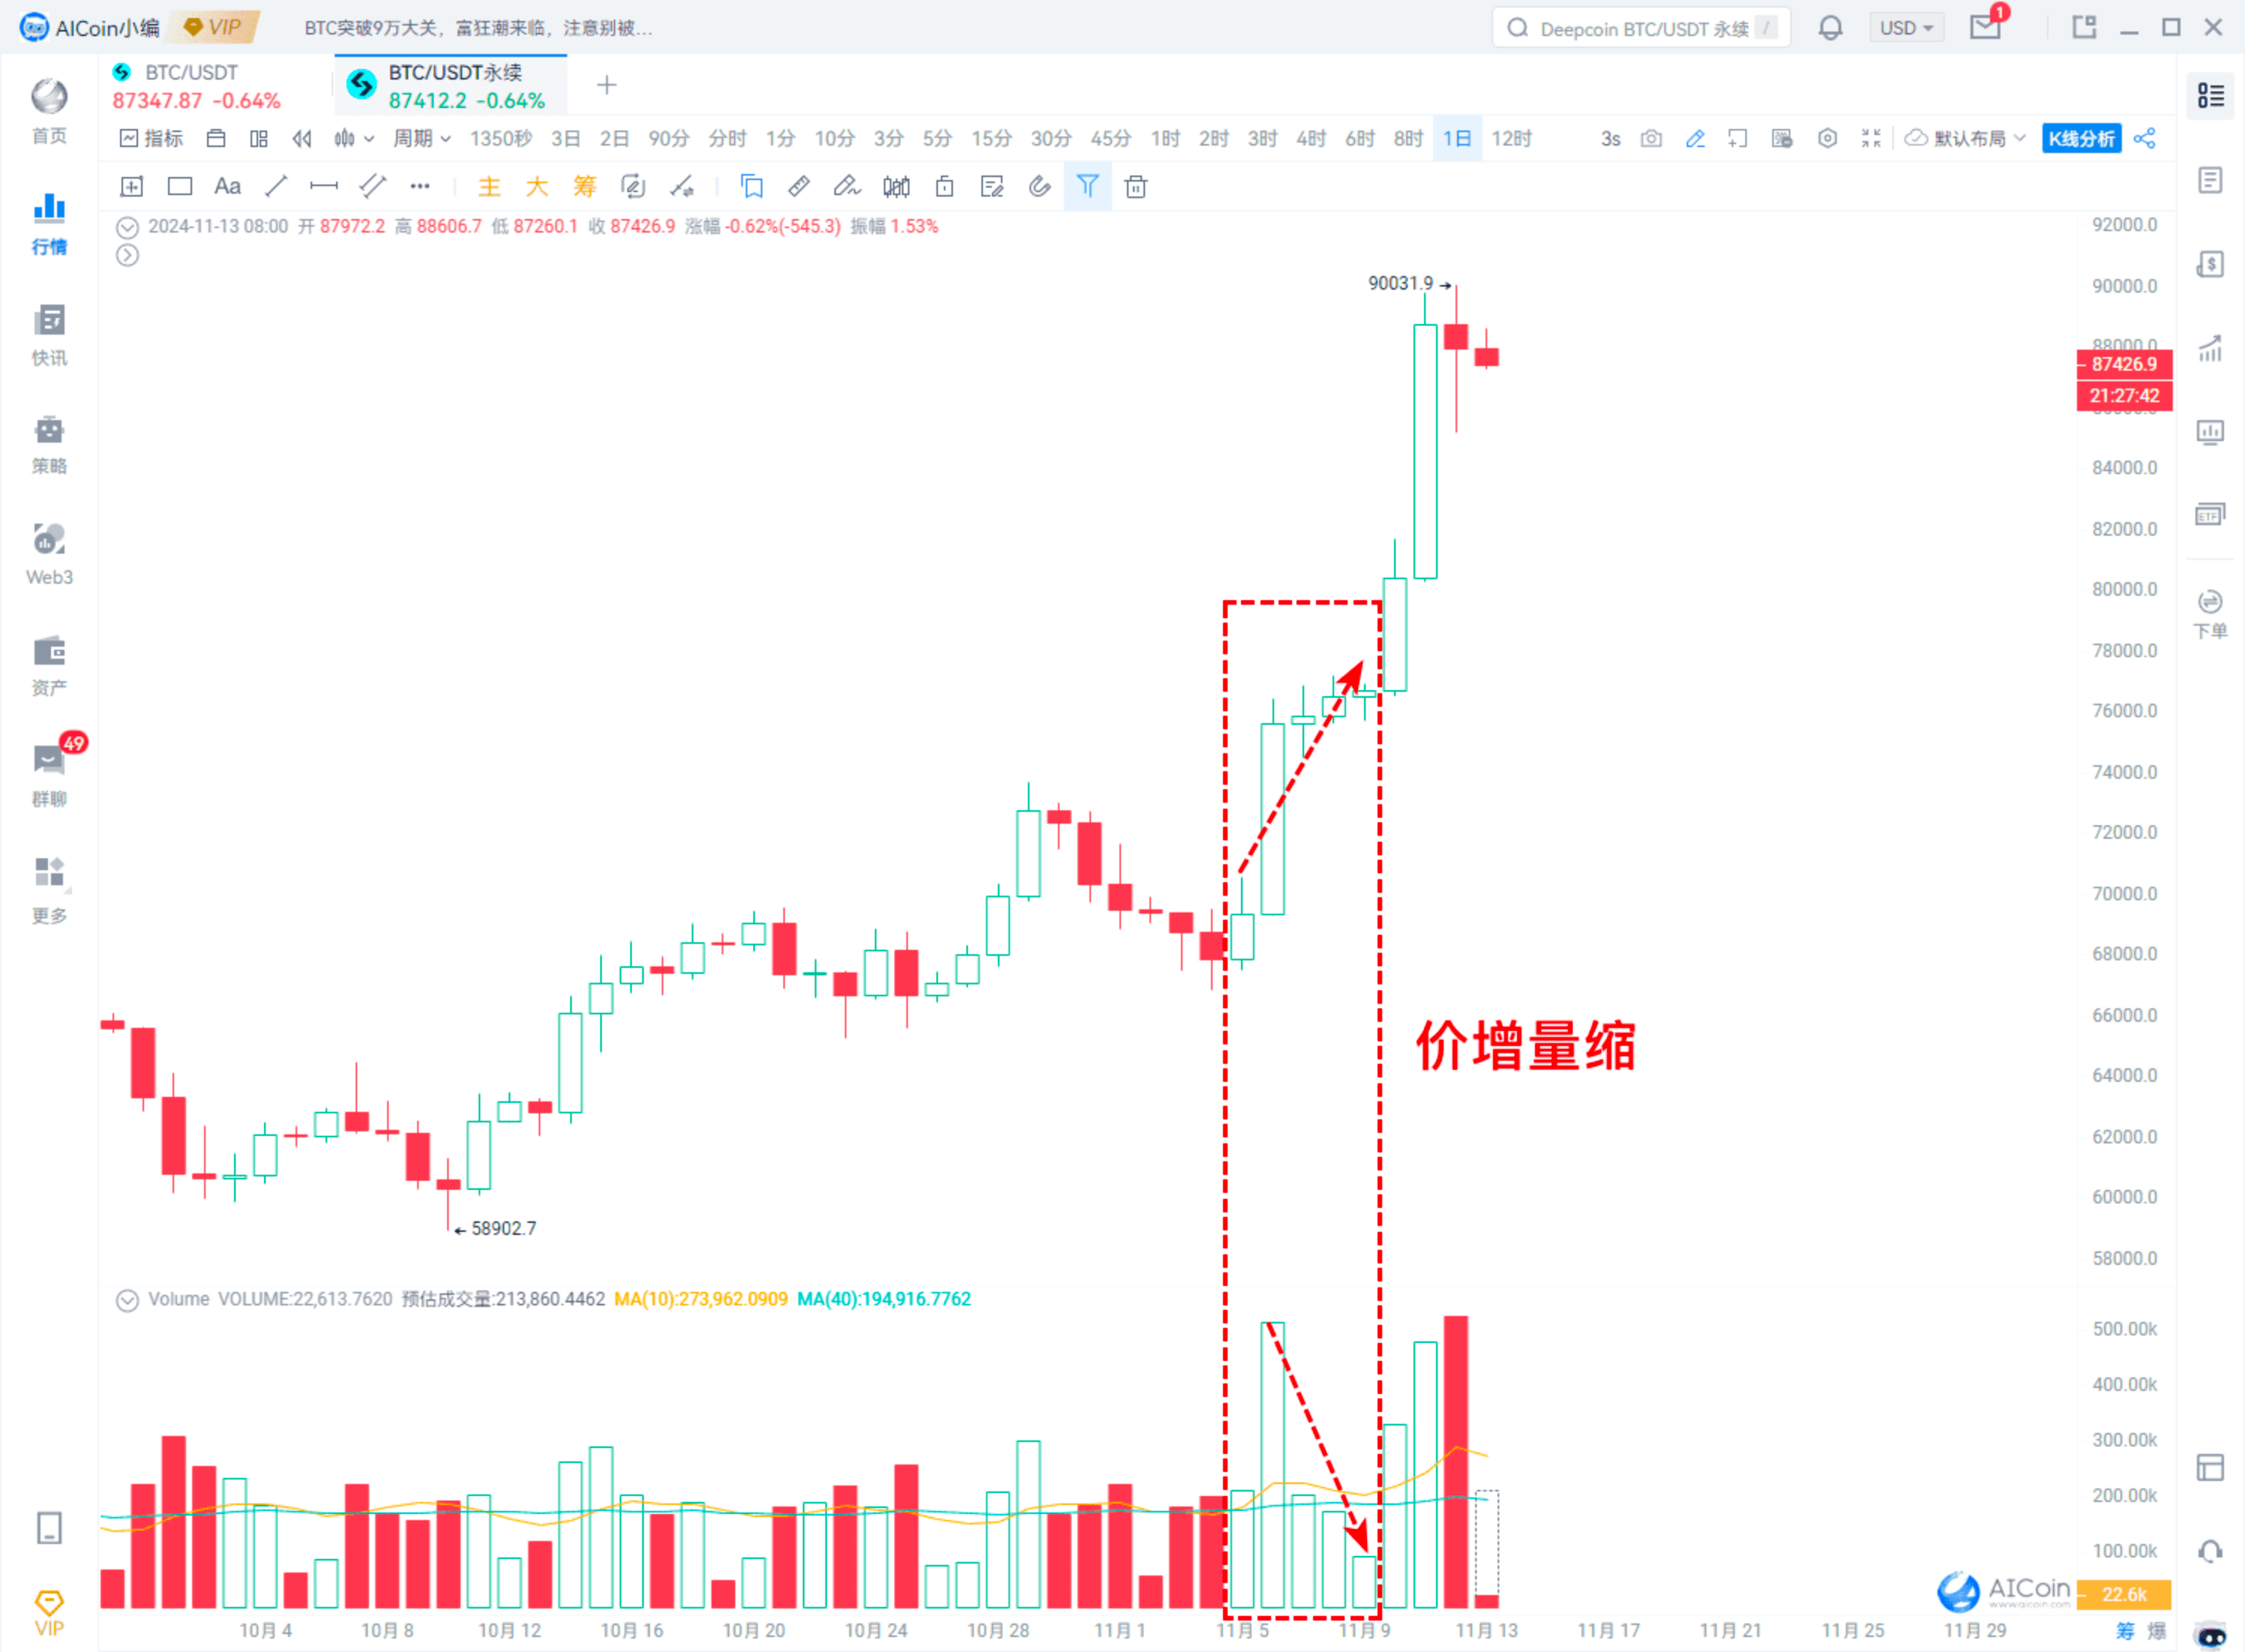
2. Price Up, Volume Down
That is, the price is rising, but the trading volume is decreasing.
This phenomenon is normal in the early stages of a bullish trend; however, if it appears at the end of a trend, it signals a risk of reversal.
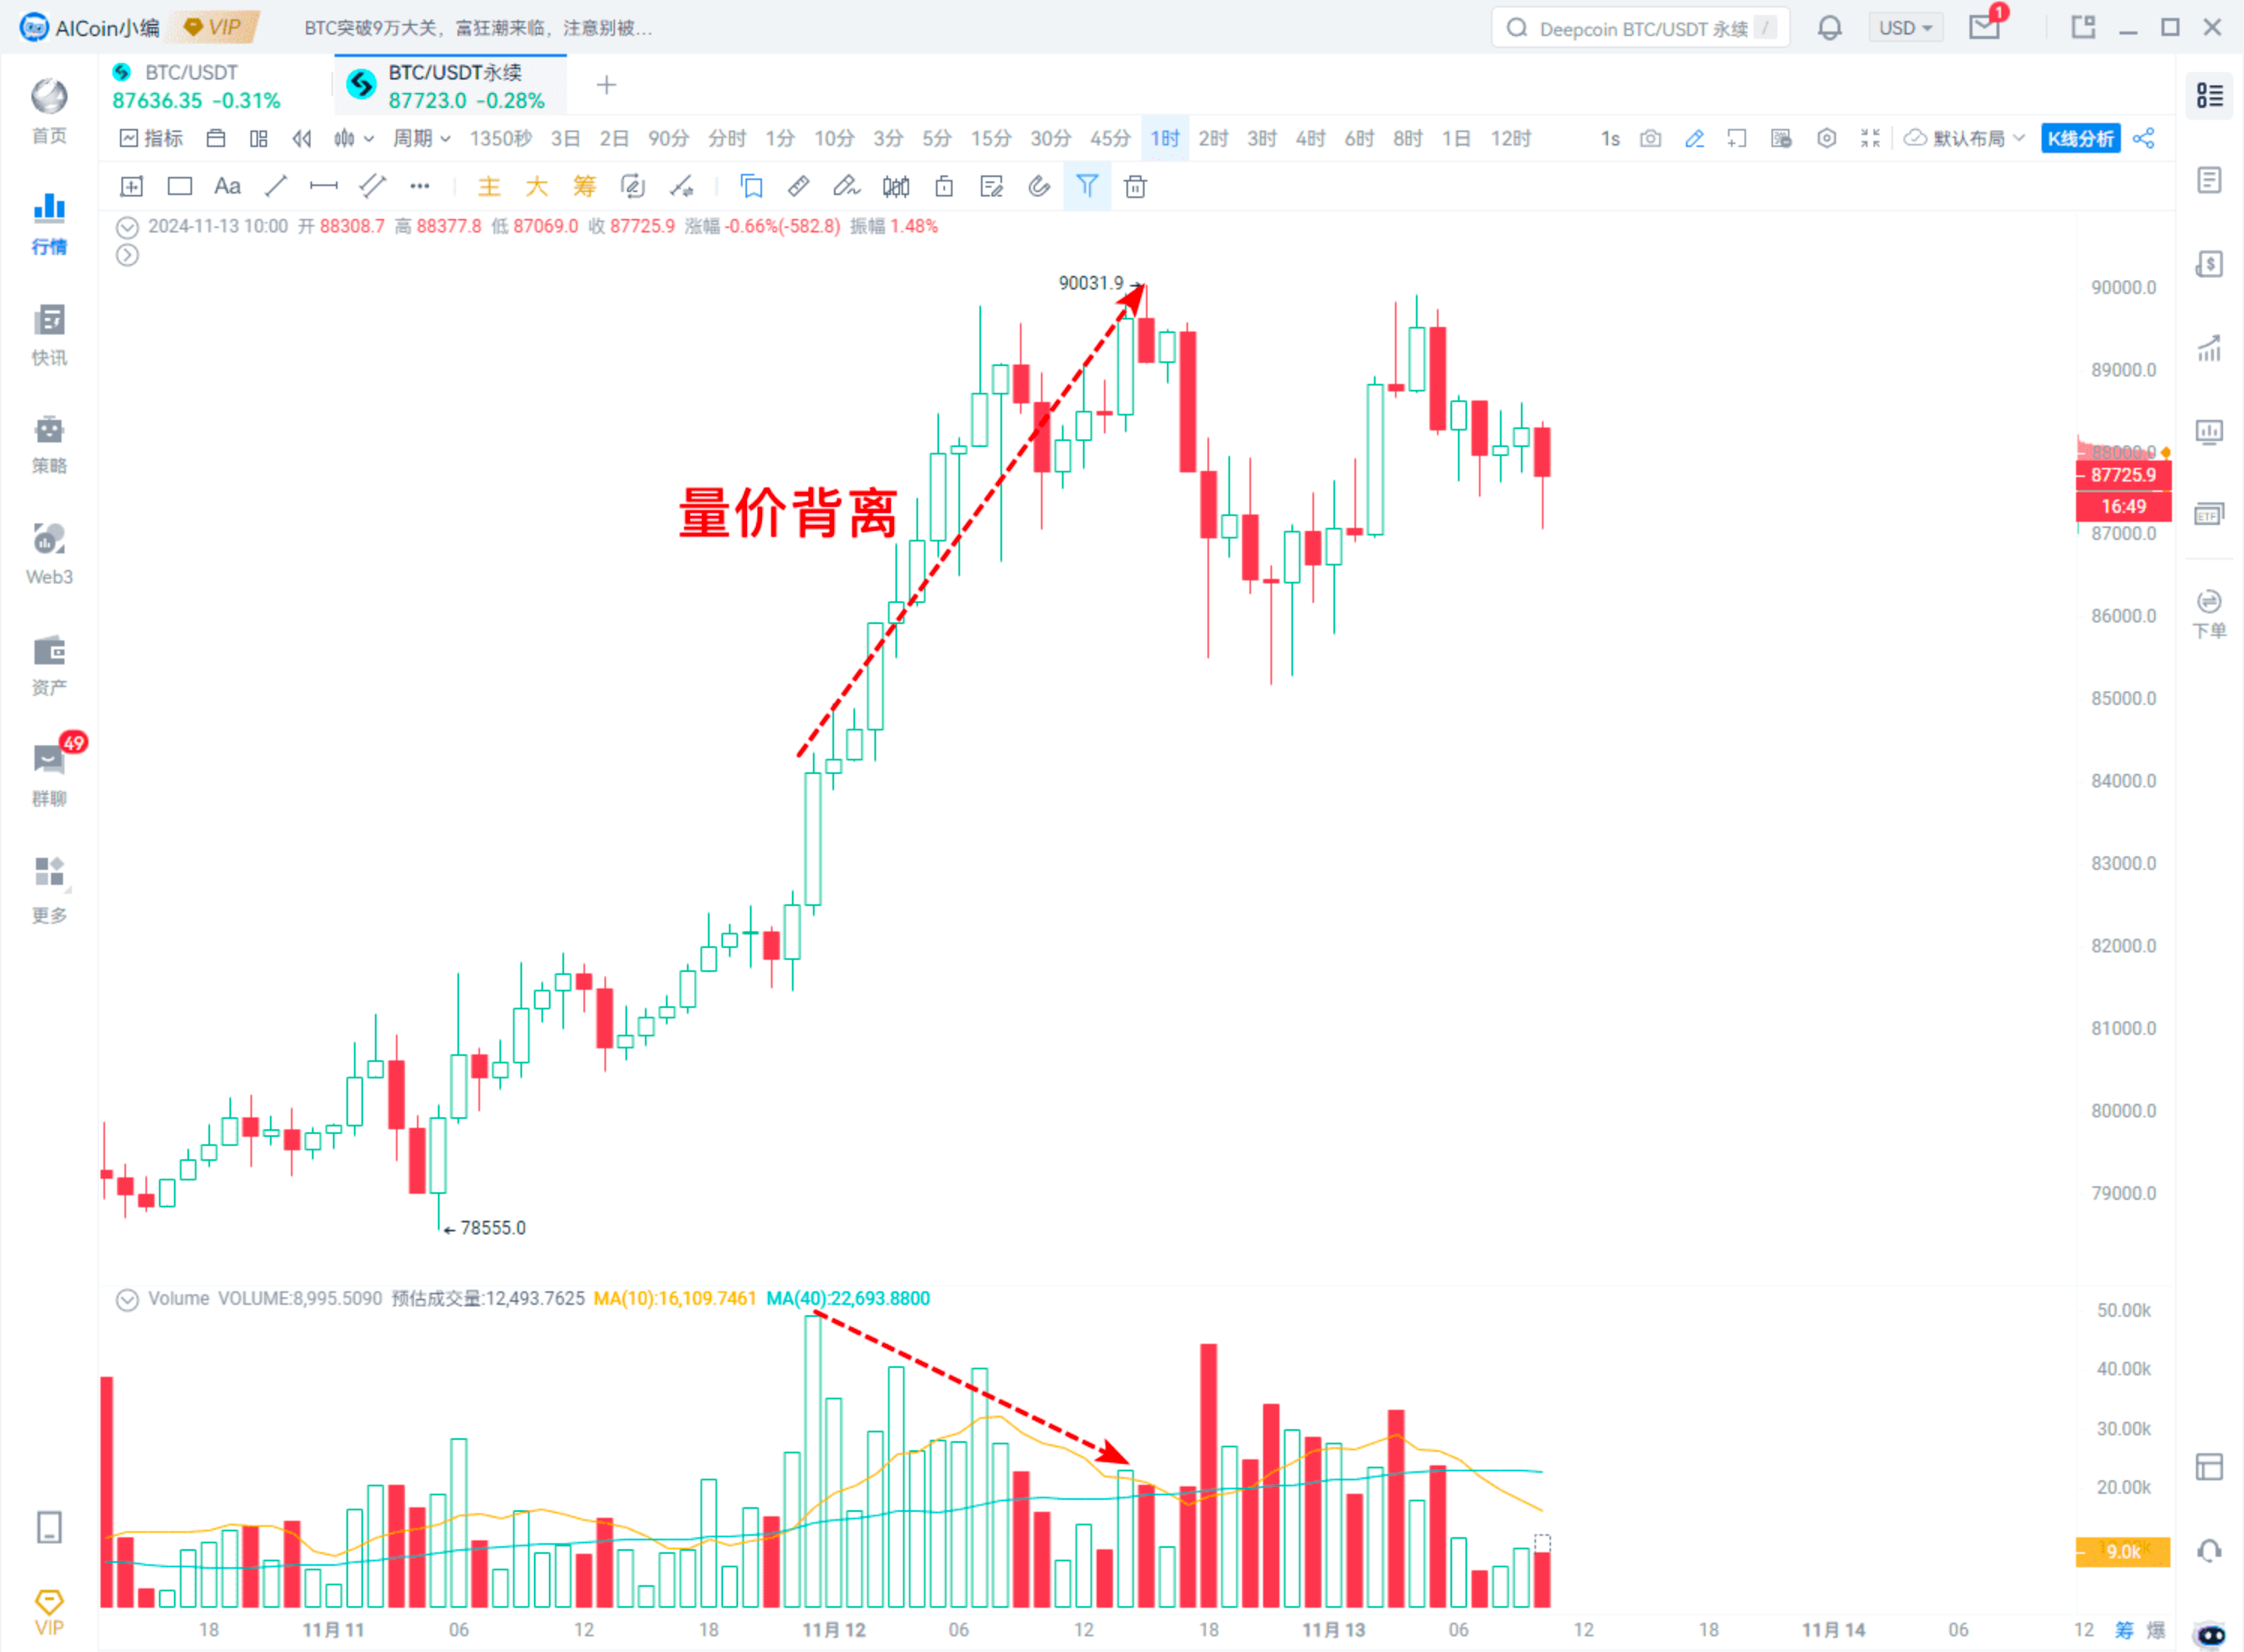
3. Divergence Between Price and Volume
The trends of price and trading volume are inconsistent.
For example, if the price is rising but the trading volume is gradually decreasing, this is a signal of insufficient momentum, indicating that the upward trend may not be sustainable and warrants caution for a potential pullback.
4. Price Down, Volume Up
The price is falling while trading volume increases.
This is a bearish signal, indicating strong selling pressure.
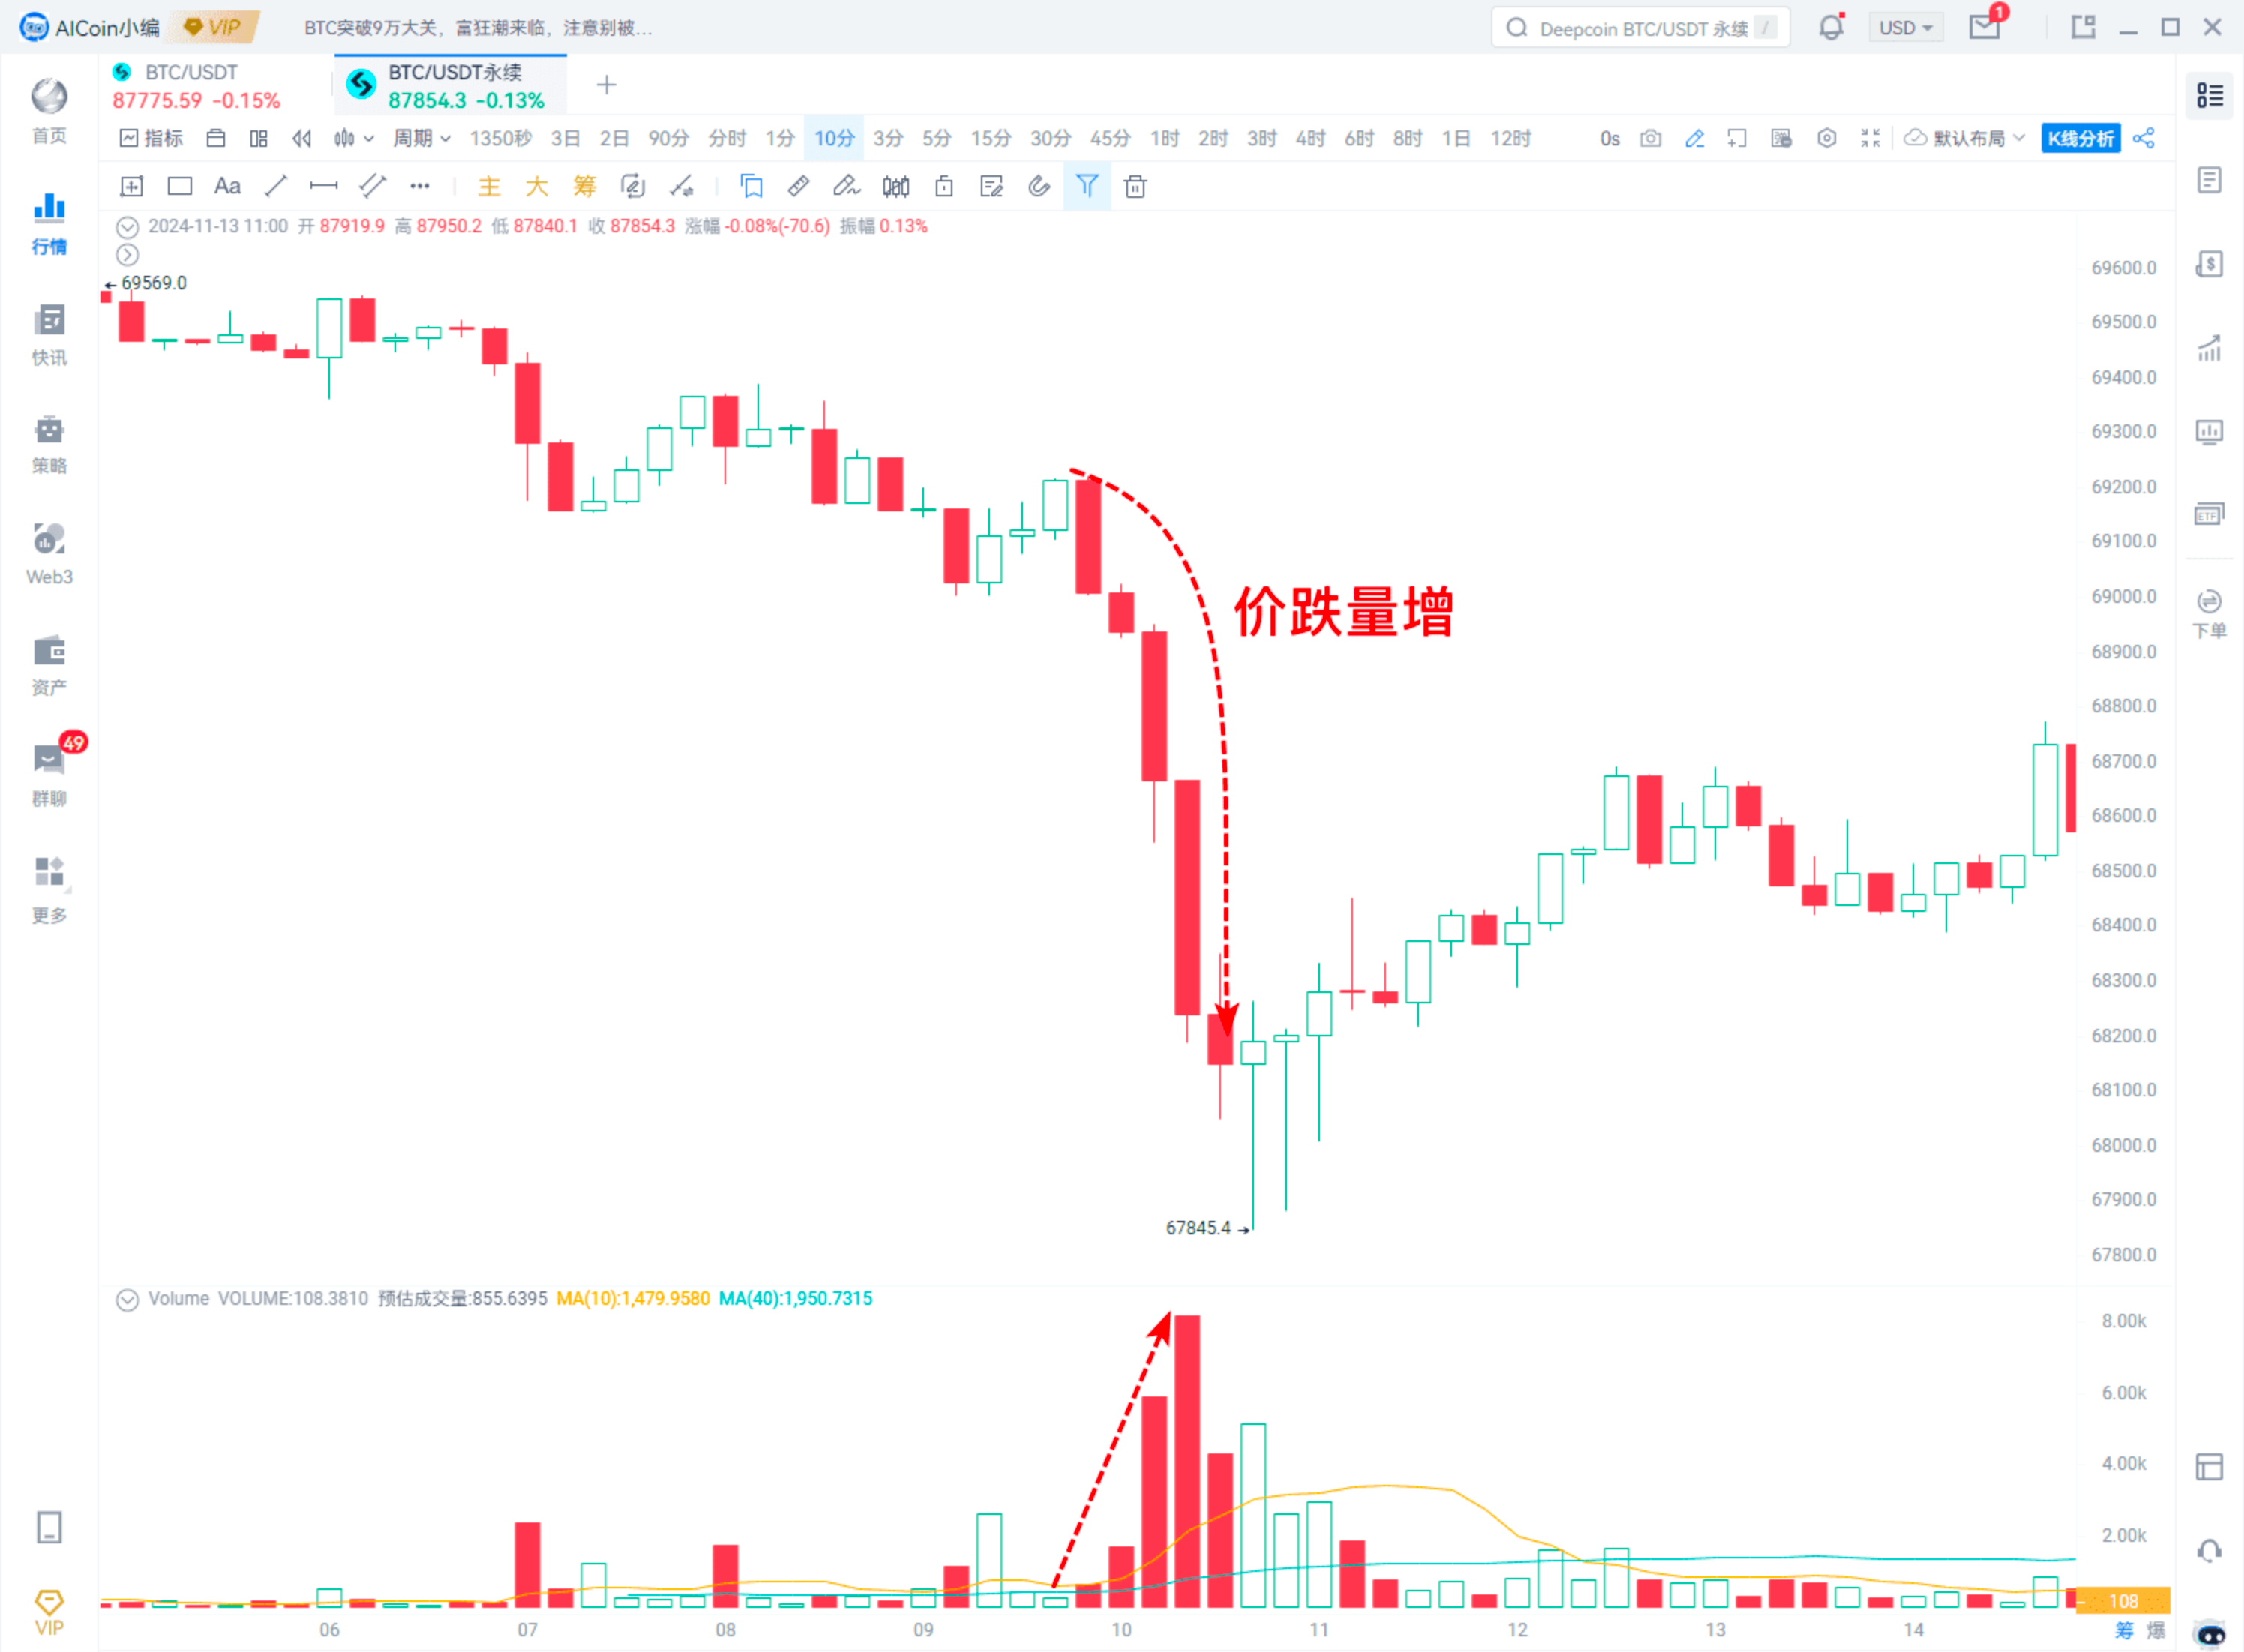
However, if it is an oversold market, it usually signals a reversal.
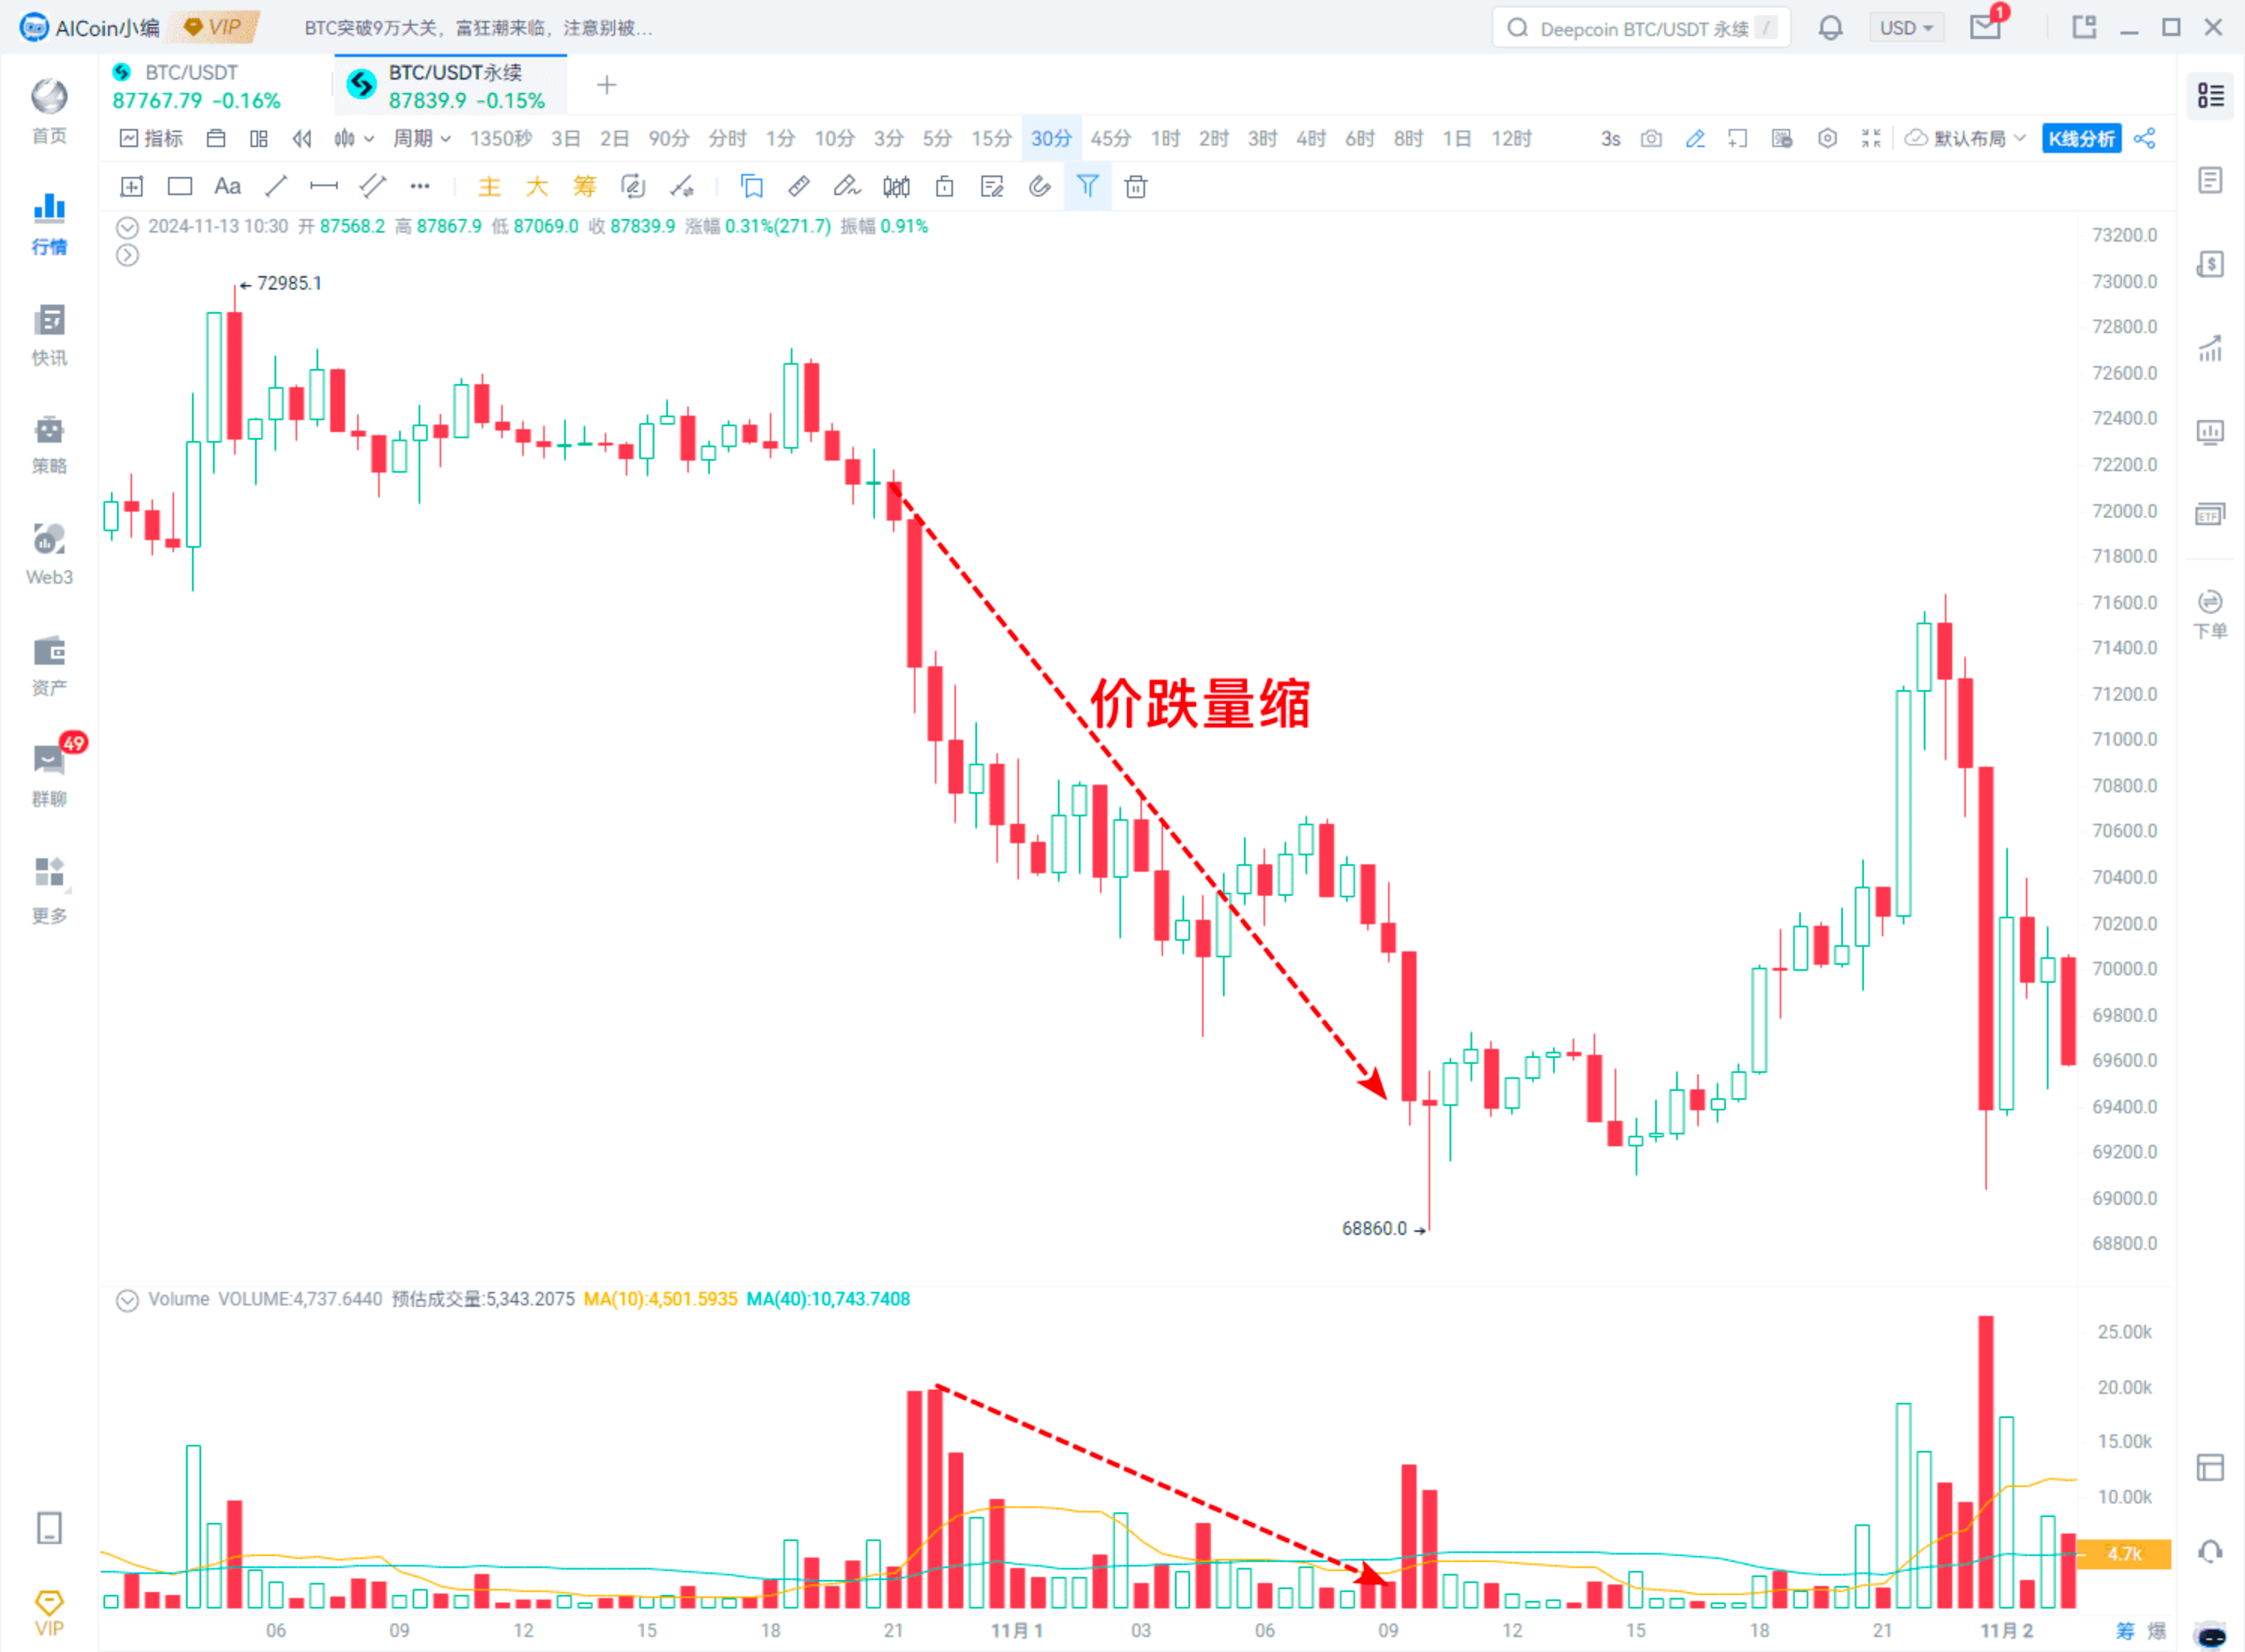
5. Price Down, Volume Down
The price is falling but trading volume is decreasing.
This generally signals that the downtrend is nearing its end.
6. Price Stable, Volume Stable
Both price and trading volume remain stable, typically occurring in a sideways market.
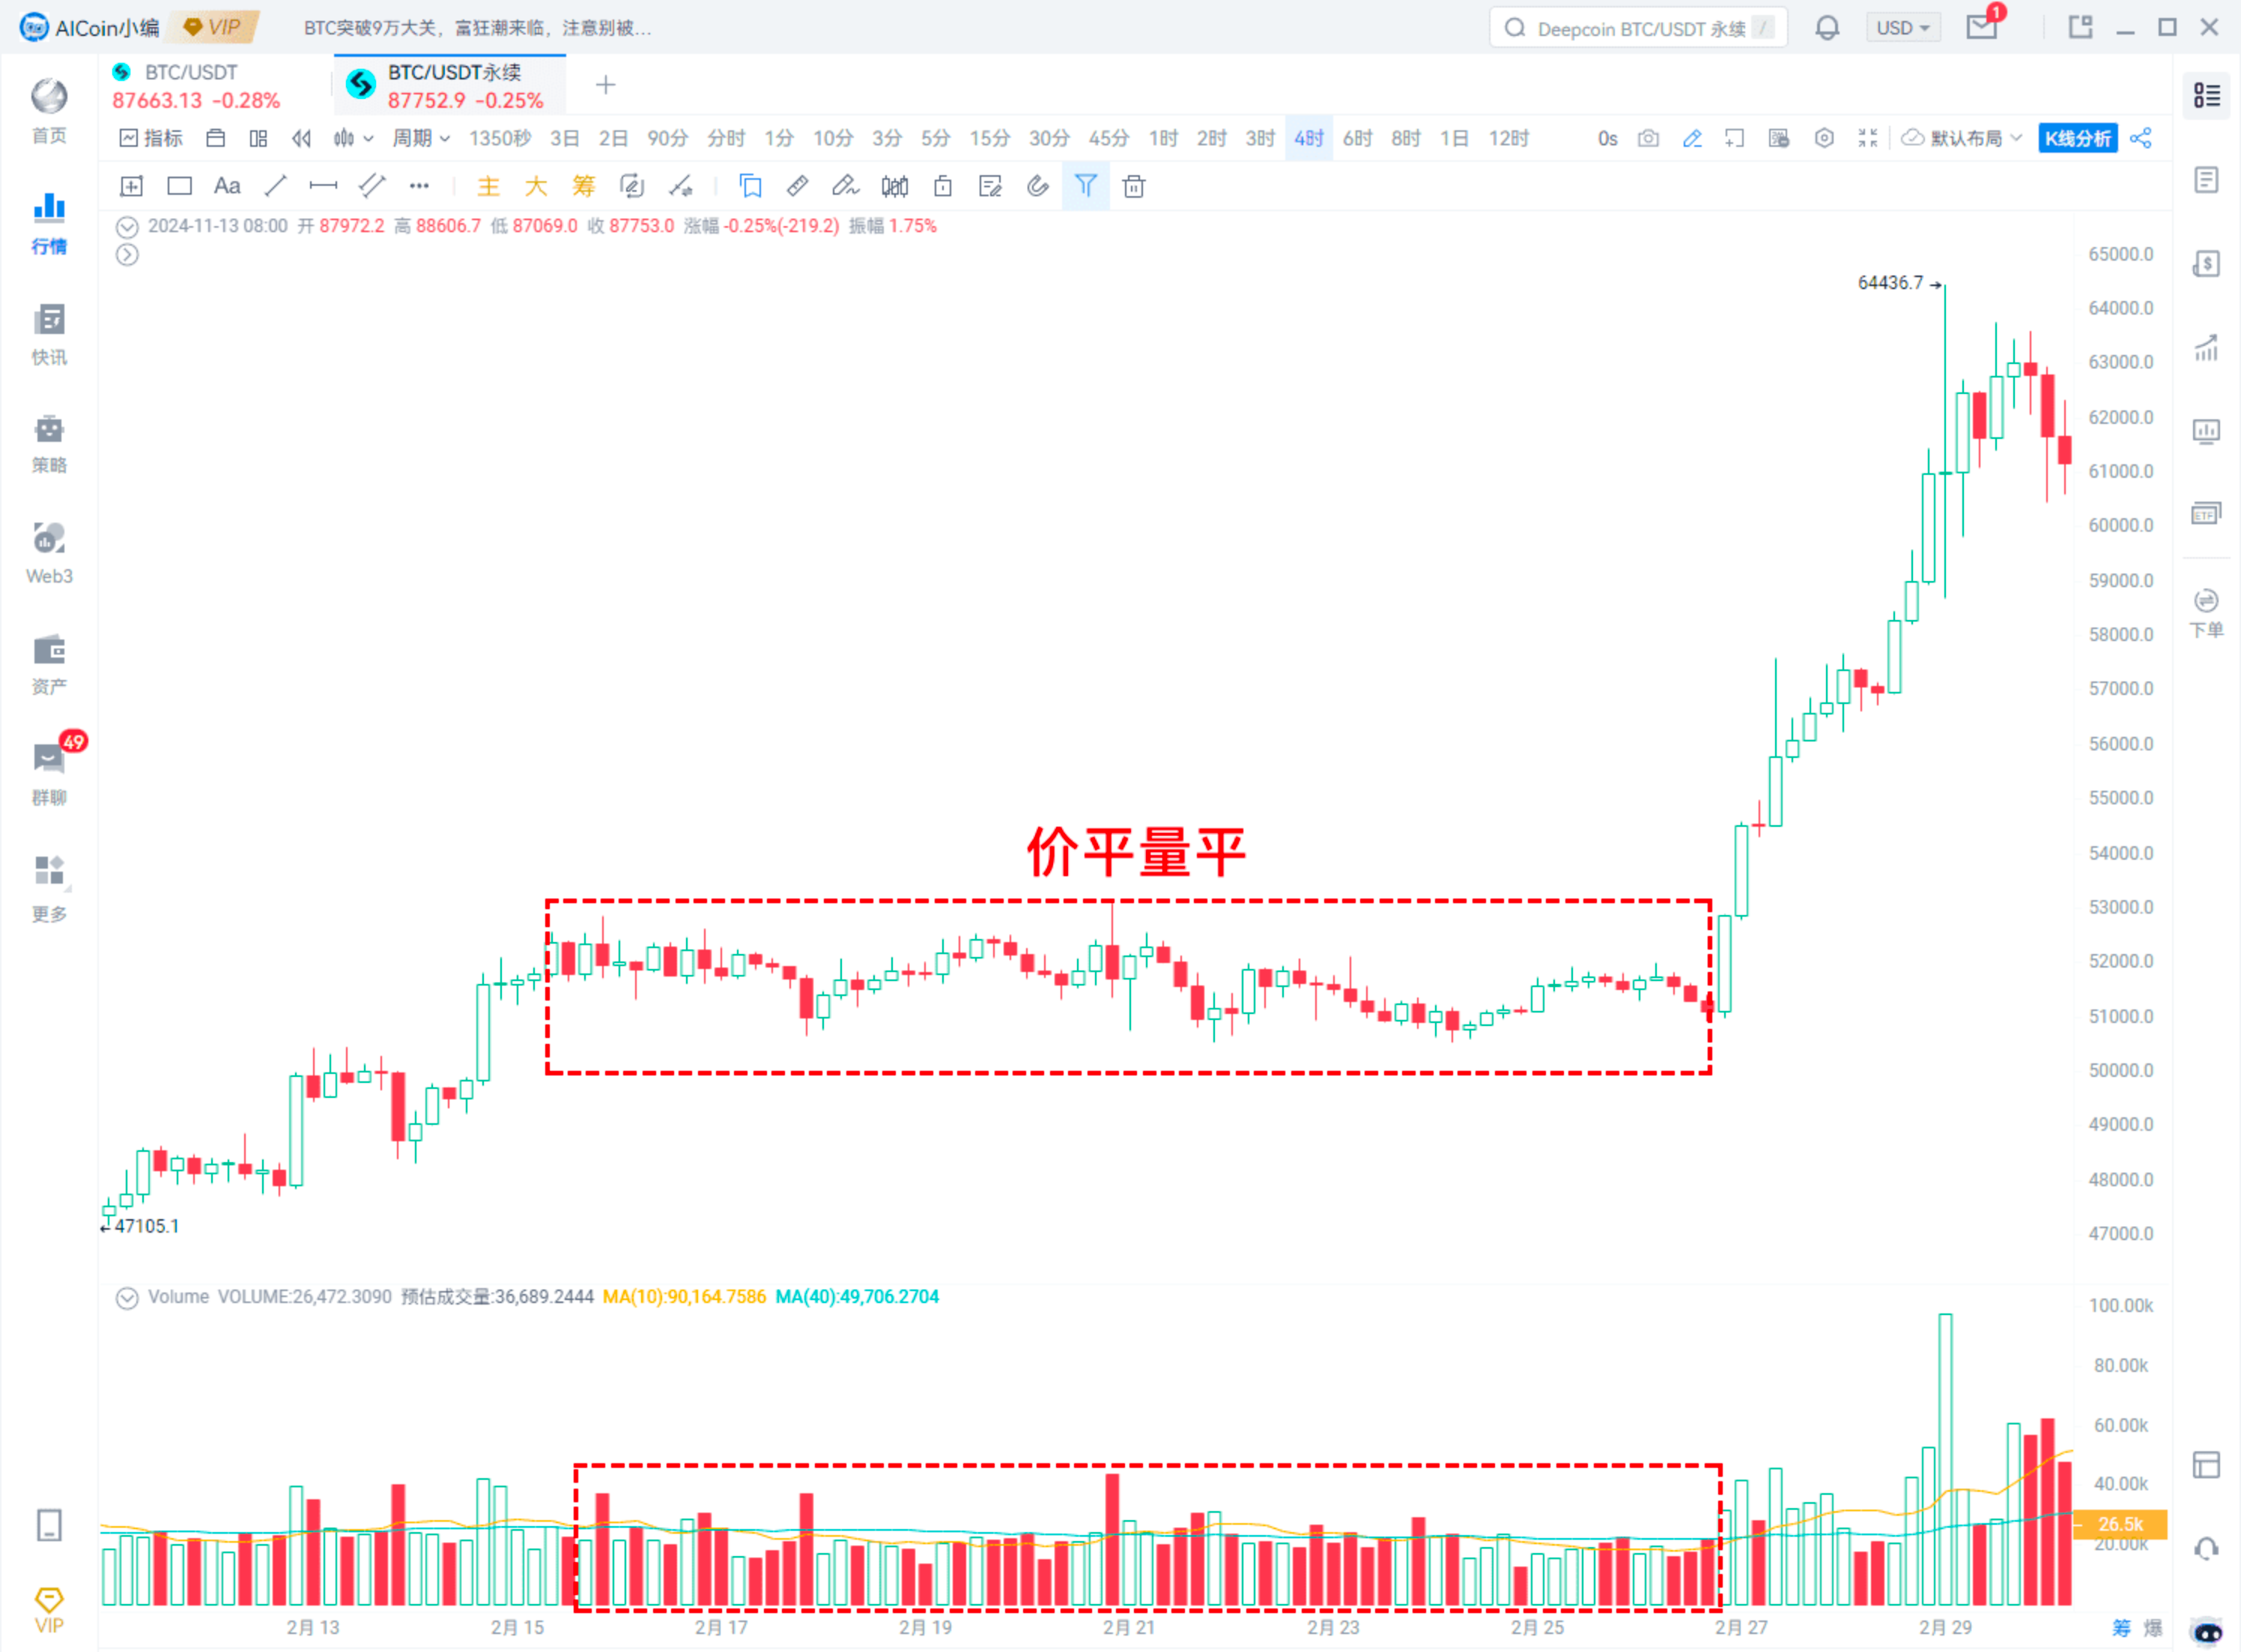
There are also patterns of price stable with volume increasing or decreasing; both require a breakout signal to change the situation.
To understand it simply, you can refer to this table.
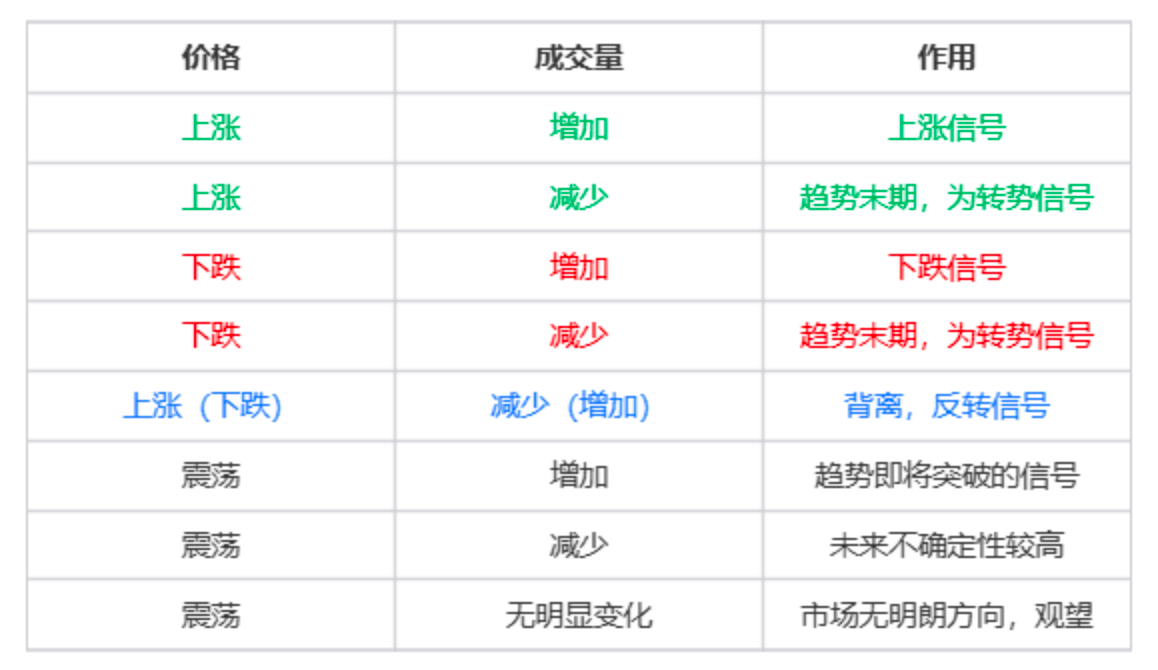
In fact, if beginners only rely on these patterns for judgment, they will encounter a problem, which is:
How to Identify Breakout Signals in Trading Volume?
Method 1: Pin Bar + Increase in Volume
This can be used to identify reversal signals.
As shown in the text signal in the image:
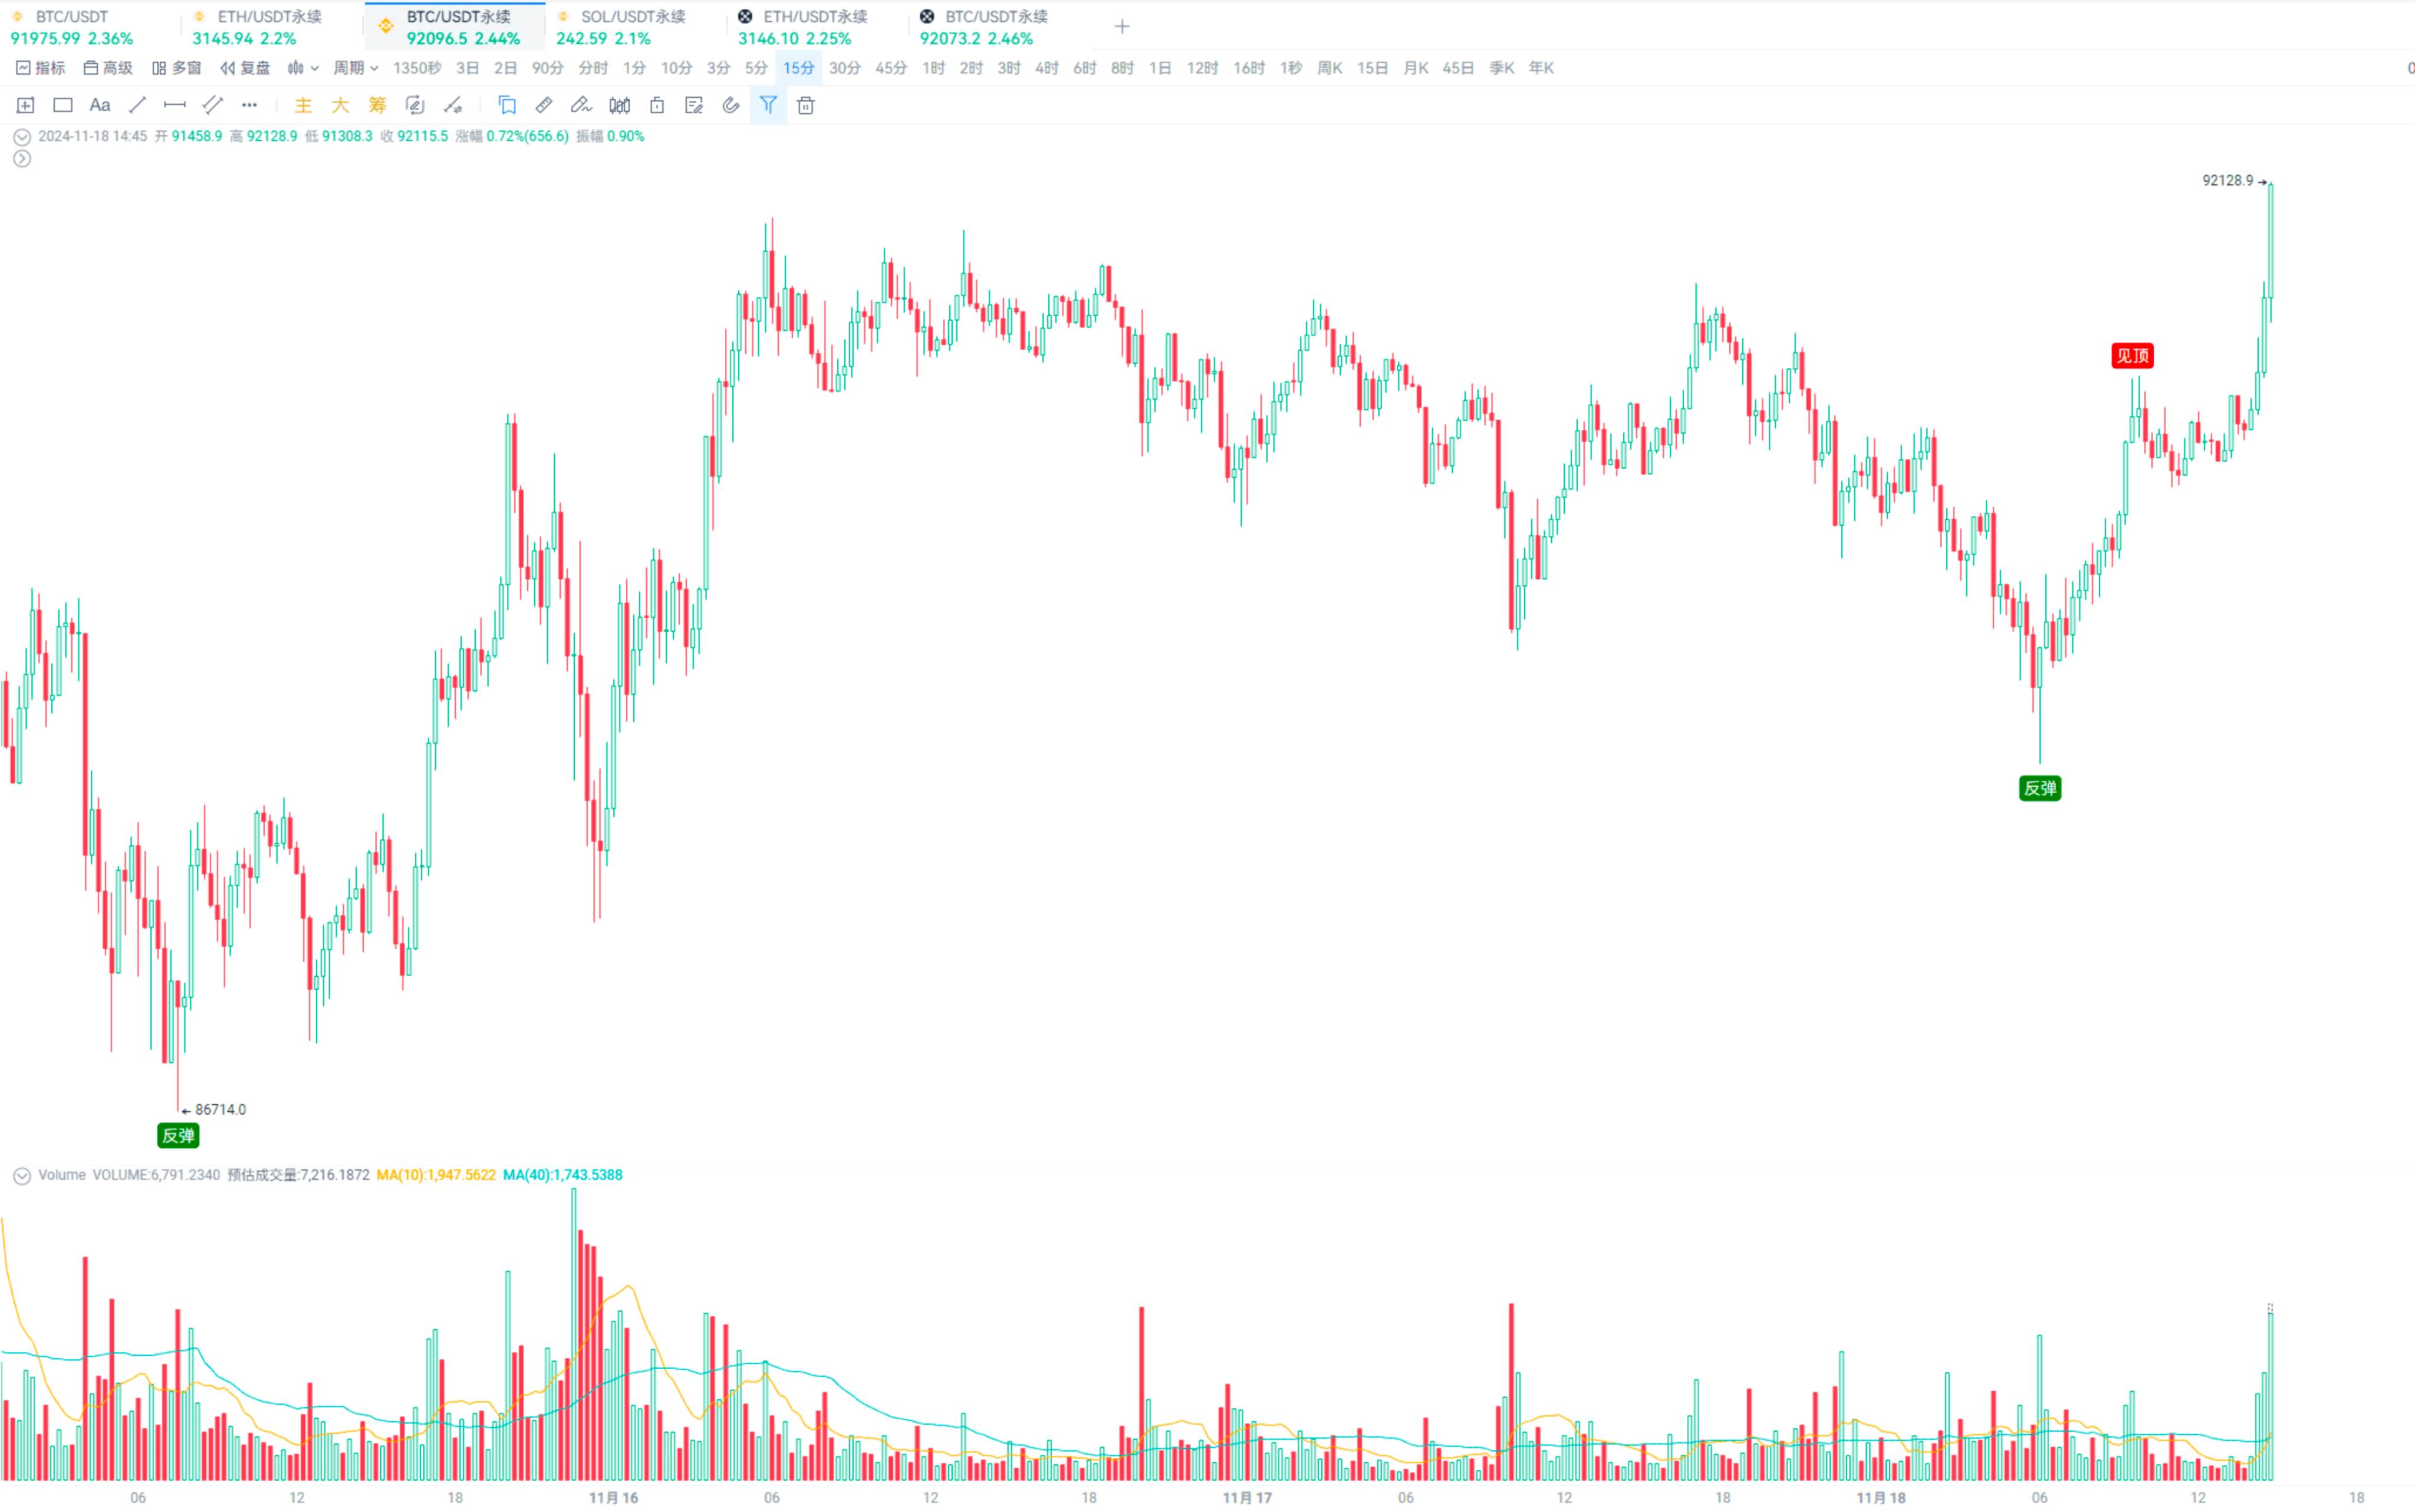
This can be monitored using custom indicators.
Regarding pin bars, you can determine the length of the shadow, the amplitude of the candlestick, or the range of high and low prices based on the currency pairs and periods you commonly use, which can filter out a lot of noise signals.
A good method is to use a spinning top candlestick pattern + increase in volume for judgment; when the pattern appears, and the volume increases, the effect is excellent!
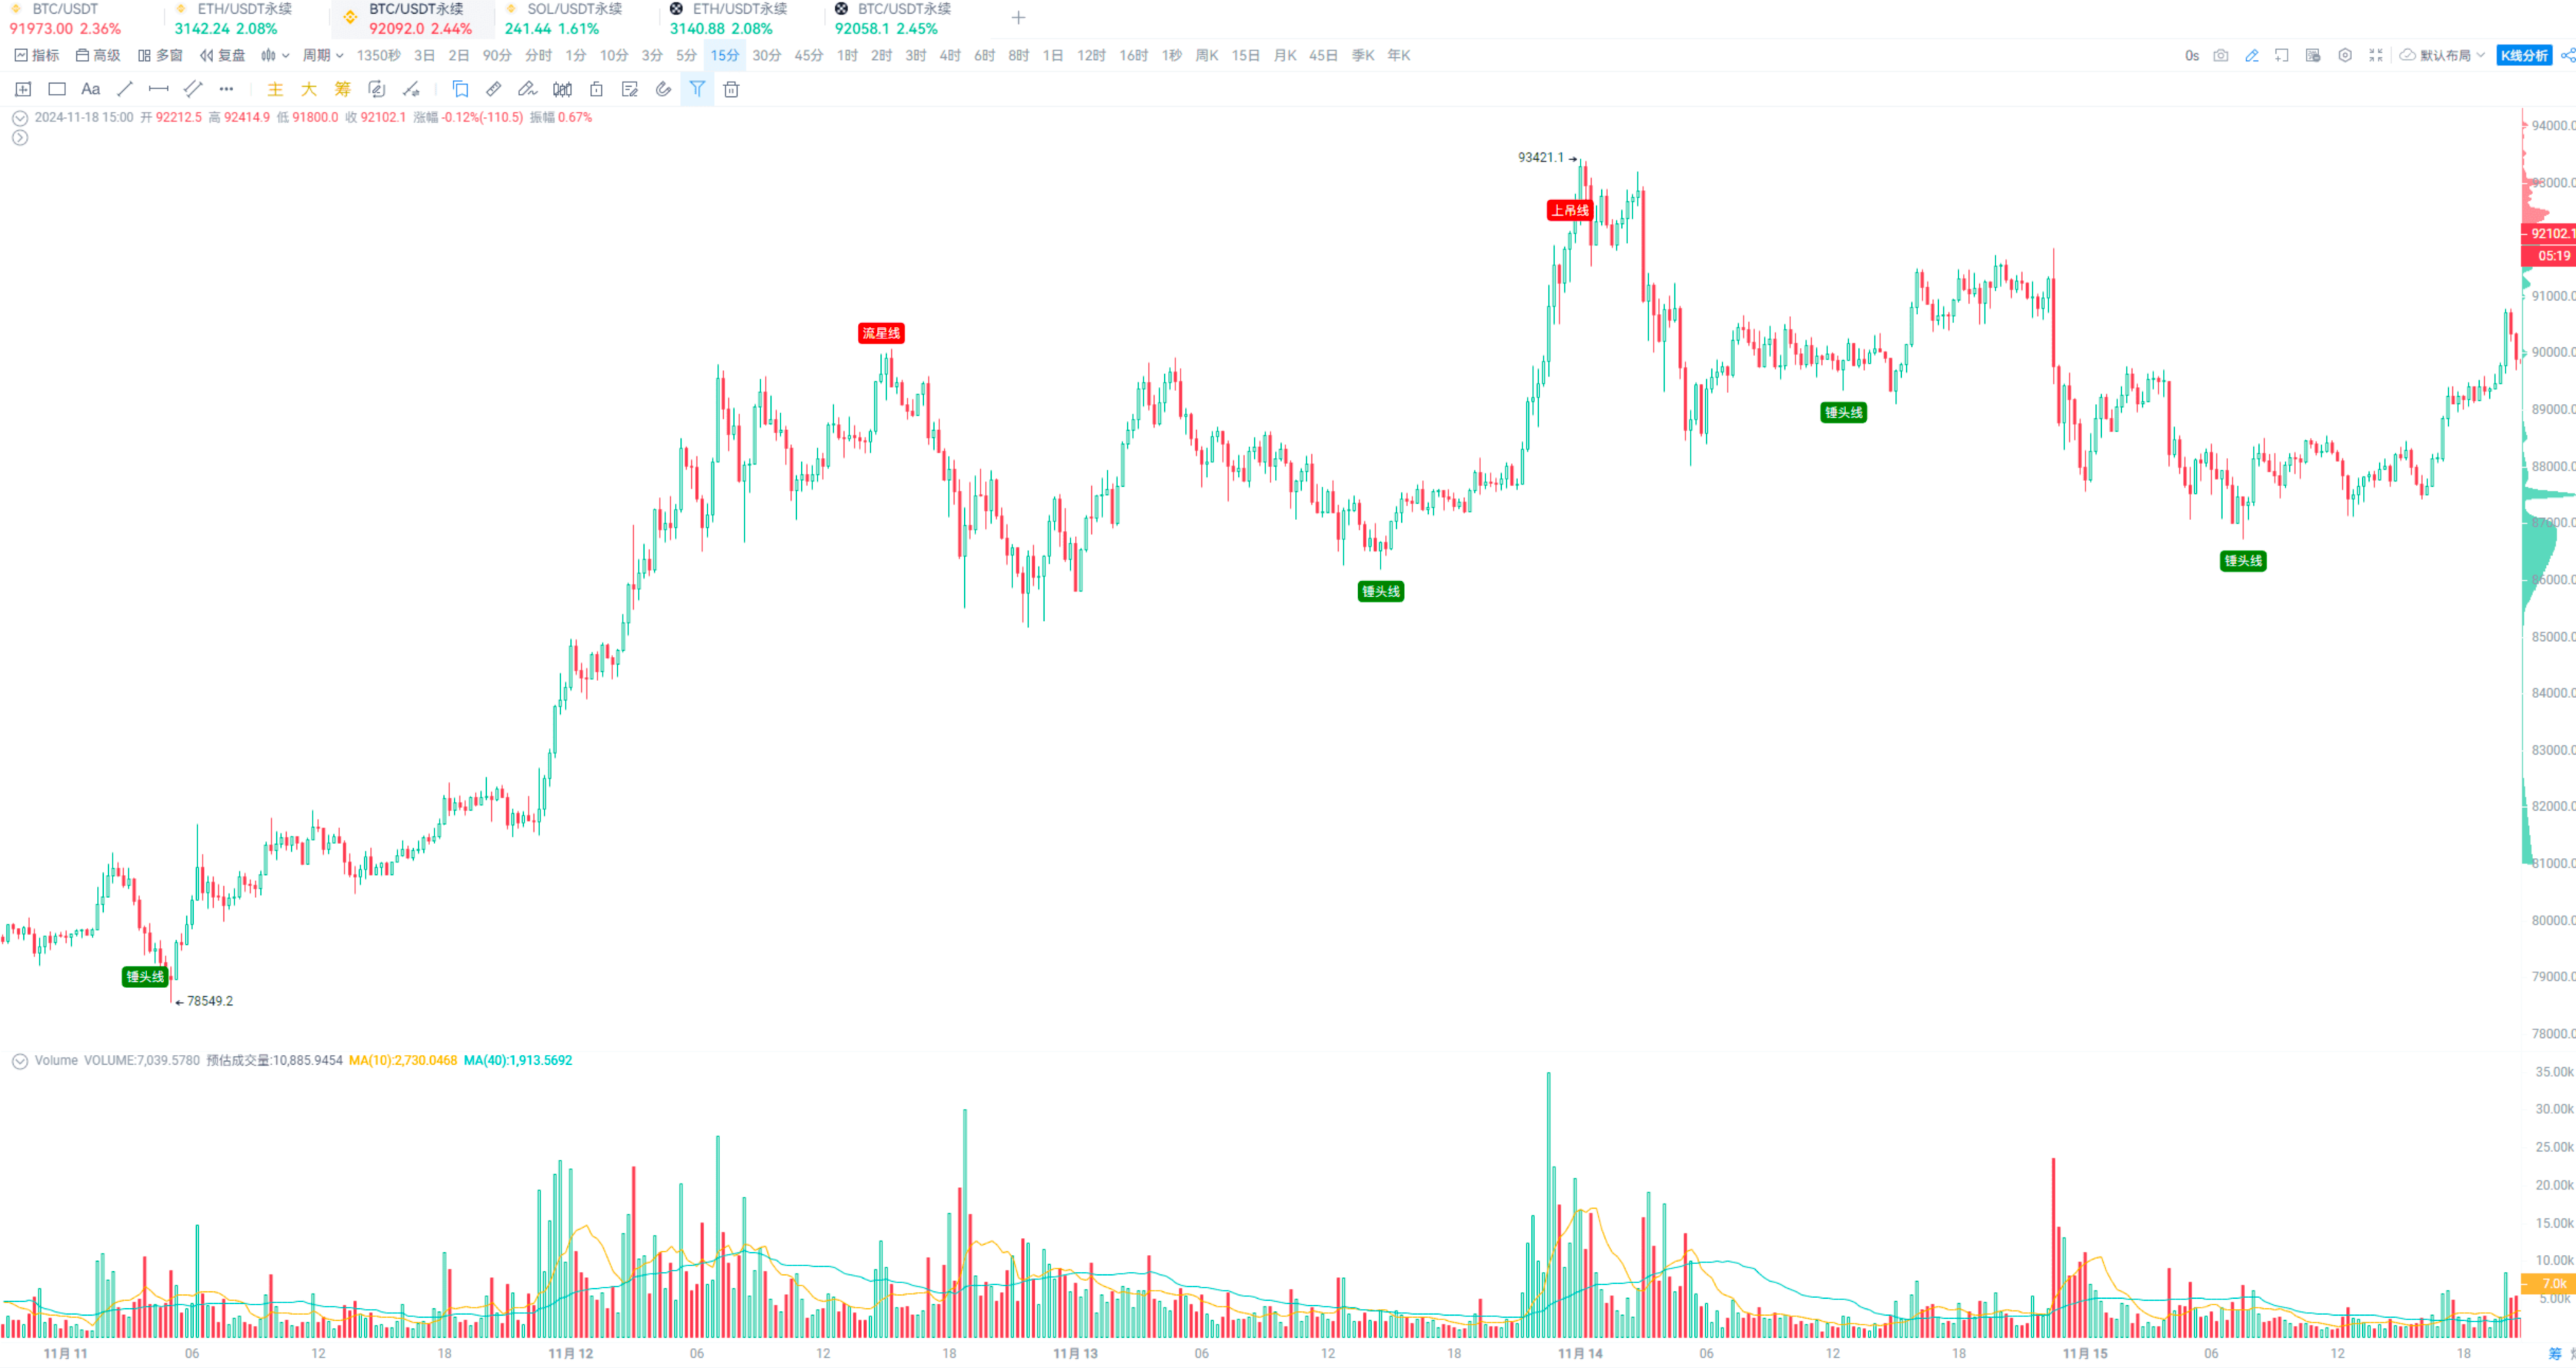
The longer the shadow, the greater the amplitude, and the larger the volume, the more significant the reversal effect.
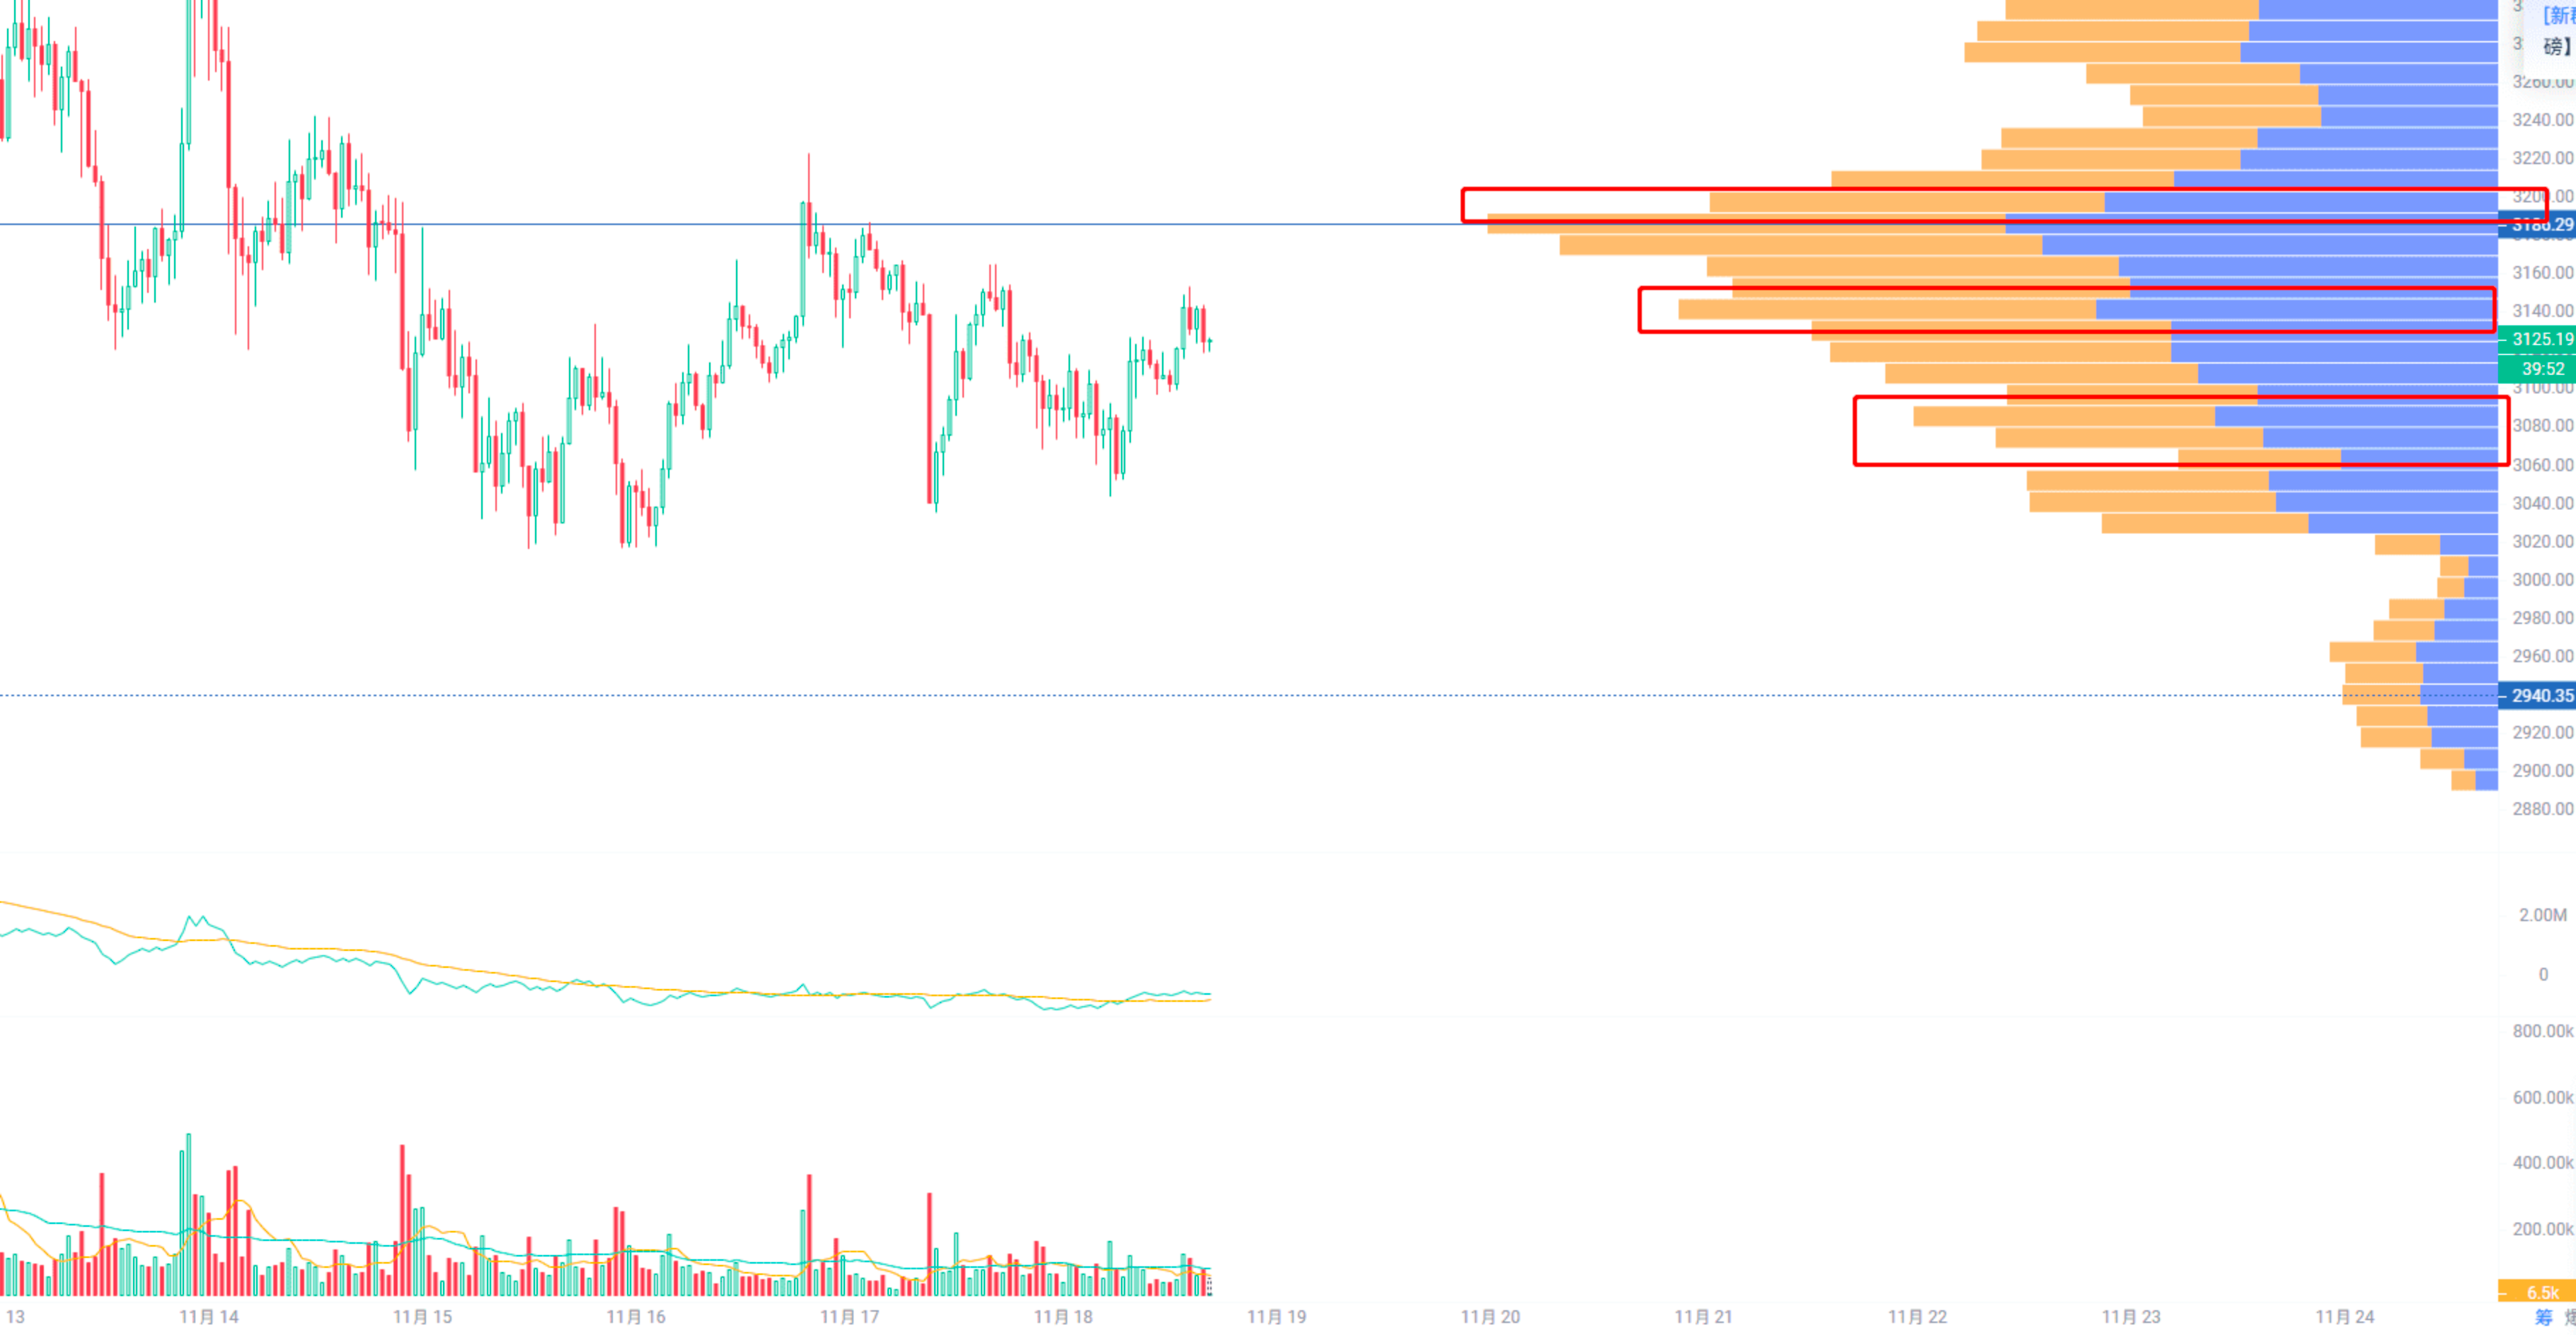
Method 2: Chip Peak
This is consistent with the use of breakout support and resistance.
Breaking through the chip peak while increasing volume is a very good entry signal.
As shown by the vertical lines in the image:
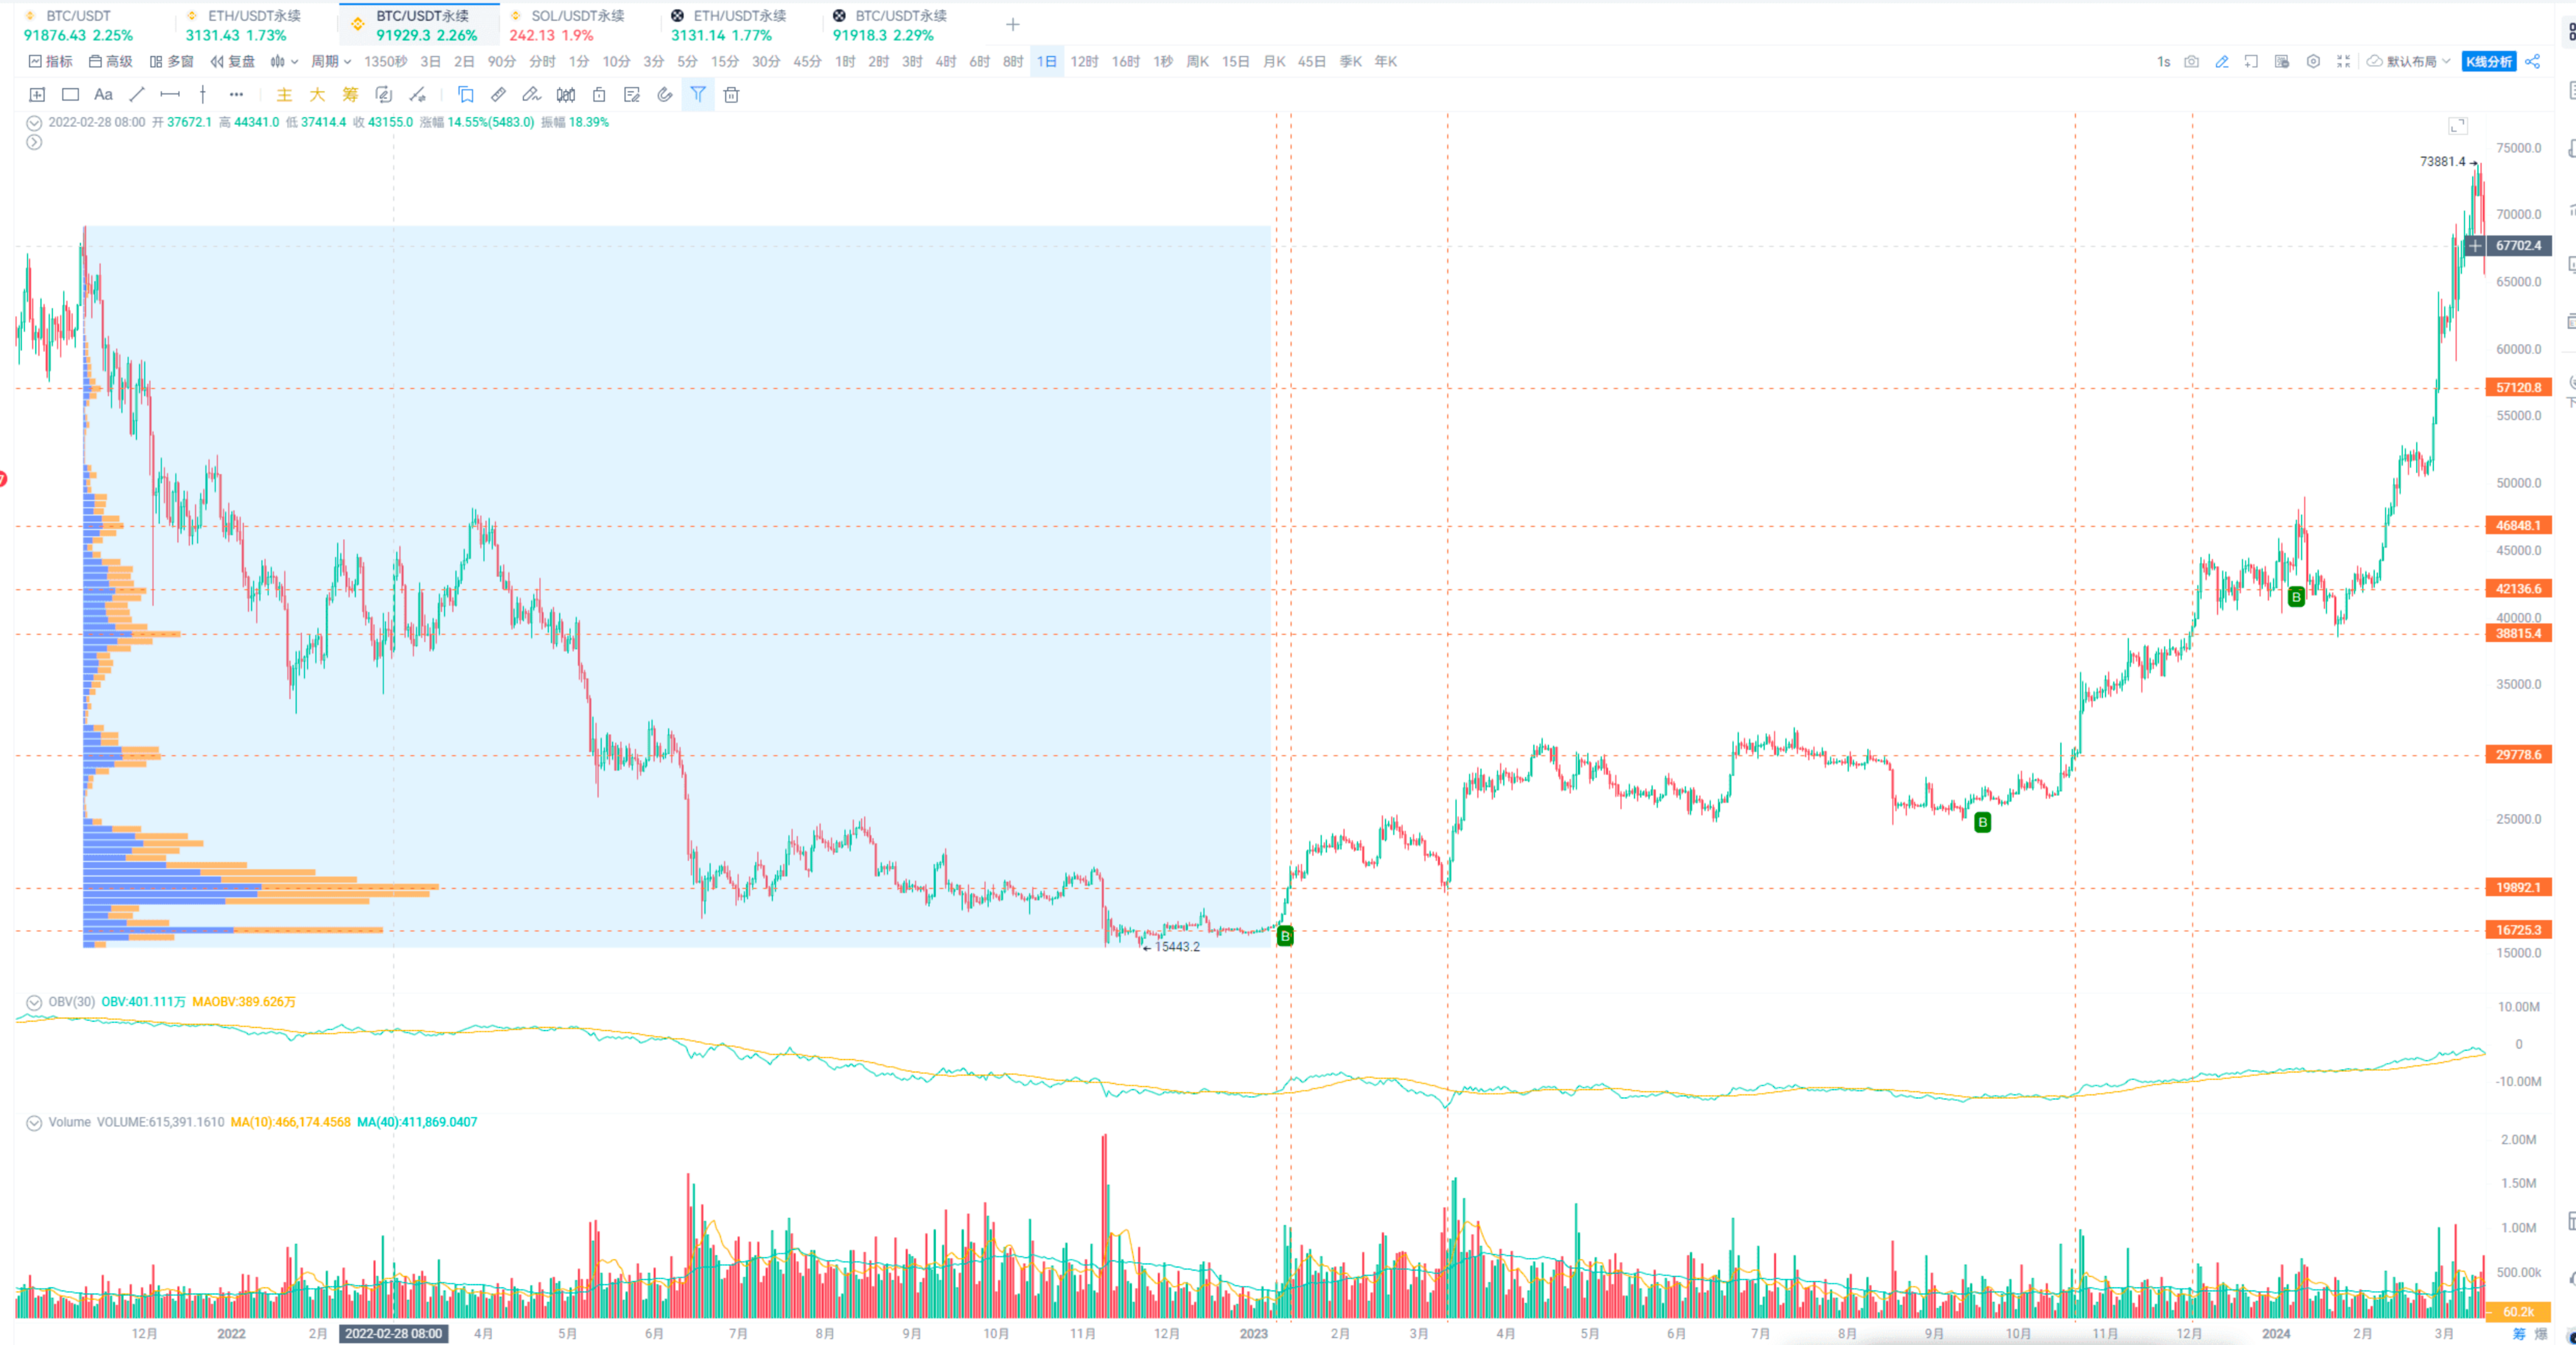
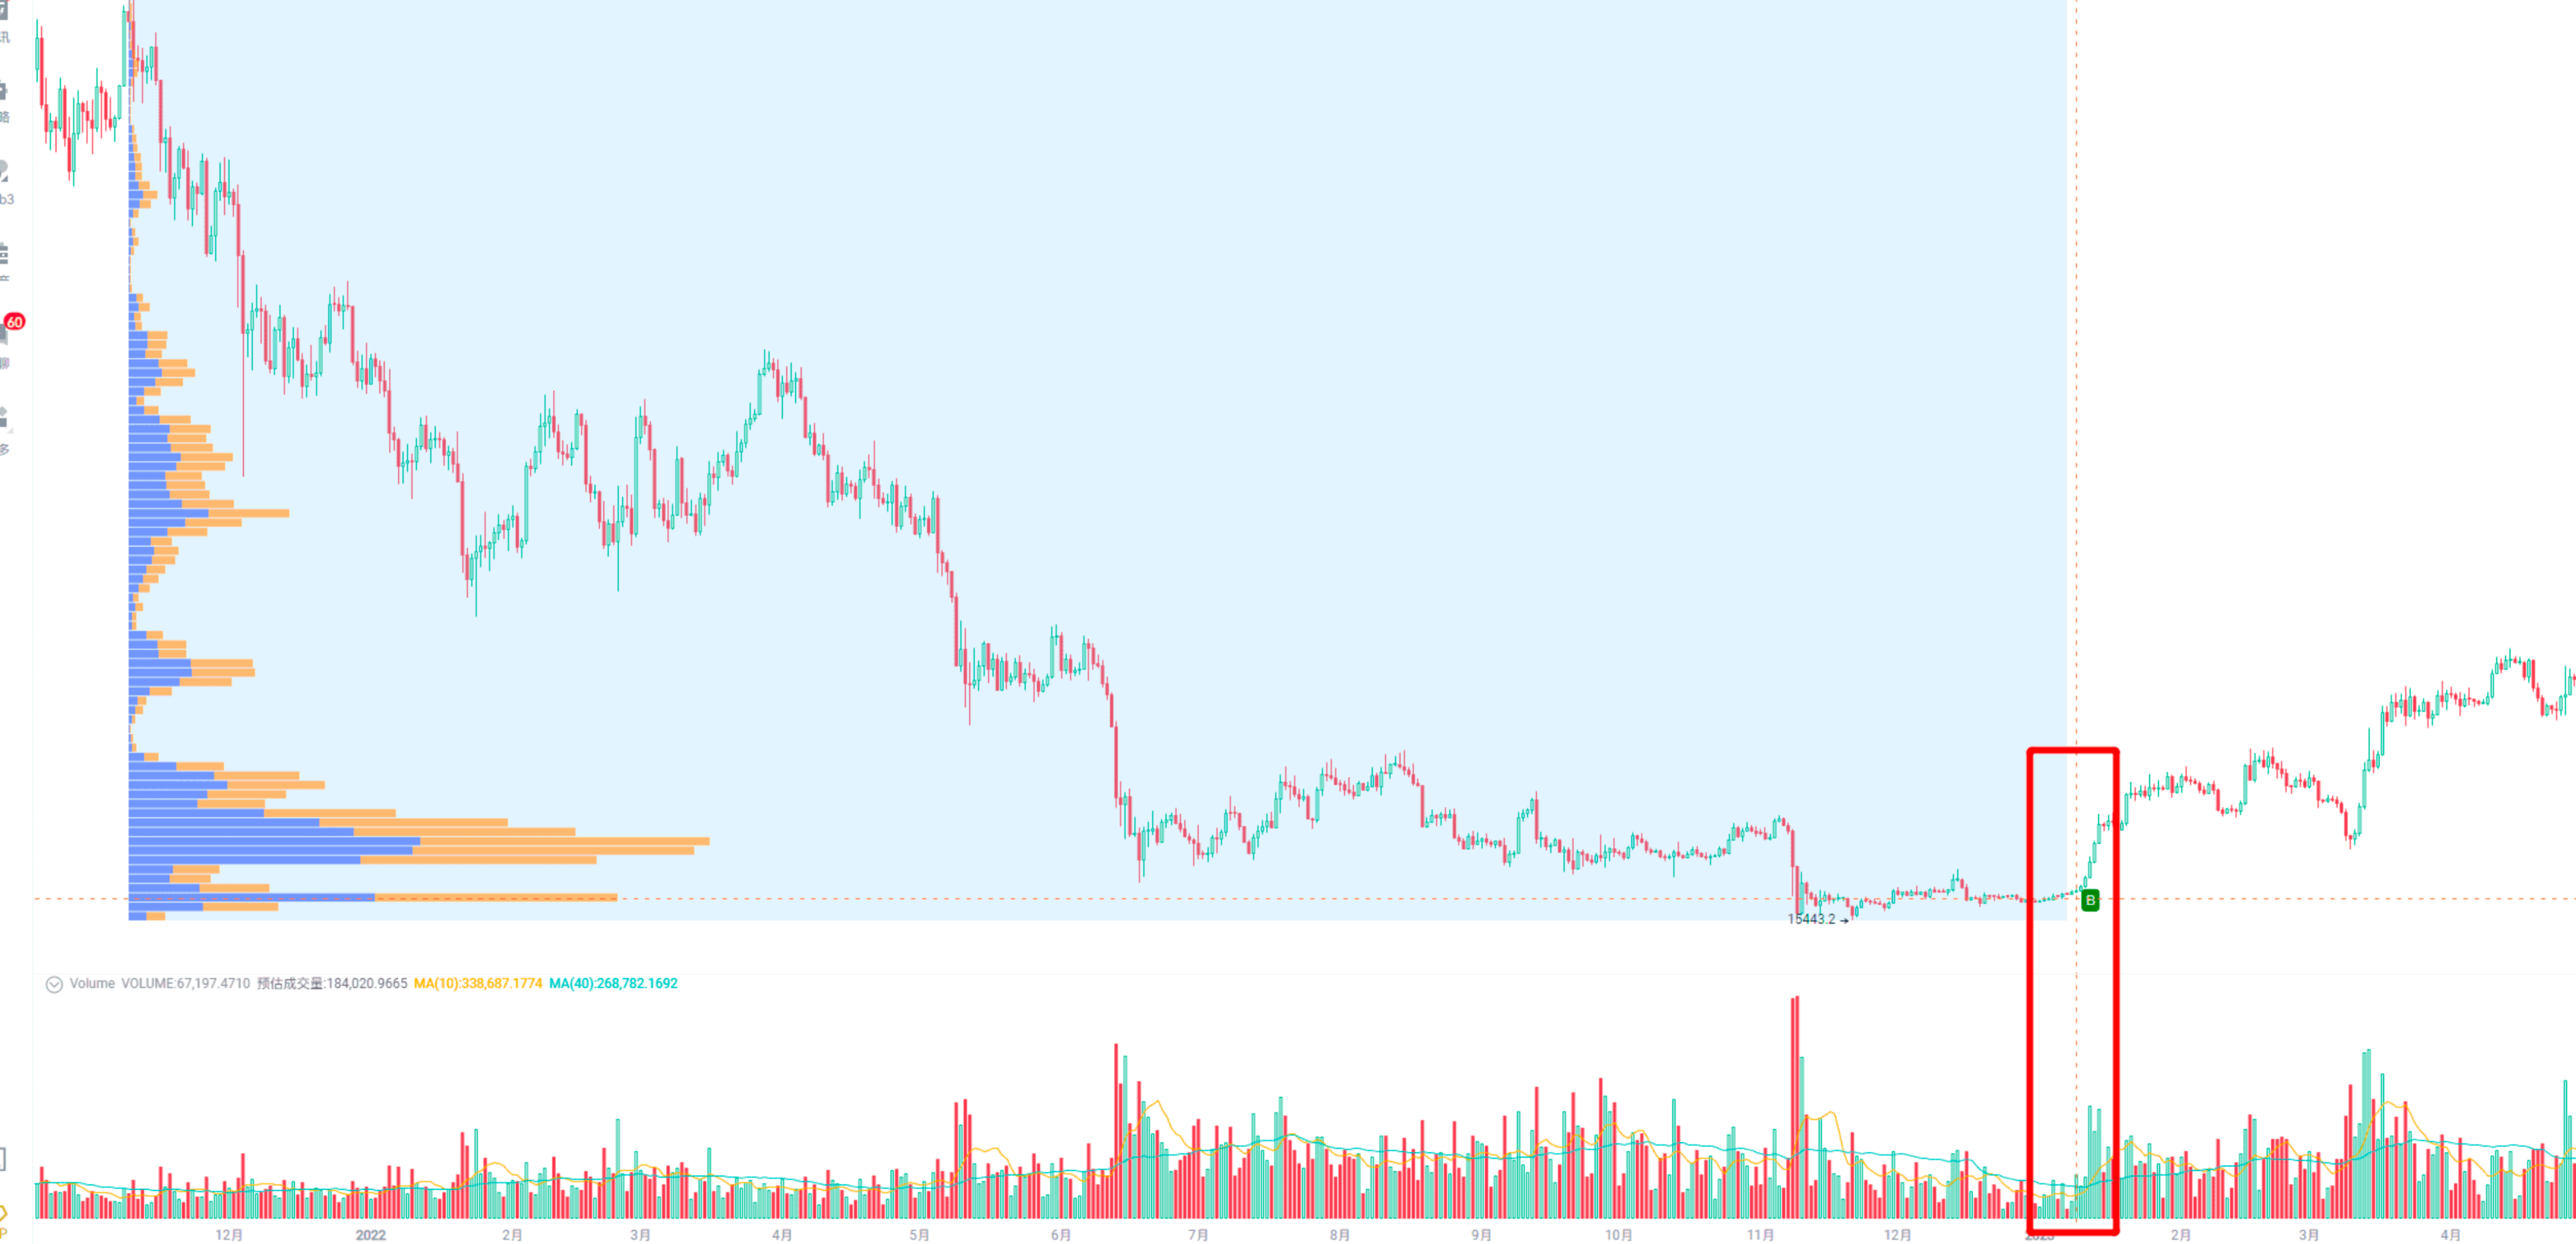
If the volume increases after breaking through the chip peak, it is a strong bullish signal.
For example, here, price up and volume up, while breaking through chip resistance.
Method 3: Combine with OBV Indicator
Super simple, just look at the OBV trend and the average volume line.
Bottom-fishing method: OBV rises, and the 10-day average volume line crosses above the 40-day average volume line.
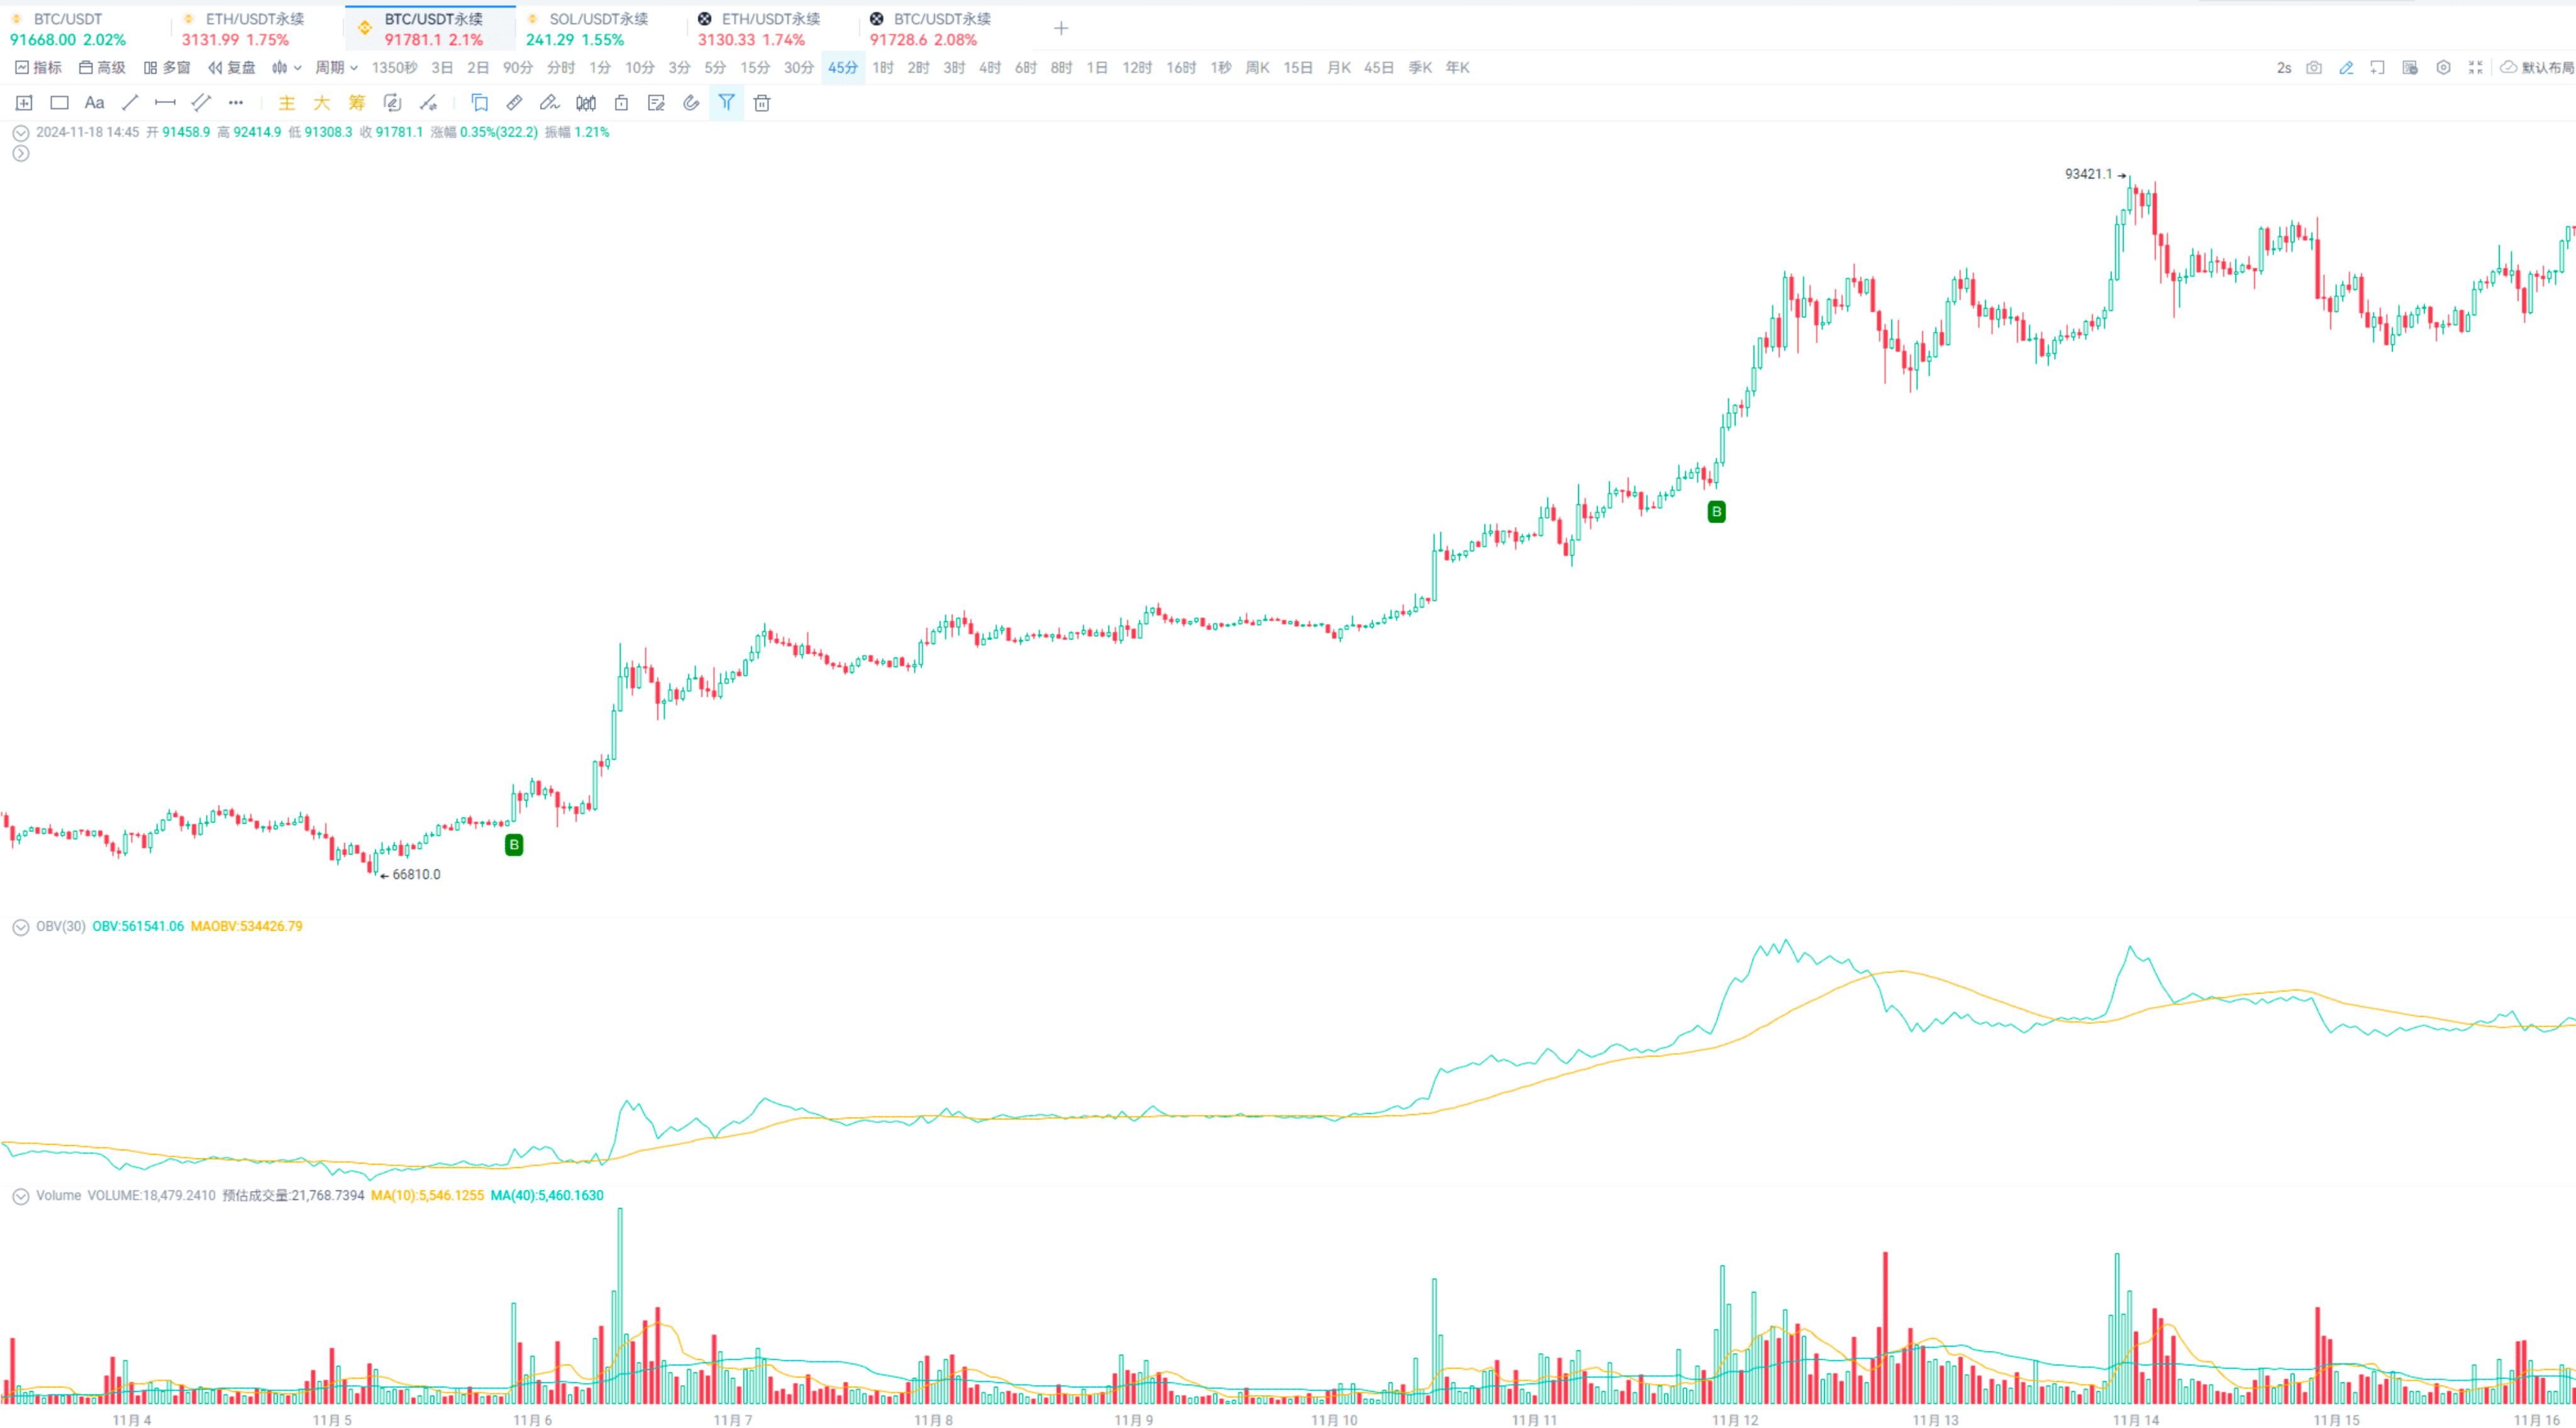
For those trading in the medium to short term, the average volume line parameters can also use 5-day and 20-day averages, depending on personal trading habits.
This method can also be implemented using custom indicators, and the effect is also good.
It is not limited to periods or currency pairs, making it very suitable for spot trading.
For those with a deeper understanding of the OBV indicator, conditions can be refined further, such as adding divergence or price judgments.
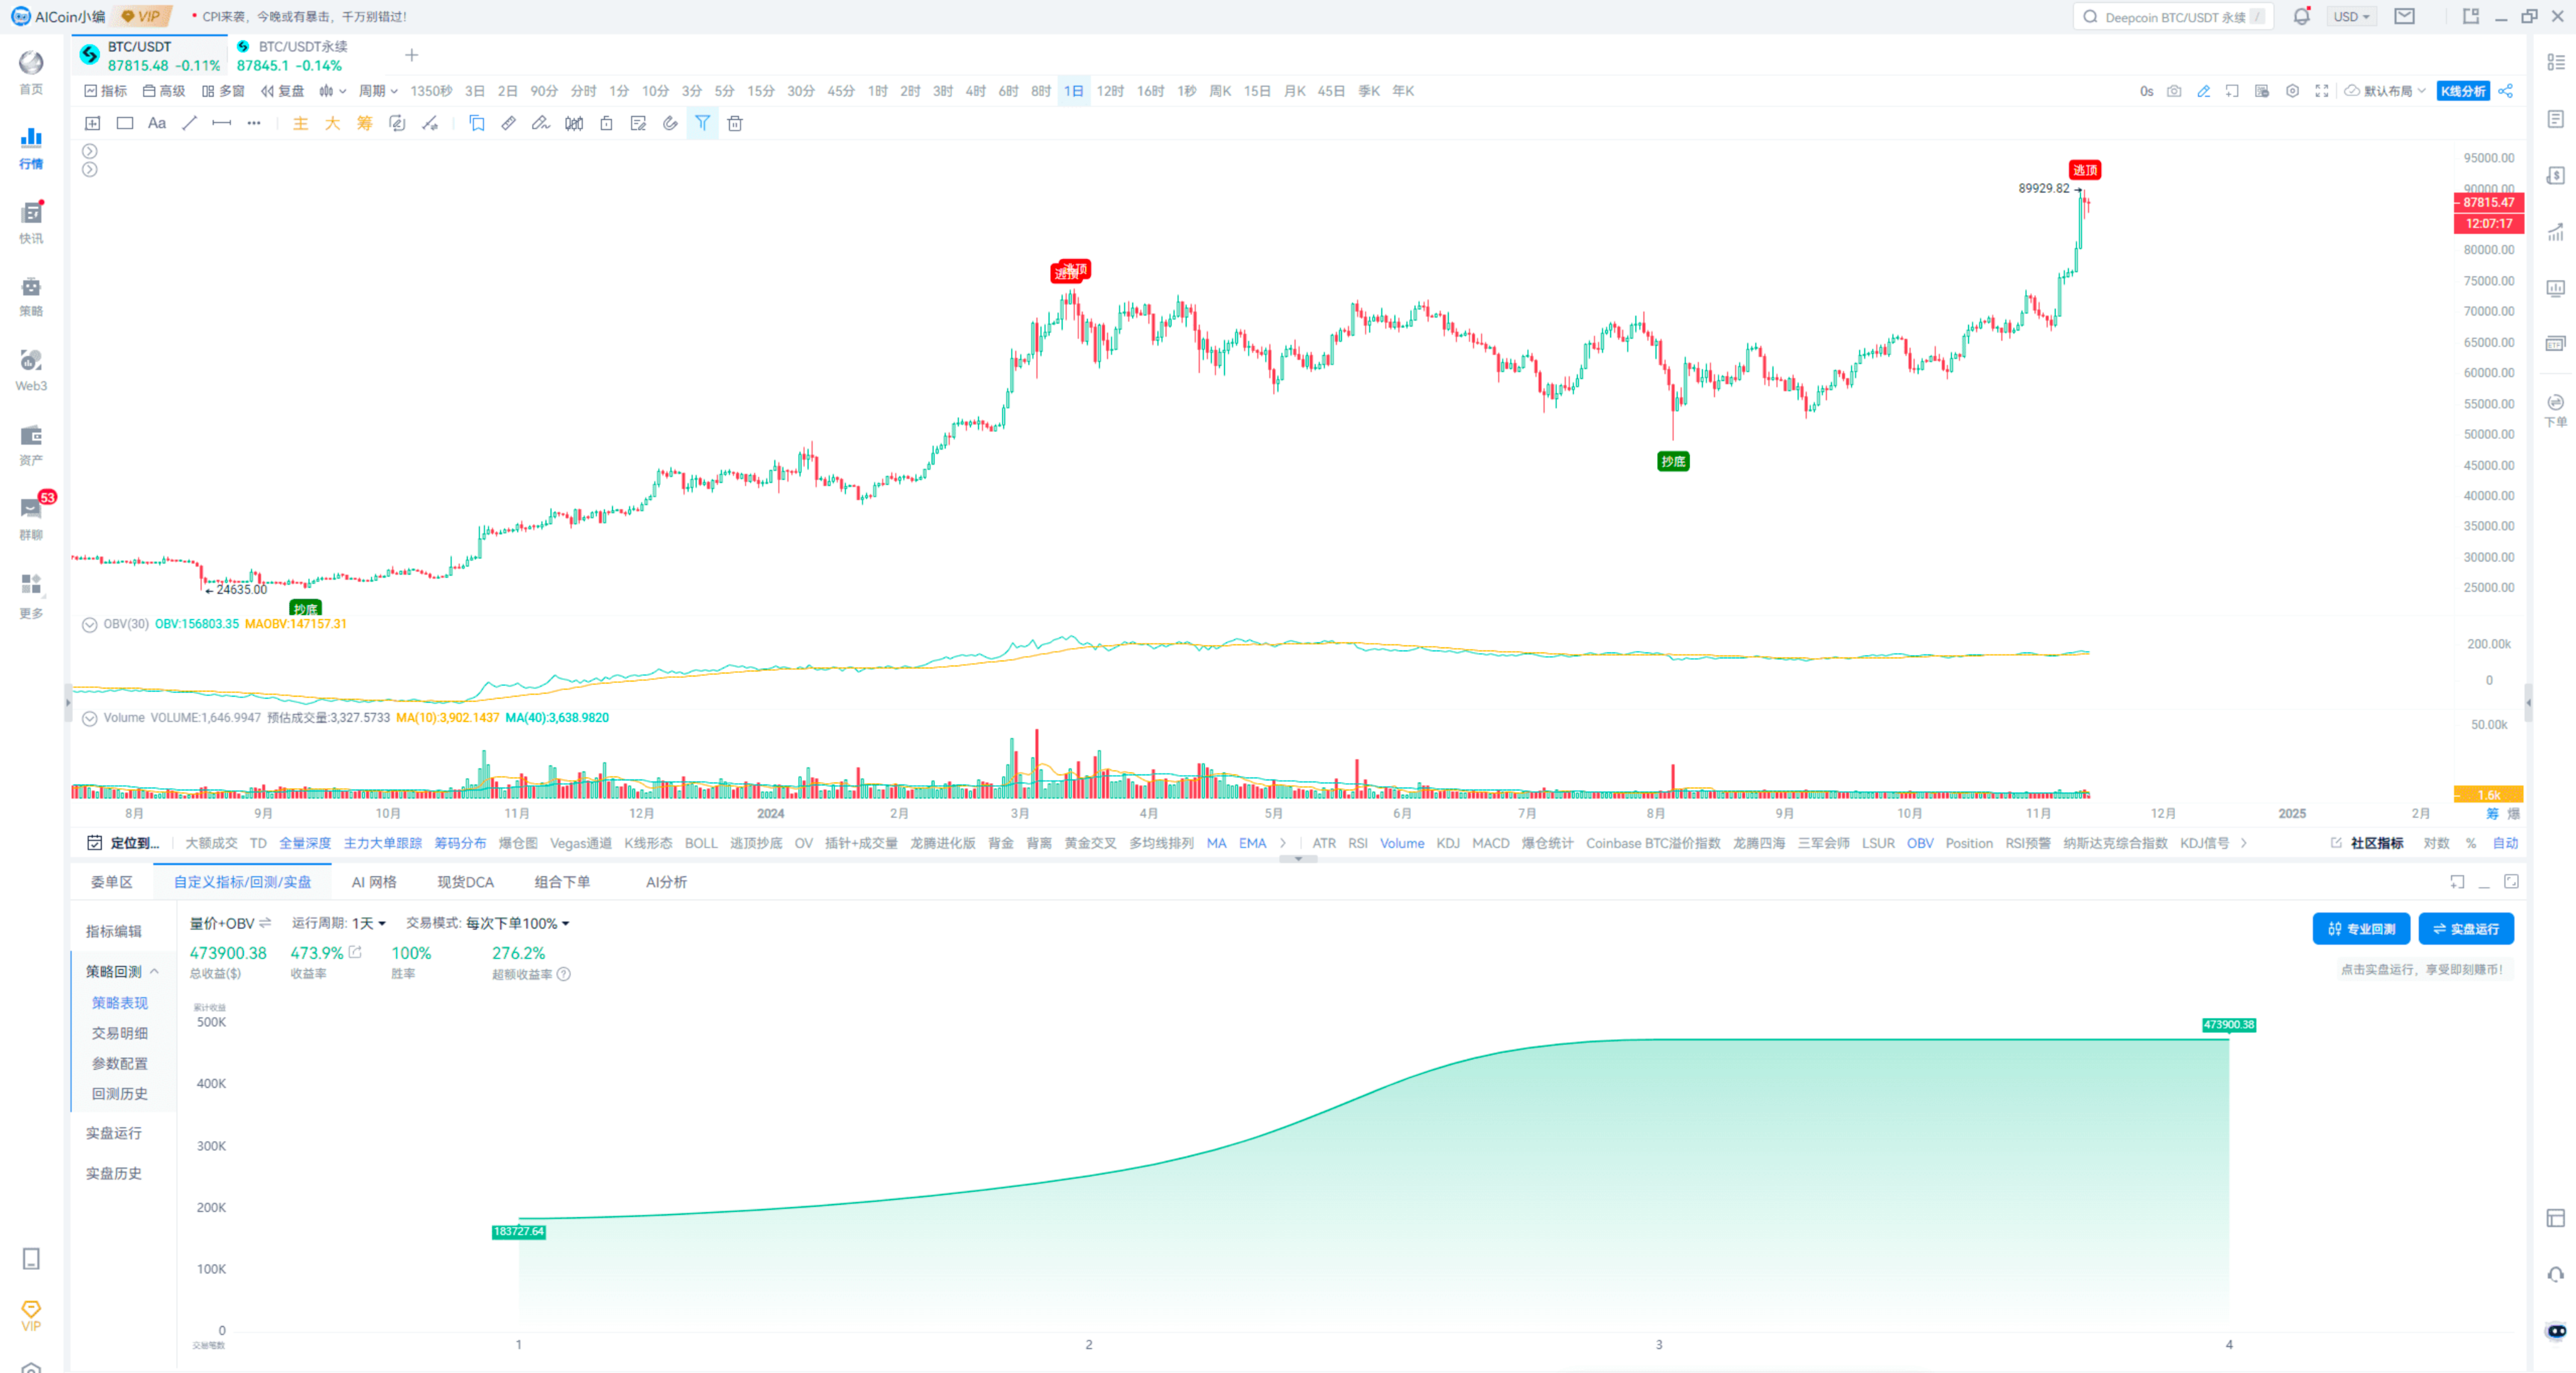
As long as you have ideas, you can implement them using custom indicators and backtest their feasibility.
Summary of methods to identify breakout signals in trading volume:
- Pin bar + increase in volume, reversal signal; using spinning top candlestick patterns for better judgment.
- Chip peak + increase in volume, strong breakout signal; if price up and volume up, it is a strong signal.
- OBV + average volume line, a very good bottom-fishing method, provided that OBV is above the MAOBV.
If interested, you can subscribe to our membership to customize indicators, or you can write code for custom indicators yourself to monitor these methods (mainly methods one and three).
I personally prefer to display indicator methods in the form of text signals, which can be monitored and directly displayed on the candlestick chart, making it very convenient.
For example, Ethereum is currently very weak; just look at the trading volume over the past week. If it breaks below the chip peak while the volume increases, you can pay attention to further pullback opportunities.
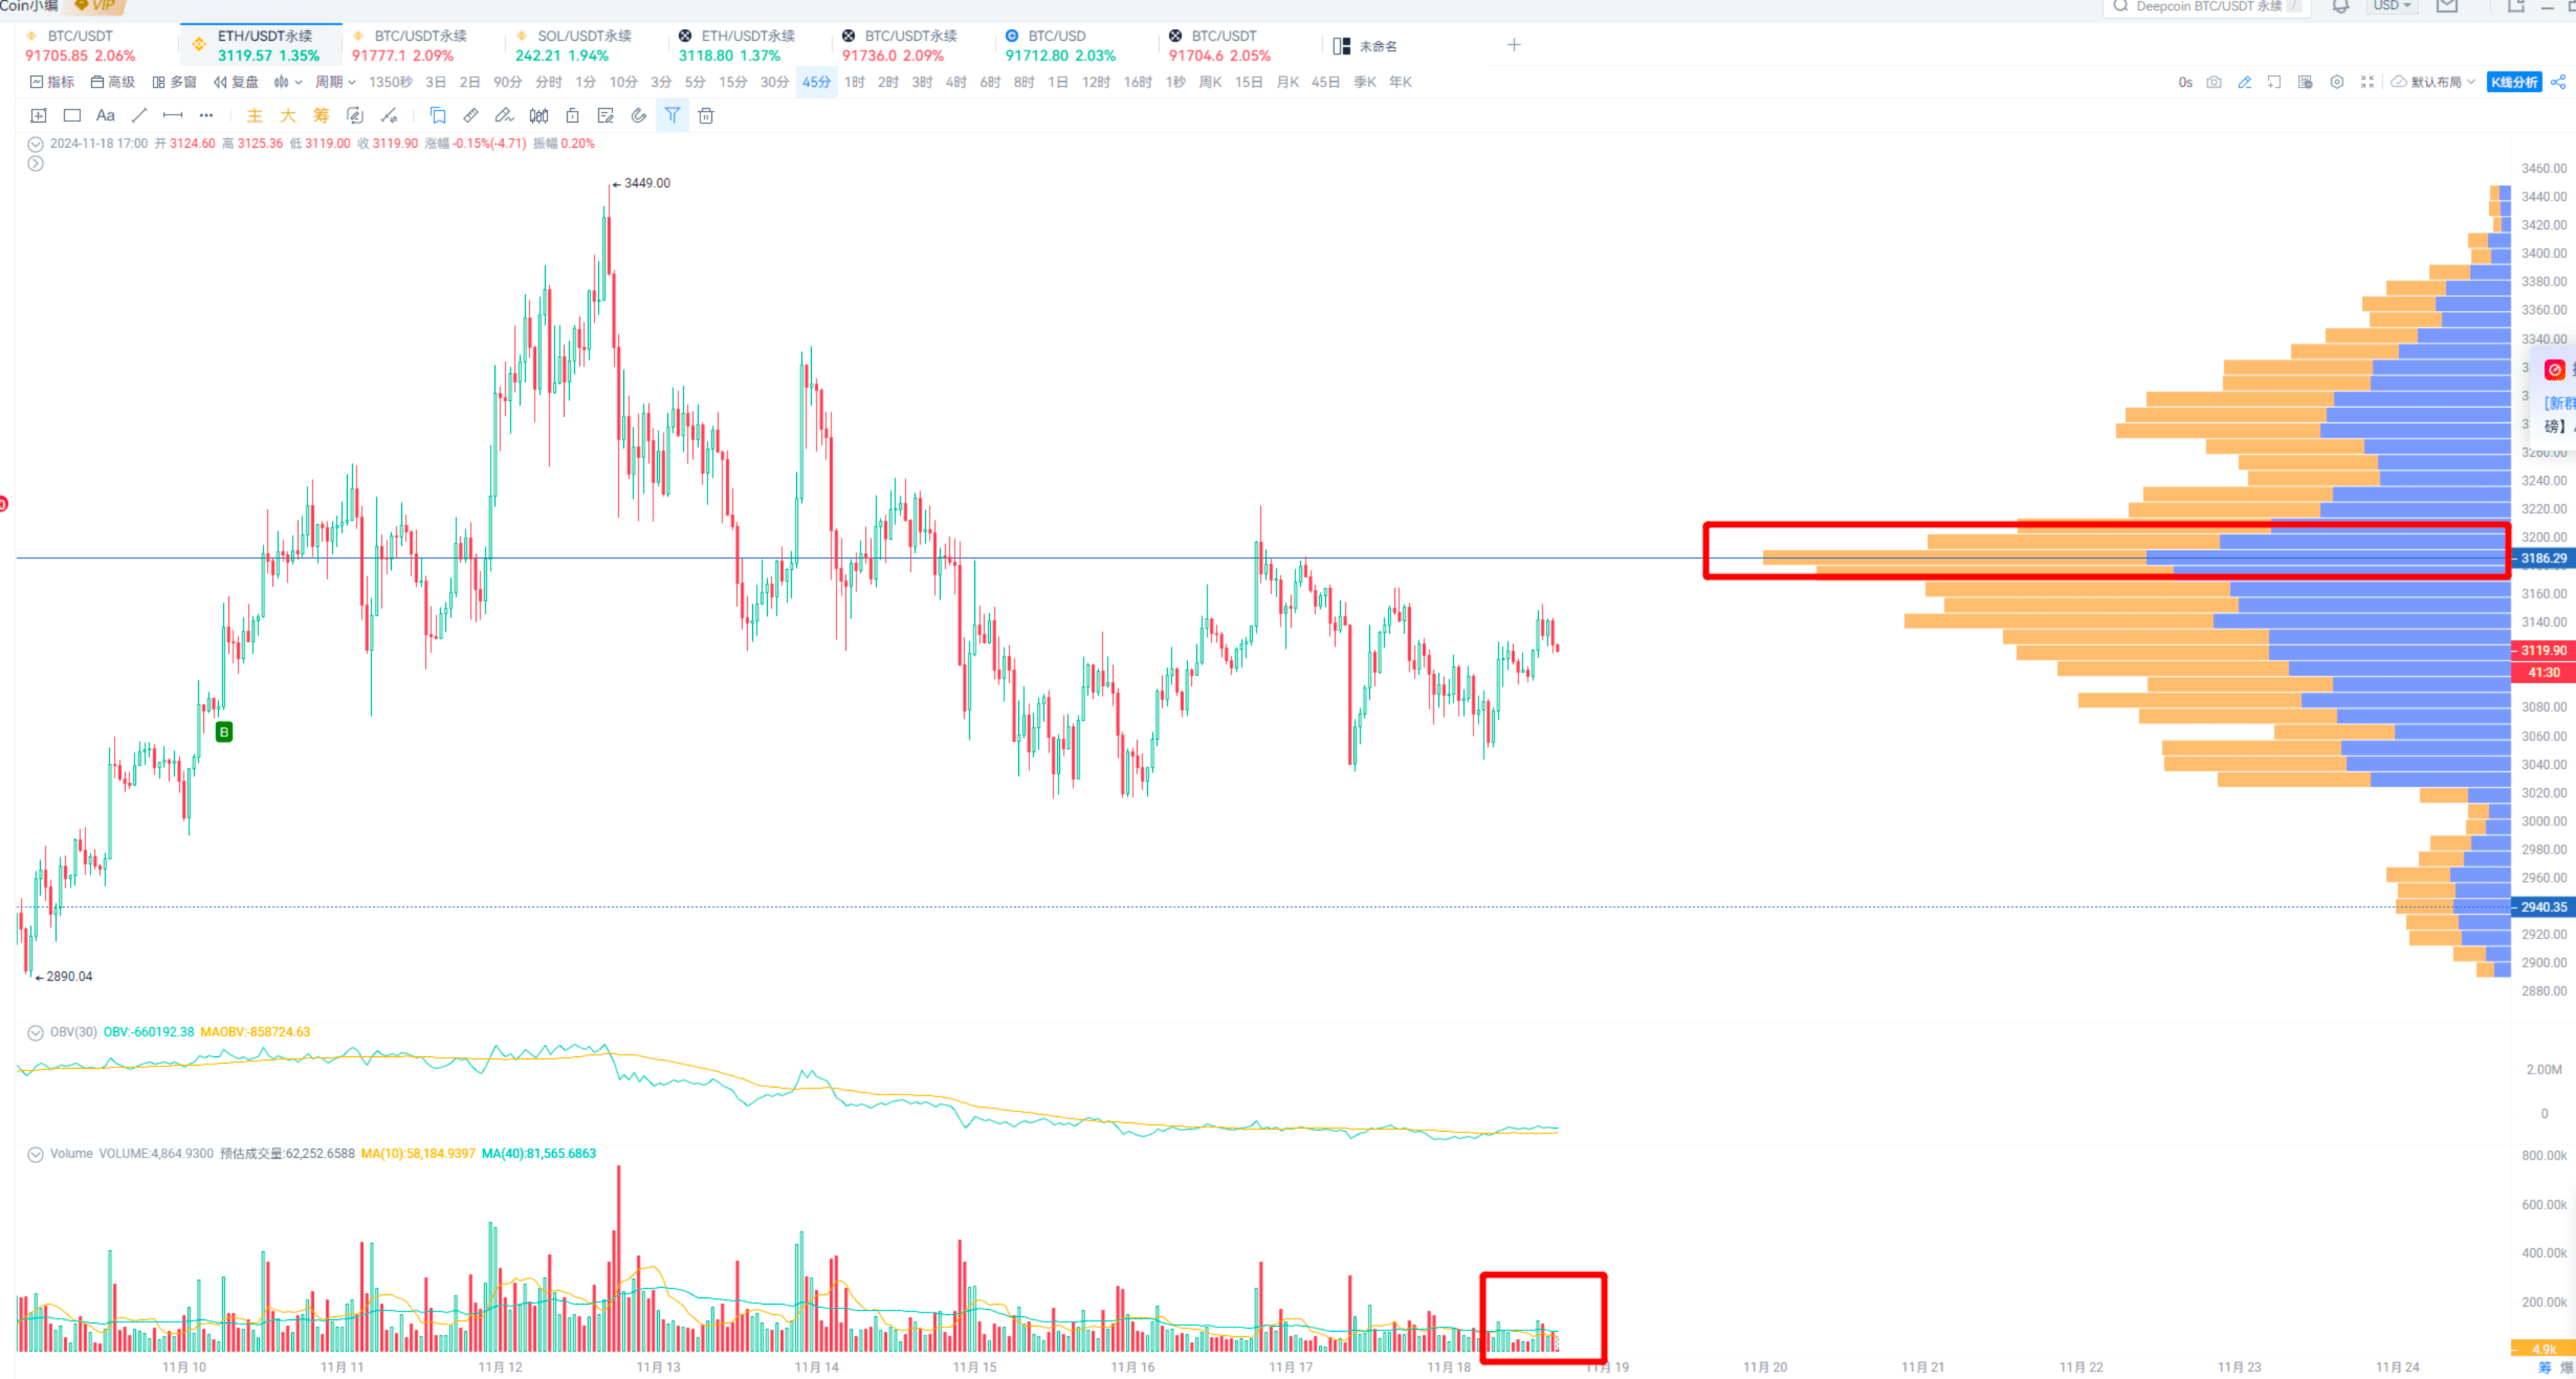
These can all be considered peaks, i.e., support and resistance levels.
Resources for custom indicator tutorials are as follows:
Custom Indicator Tutorial: https://www.aicoin.com/article/355031.html
Custom Indicator Alert Tutorial: https://www.aicoin.com/article/355033
Custom Indicator Function Documentation: https://www.aicoin.com/article/355796.html
Quick Start for Automated Live Trading: https://www.aicoin.com/article/373213.html
If needed, you can subscribe to our membership to customize indicators, supporting alerts, live trading (backtestable), and signal display on candlestick charts, with code being permanently valid.
This concludes the content of this sharing.
Thank you for watching. We hope every AICoin user can find suitable indicator strategies and enjoy abundant wealth!
Recommended Reading
- Crazy Bull! Teach You How to Find Golden Entry Opportunities from Pullbacks
- The Best Path to Quick Freedom in a Bull Market: Funding Fee Arbitrage
- The King of Indicators: Advanced MACD Strategies
For more valuable live content, please follow AICoin's “AICoin - Leading Data Market, Intelligent Tool Platform” section, and feel free to download AICoin - Leading Data Market, Intelligent Tool Platform.
免责声明:本文章仅代表作者个人观点,不代表本平台的立场和观点。本文章仅供信息分享,不构成对任何人的任何投资建议。用户与作者之间的任何争议,与本平台无关。如网页中刊载的文章或图片涉及侵权,请提供相关的权利证明和身份证明发送邮件到support@aicoin.com,本平台相关工作人员将会进行核查。


