Author: S4mmy’s Web3 Snippets
Compiled by: Deep Tide TechFlow

I will use my ten years of experience in traditional finance and corporate sectors to help you break down complex issues into easily understandable pieces.
After the presidential election results were announced, Bitcoin's price surged sharply, with expectations that Trump will take office in January.
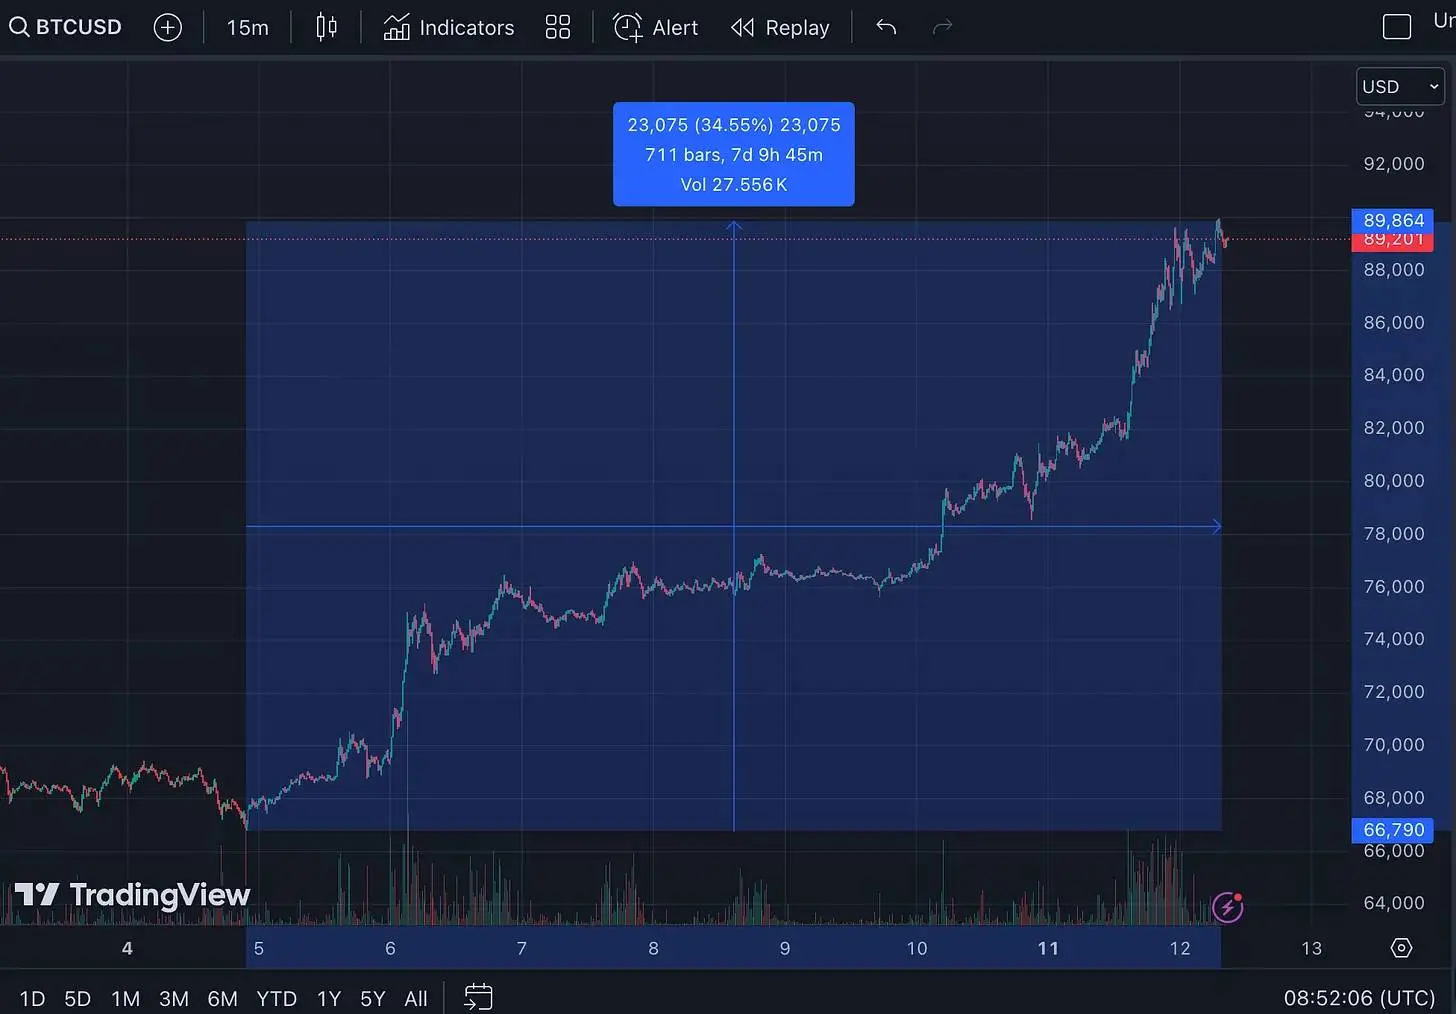
Last week, Bitcoin's price rose by 35%, reaching $90,000 before slightly retreating. Data sourced from Trading View.
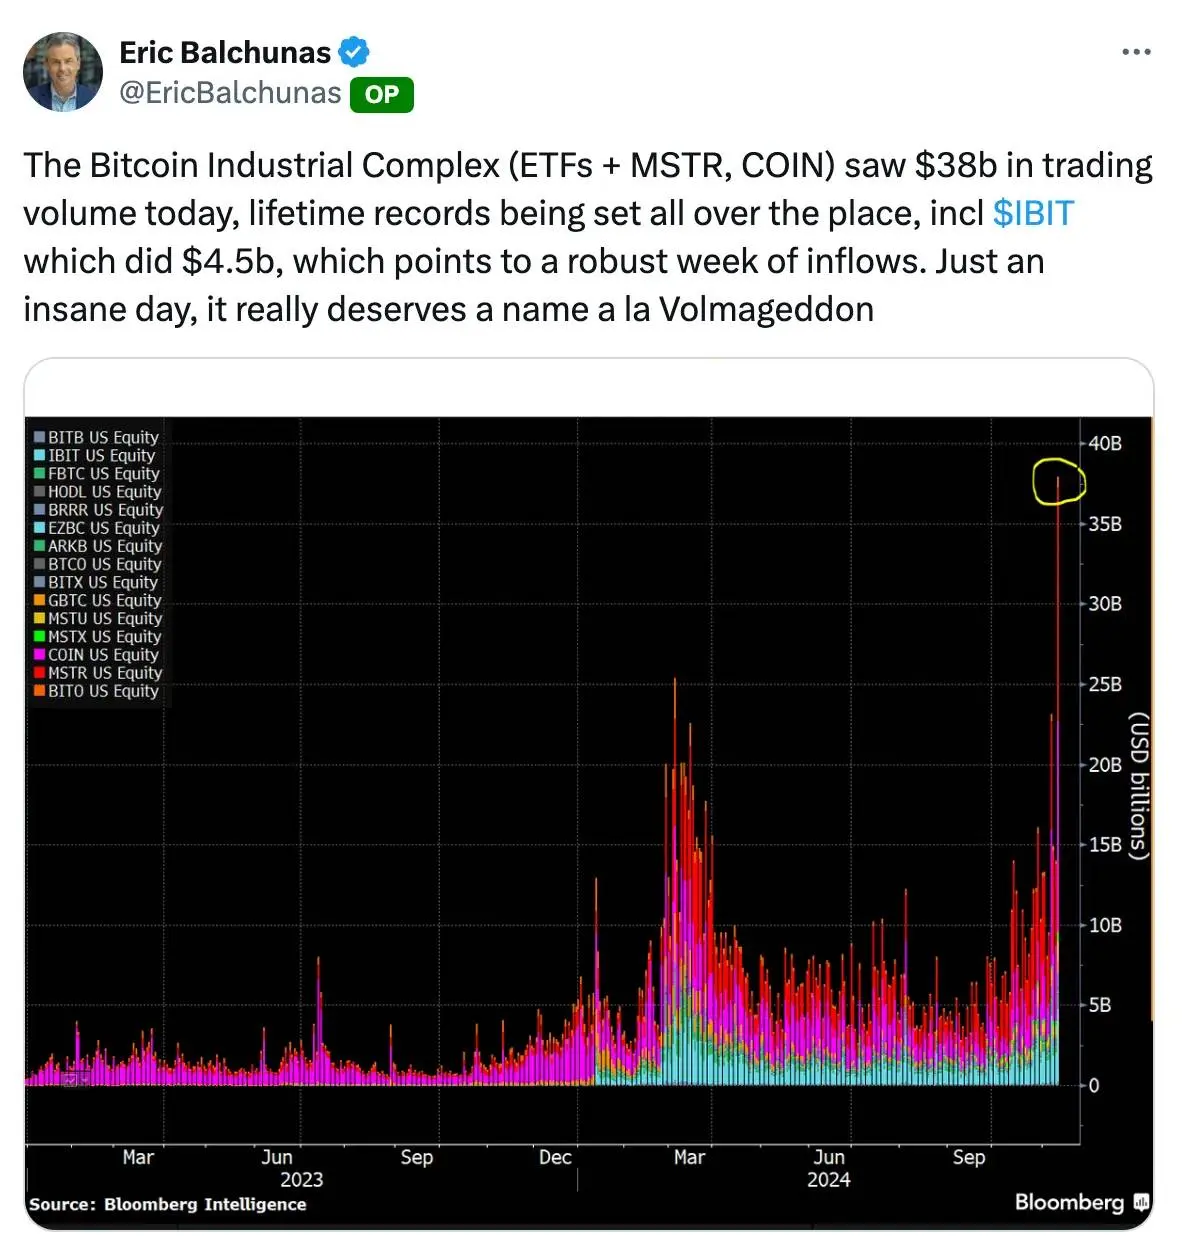
The trading volume of Bitcoin-related products reached $38 billion.
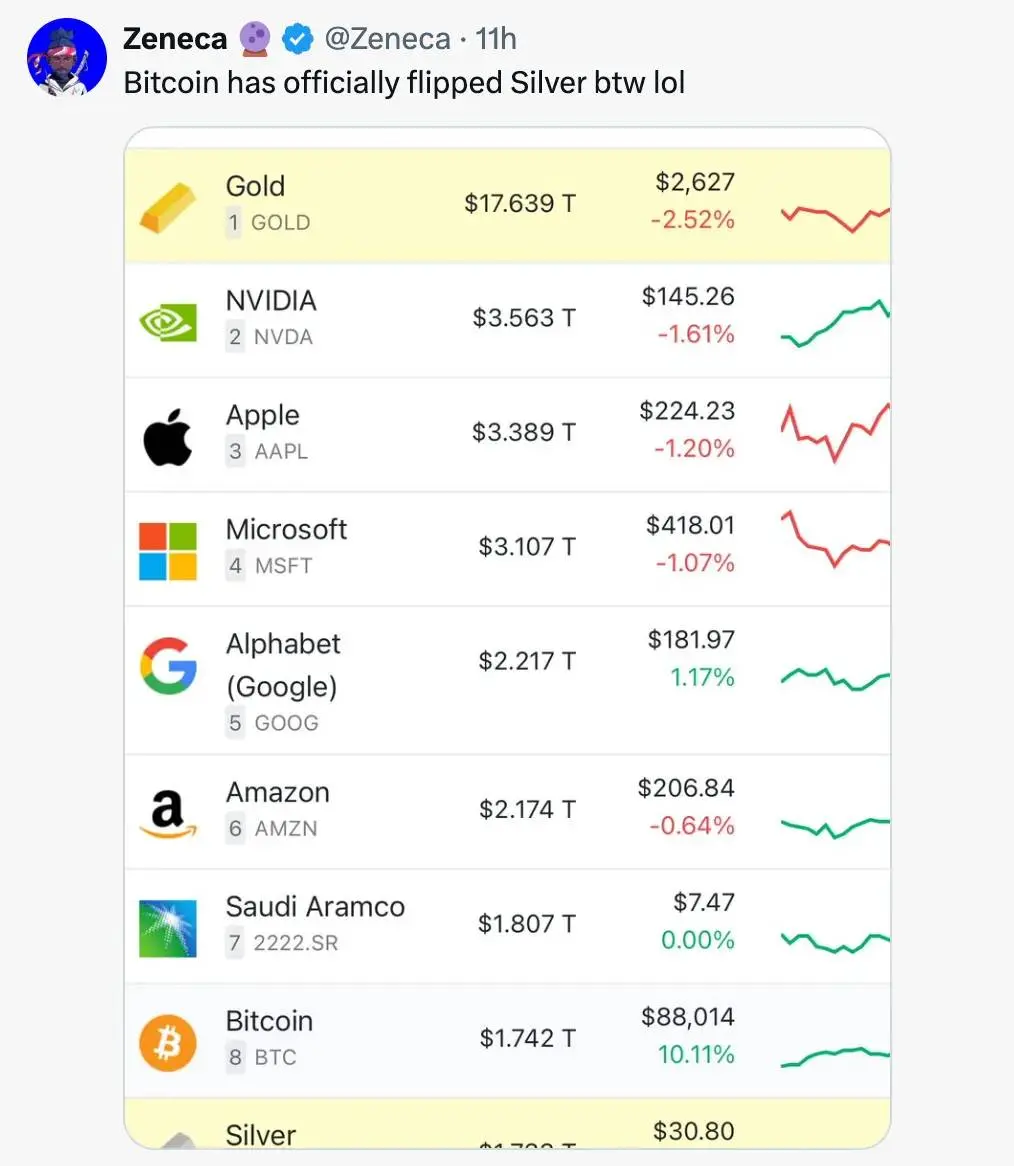
BlackRock's BTC ETF has now surpassed gold ETFs and the market cap of silver.
On the corporate side:
MicroStrategy currently holds over $20 billion in Bitcoin, and has repurchased $2 billion worth of Bitcoin at market prices.
On the government side, there is a proposal suggesting that the U.S. government should purchase 200,000 Bitcoins annually over the next five years, which would give them 6% of the total supply by 2030.
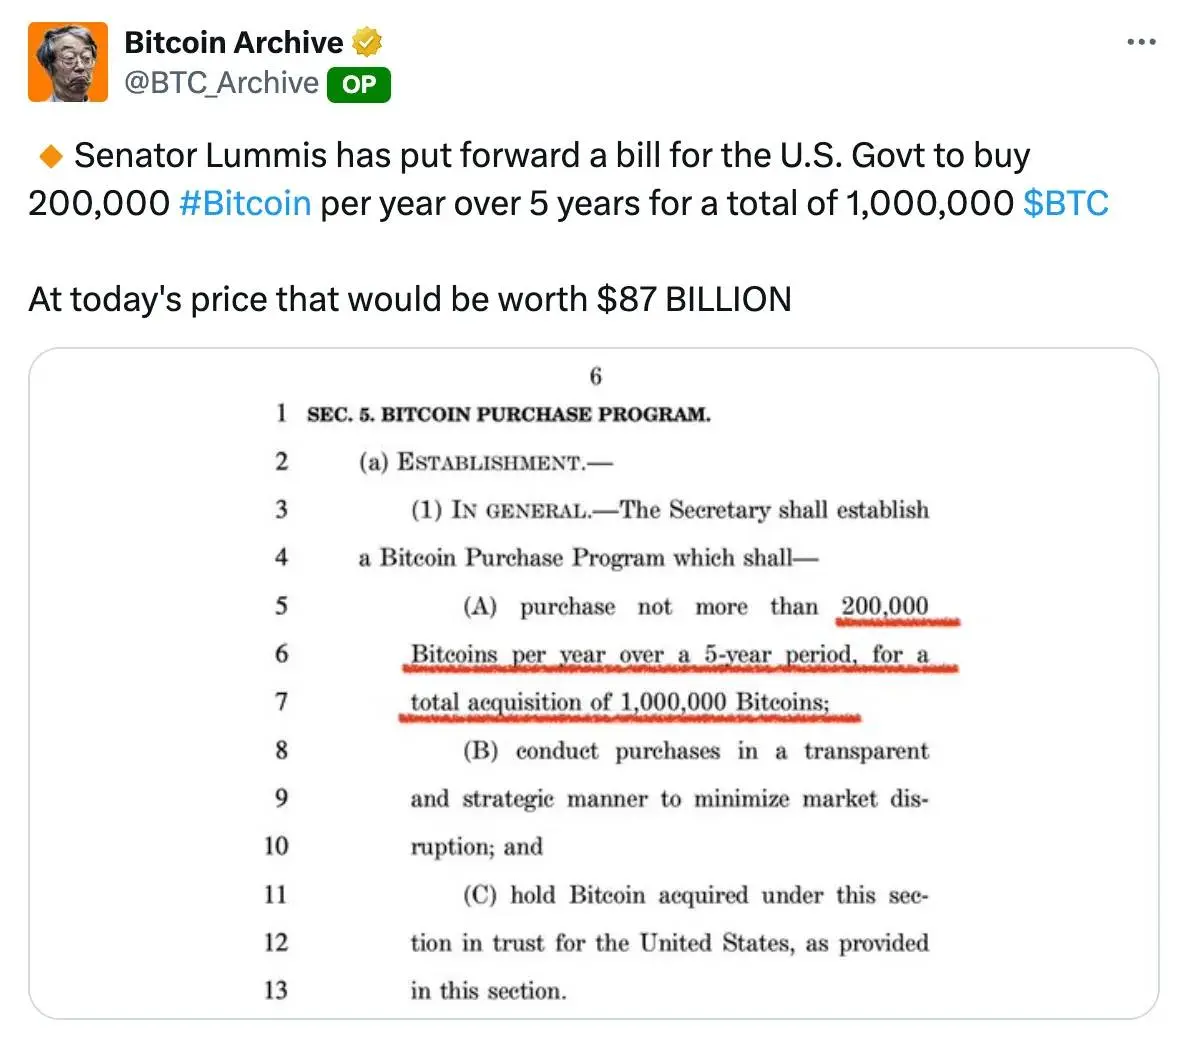
Currently, the U.S. is a country holding 213,000 Bitcoins, with government-held Bitcoins accounting for 2.2% of the total supply, but this percentage may increase.
Market Indicators to Watch:
Be aware of objective indicators of market turning points:
- #### Global Liquidity (referenced by M2 supply)
Tracking certain relevant assets or indicators—M2 supply (3-month lag) is highly correlated with Bitcoin prices.
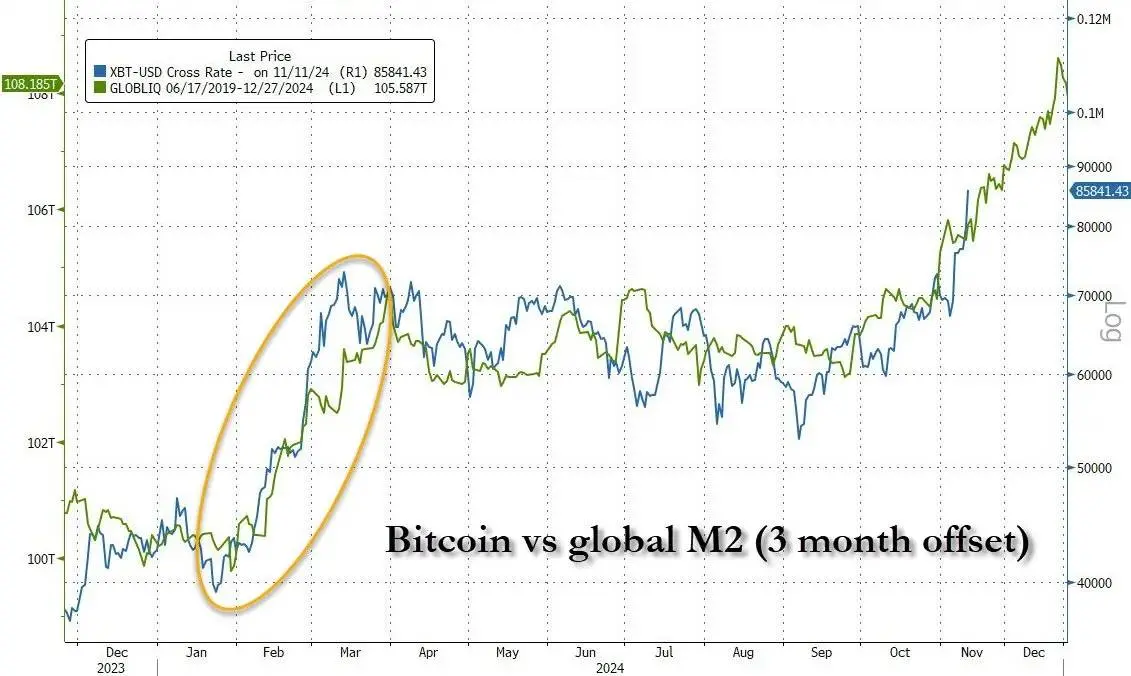
Data sourced from Zero Hedge.
What does this mean? This is essentially a reference indicator for global liquidity. The theories of Lyn Alden and Raoul Pal suggest that when liquidity in the market becomes abundant and is invested in assets, these economic decisions have a 3-month lag. This correlation indicates that if Bitcoin continues to track M2 without significant deviation, we may see Bitcoin prices reach $100,000 by the end of the year.
- #### Fear and Greed Index (69, Nice)
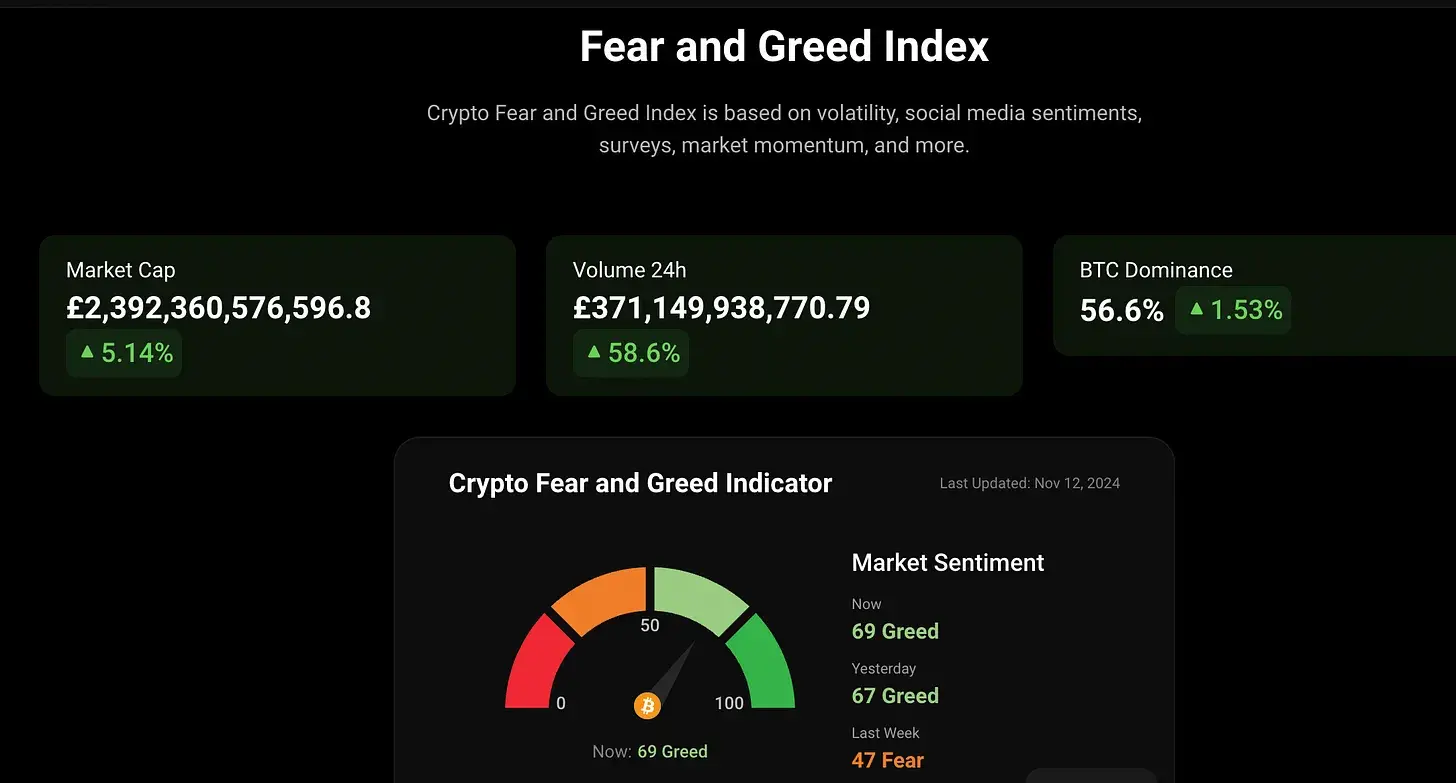
Source: Coin Glass
When using various indices, be mindful of the differences in their methodologies, as some indices are more sensitive than others. Coin Stats provides a relatively reasonable solution that aligns with the actual market situation.
- #### Downloads of the Coinbase wallet increased by 12% in the past 24 hours
Historically, when Coinbase becomes a top app in the Apple Store or Google Play, it is often a significant market indicator, so it is worth monitoring.
Currently, Coinbase ranks 81st in the Apple Store.
- #### Bitcoin's Google search trend index is "79"
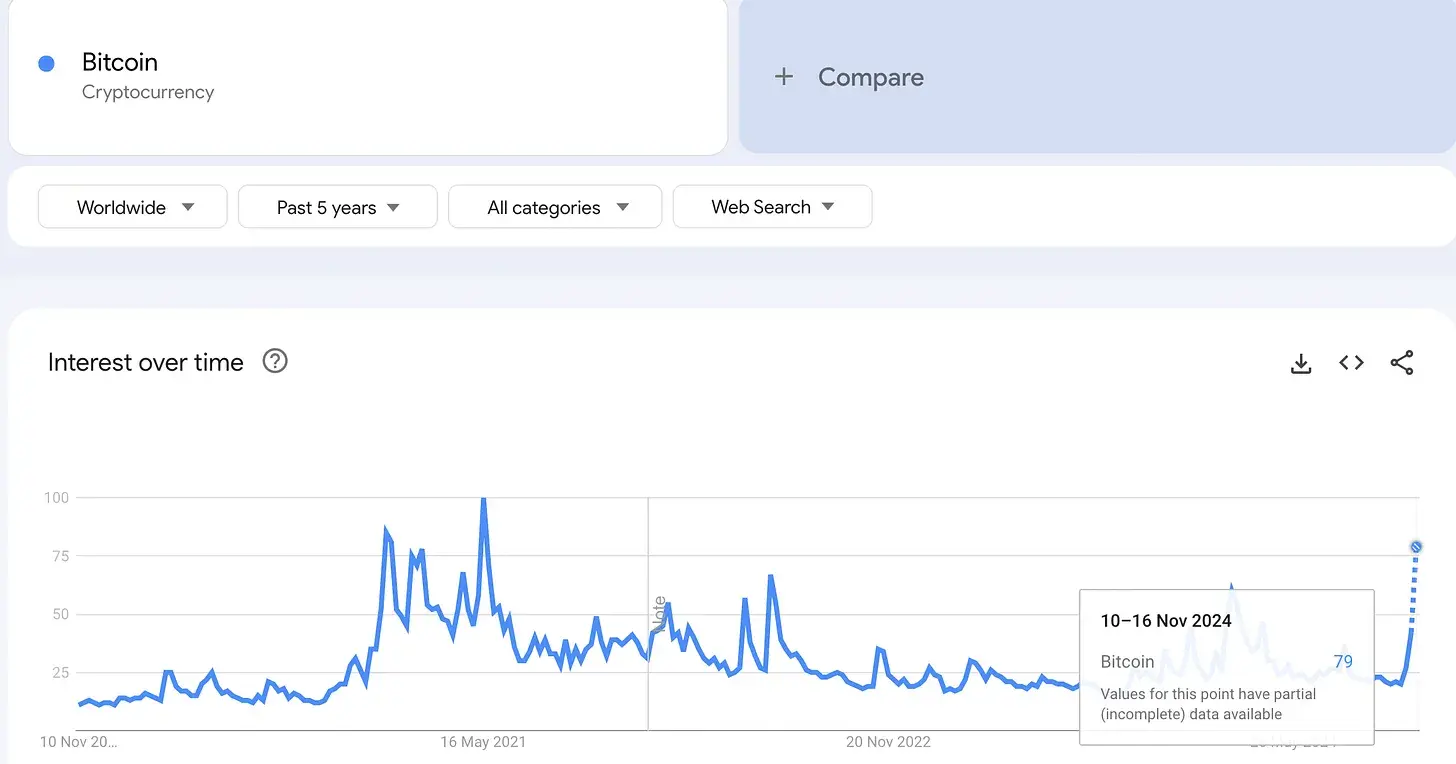
Source: Google Trends This is a noteworthy indicator, as we cannot determine what level "the new 100" will reach—although the current search volume is 79% of the peak in May 2021, this cycle may see significant growth as more users enter the crypto market.
- #### Venture capital funding levels in the crypto space

Source: Defi Llama We can at least see that the overall trend of funding is rising, so when these funding levels approach or exceed the $7 billion mark from October 2021, it may be close to the market top. Bitcoin peaked in November 2021, which may indicate a few months of lag in the market.
- #### Exchange fund flows remain neutral
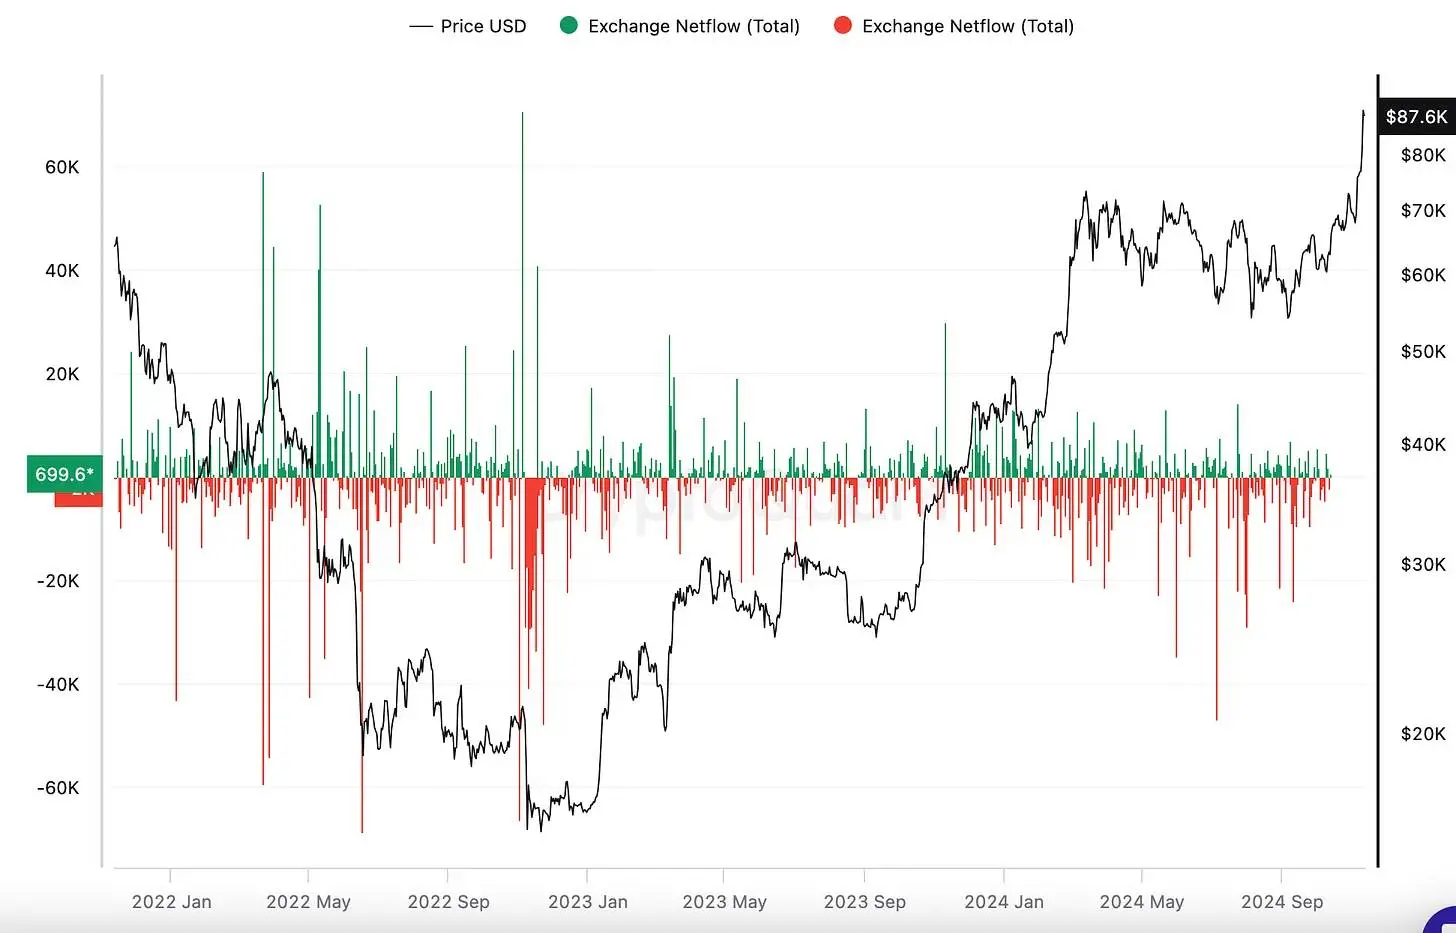
At market tops or bottoms, net flows on exchanges typically experience sharp fluctuations. Currently, fund flows remain neutral, indicating that many investors are satisfied with holding spot or maintaining investments on-chain.
- #### YouTube views related to cryptocurrencies

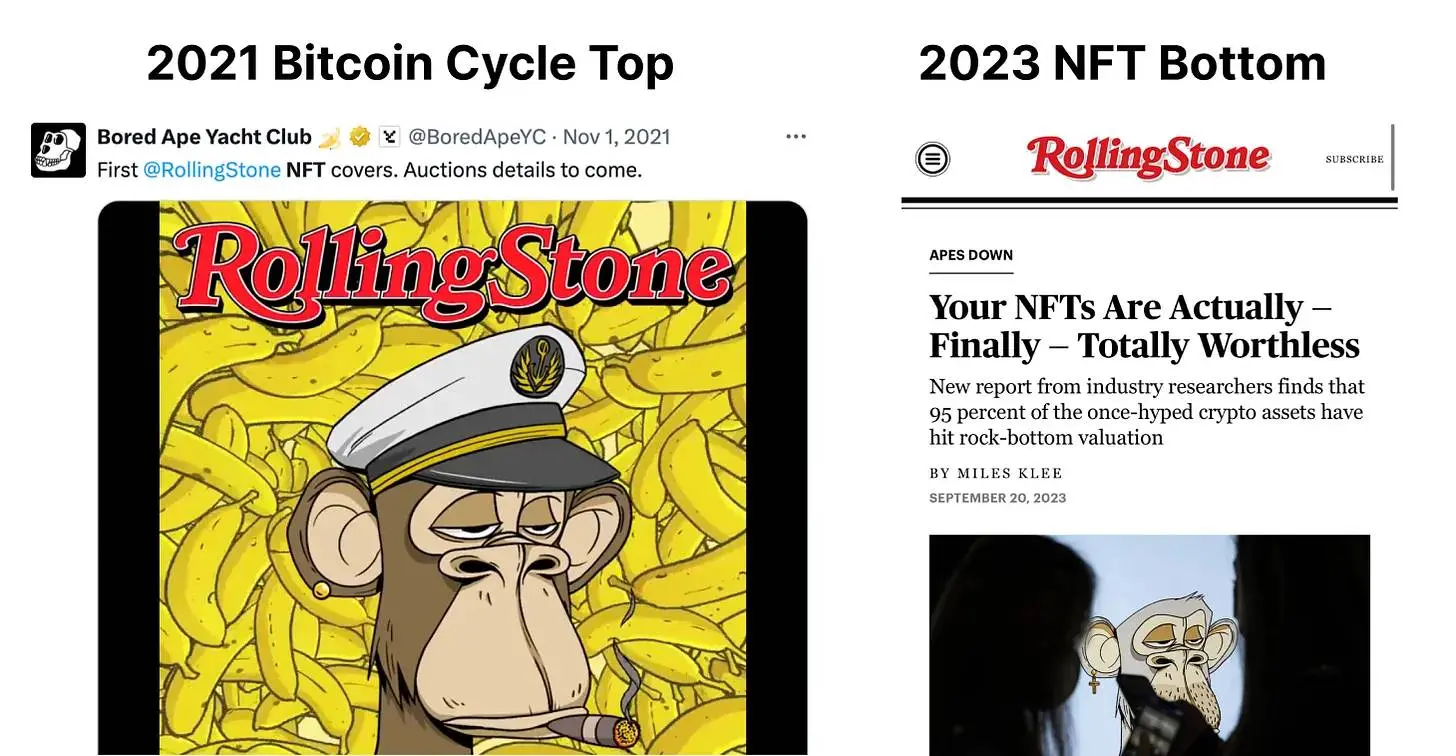
As ordinary traders see Bitcoin and cryptocurrencies gaining popularity in major news channels, crypto channels may become a primary source of information for non-crypto users. Counteracting mainstream media information may also be an effective strategy for selling when approaching market tops—Rolling Stone magazine was a good indicator at the NFT bear market bottom.
Other indicators to watch:
The time gap between the Bitcoin halving event and historical peaks—the supply shock has been embedded in the demand dynamics of the market, and Bitcoin miners also hold significant inventories.
Technical analysis indicators such as RSI, Pi, and MACD suggest that certain crypto assets may be oversold or undervalued.
Market value to realized value ratio: A ratio of 3.7 typically indicates the cycle top of the crypto market. It is necessary to compare market prices with realized value (i.e., the weighted average of the last on-chain transaction price).
Please check out the latest modern market show for a broader discussion.
Currently unable to display this content outside of Feishu documents.
I will gradually compile an analysis report to track these indicators and will provide you with weekly updates—please stay tuned.
免责声明:本文章仅代表作者个人观点,不代表本平台的立场和观点。本文章仅供信息分享,不构成对任何人的任何投资建议。用户与作者之间的任何争议,与本平台无关。如网页中刊载的文章或图片涉及侵权,请提供相关的权利证明和身份证明发送邮件到support@aicoin.com,本平台相关工作人员将会进行核查。


