Benefiting from Trump's victory in the U.S. presidential election, the cryptocurrency market has recently experienced a wave of celebratory trading, with Bitcoin surging since November 5, repeatedly hitting new historical highs and breaking the $90,000 mark yesterday. In addition to Trump's election potentially bringing a more relaxed regulatory environment for the cryptocurrency industry, another major catalyst for this bull market is the interest rate cut cycle initiated by the U.S. Federal Reserve at the end of September. However, the new economic policies that may come with Trump's presidency could mean that the Fed will not cut rates as many times next year as the market previously anticipated in September. Next year, the pace of rate cuts will be influenced by Trump's fiscal policies.
This is not good news for the safe-haven asset market, as the market's expectation of a 25 basis point rate cut by the Fed in December has significantly dropped from 84.4% a month ago to 55.2%. The probability of the Fed pausing rate cuts in December and maintaining rates in the 4.75%-5% range has risen from 15% a month ago to 44.8%.
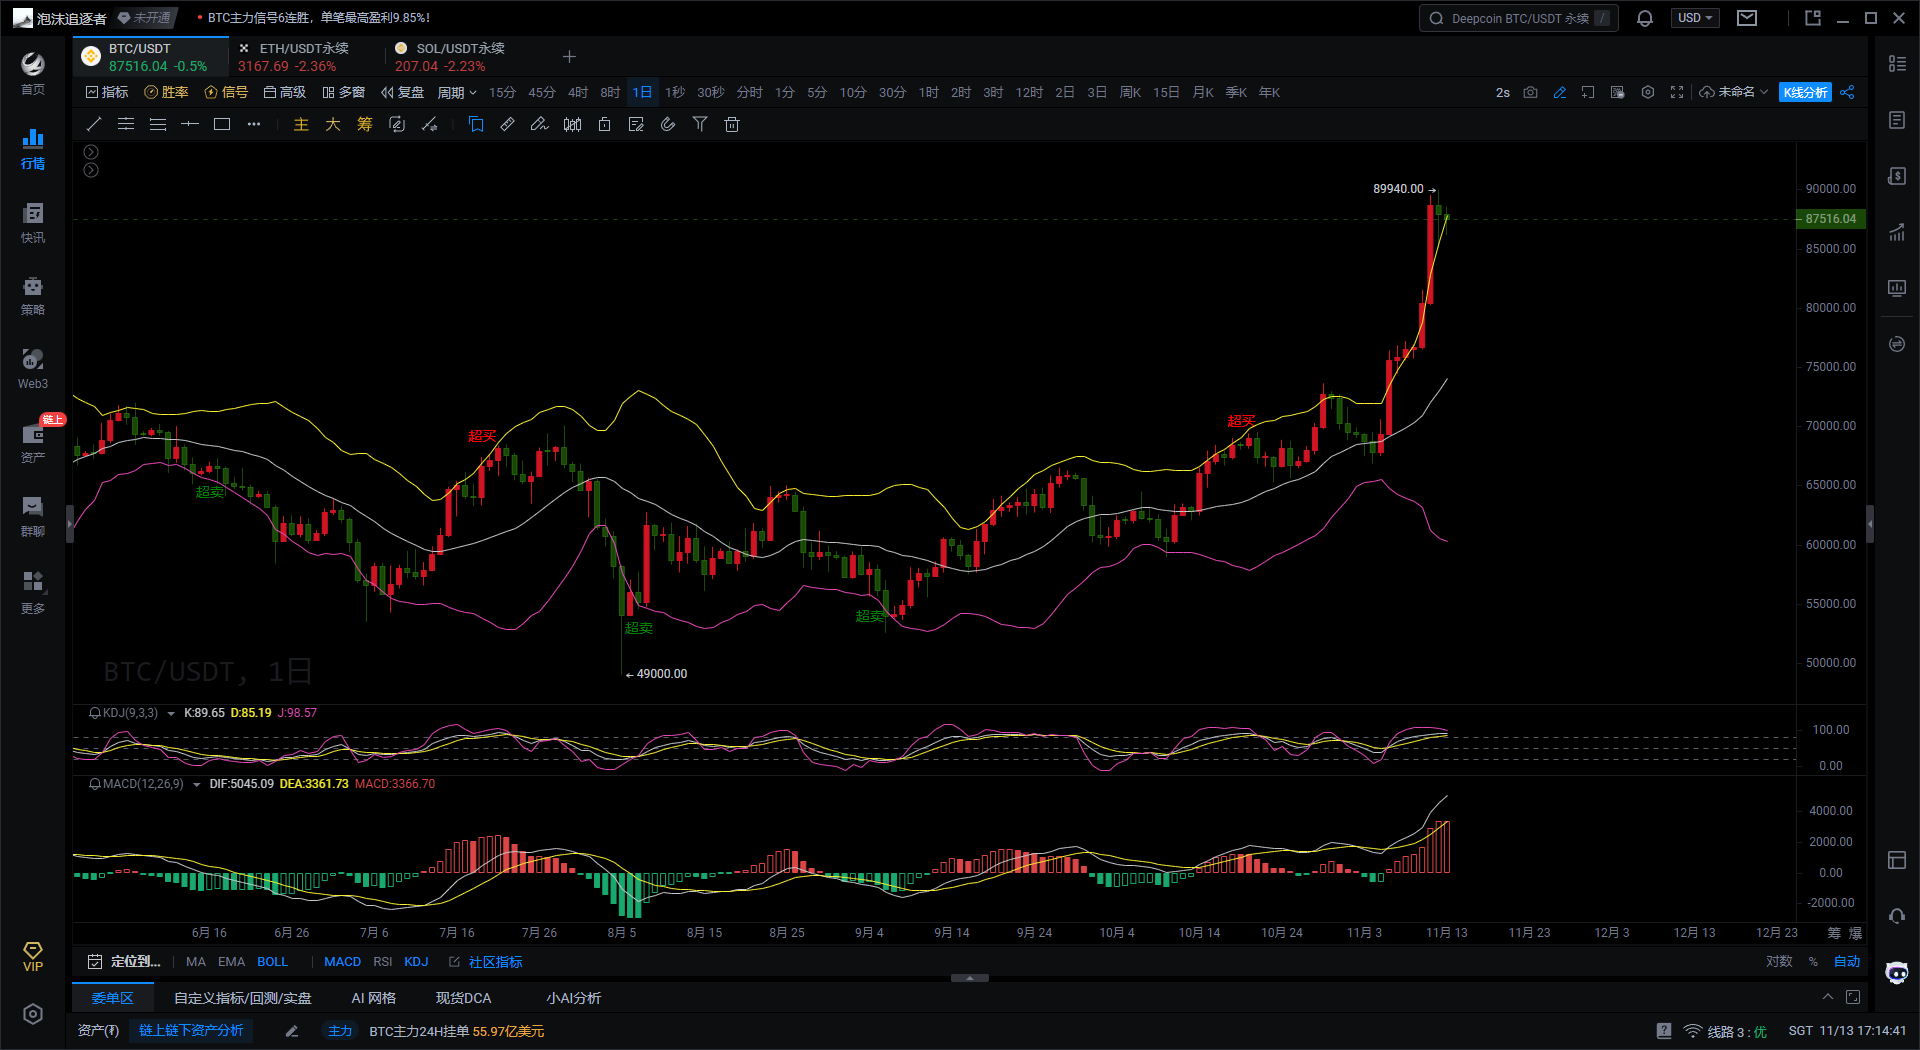
In terms of cryptocurrency, Bitcoin faced a setback around 8 PM last night, dropping to a low of $85,112. However, it quickly rebounded to challenge the $90,000 mark, only to fall back again, with the price at the time of writing being $87,436, down 1.94% in the last 24 hours.
Bitcoin Daily Chart

First, according to the Bollinger Bands indicator on the Bitcoin daily chart, the current price has broken above the upper band and is operating above it, indicating a clear overbought condition. When the price breaks above the upper band and continues to hover near it, it suggests a strong upward trend, but one must also be cautious of a potential pullback at any time. If the price continues to run along the upper band, it may maintain an upward trend. If the price falls back within the upper band, it may undergo a short-term adjustment or pullback.
Second, based on the KDJ indicator on the Bitcoin daily chart, the KDJ three-line values are currently in the high overbought zone, indicating a risk of overheating in the market, with a potential pullback in the short term. If the KDJ three-line values form a death cross at high levels, the likelihood of a pullback will increase.
Finally, according to the MACD indicator on the Bitcoin daily chart, the DIF line is above the DEA line and operating above the zero axis, forming a bullish pattern, which indicates that the market's upward momentum remains strong and may continue to maintain an upward trend in the short term. Additionally, the MACD red histogram is also continuously lengthening, confirming the bullish trend. However, the MACD indicator has reached a high position, and one should be aware of the risk of a pullback.
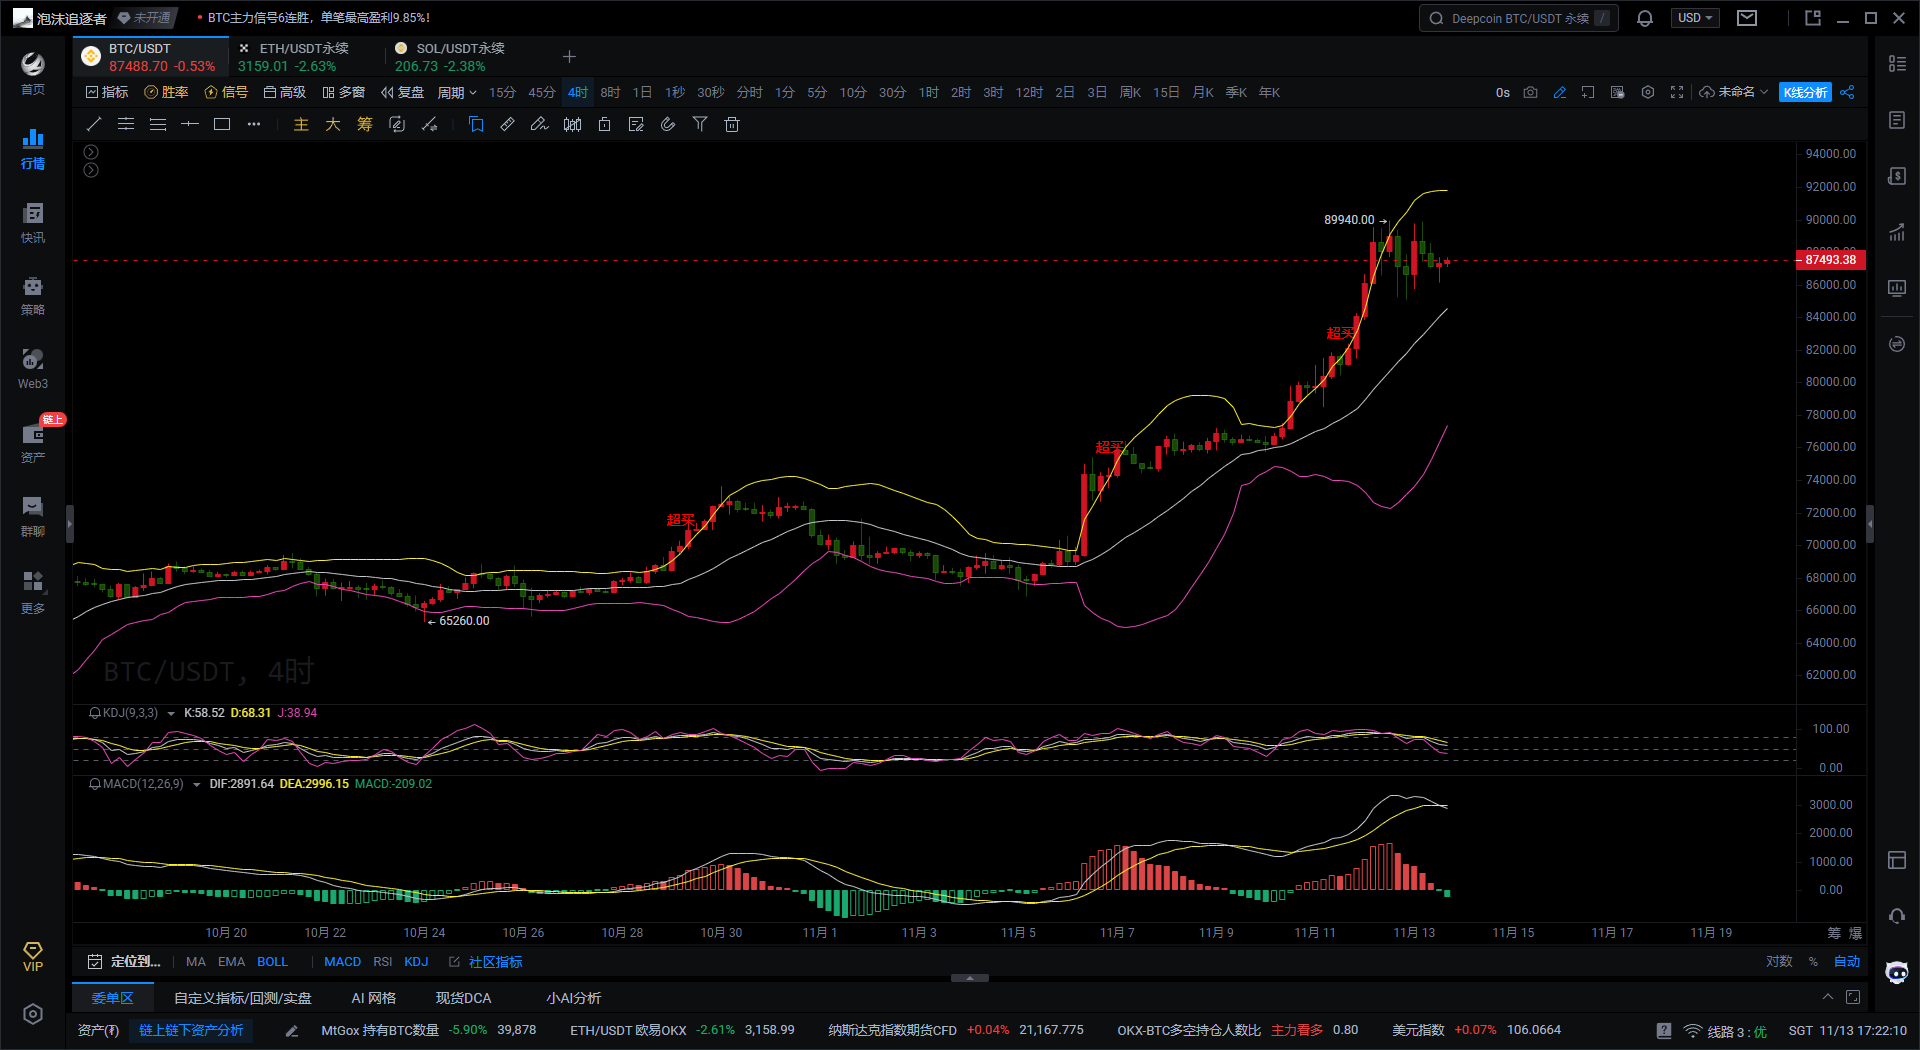
Bitcoin Four-Hour Chart

First, according to the Bollinger Bands indicator on the Bitcoin 4H chart, the current Bollinger Bands are widely opened, and although the price has retreated from the upper band, it is still operating between the middle and upper bands. If the price continues to fall and breaks below the middle band, the risk of a short-term pullback will increase, potentially reaching the support of the lower band. The middle band serves as a short-term support point; if it can rebound from here, the bulls will still have the advantage; otherwise, it may continue to decline.
Second, based on the KDJ indicator on the Bitcoin 4H chart, both the K line and D line values are at high levels and show a downward trend, indicating that the market is in an adjustment phase after being overbought in the short term. If the K line and D line values form a death cross downward, it may further push the price down. The KDJ three-line values have already pulled back from high levels, indicating insufficient upward momentum in the short term and an increased likelihood of a pullback.
Finally, according to the MACD indicator on the Bitcoin 4H chart, the current DIF line has crossed below the DEA line on the zero axis, forming a death cross pattern. Additionally, the MACD red histogram has turned from red to green, indicating that bullish strength is gradually weakening, which significantly increases downward pressure in the short term.
In summary, based on the Bitcoin daily chart, Bitcoin still shows a strong upward trend, but multiple indicators have entered the overbought zone, indicating potential pullback risks in the short term. According to the Bitcoin 4H chart, there are clear signals of adjustment. The weakening bullish momentum of the MACD, the high-level pullback of the KDJ indicator, and the pressure from the upper Bollinger Band are all evident. If the KDJ forms a death cross subsequently and the MACD continues to weaken, Bitcoin may continue to pull back. The middle band of the Bollinger Bands can serve as a short-term support level; if the price finds support and does not break below it, there is a possibility of a rebound; if the middle band is lost, it may seek support at the lower band.
Based on the above analysis, the following suggestions are provided for reference:
Suggestion 1: Short Bitcoin near $87,800, targeting $86,000-$85,200, with a stop loss at $88,300.
Suggestion 2: Long Bitcoin near $85,200, targeting $88,000-$89,000, with a stop loss at $84,600.
Instead of giving you a 100% accurate suggestion, I prefer to provide you with the right mindset and trend. After all, teaching someone to fish is better than giving them fish; suggestions may earn you a moment, but learning the mindset can earn you a lifetime! The focus is on the mindset, grasping the trend, and planning the layout and positions. What I can do is use my practical experience to help you, guiding your investment decisions and management in the right direction.
Writing time: (2024-11-13, 17:15)

(Written by - Master Says Coin) Disclaimer: Online publication has delays; the above suggestions are for reference only. The author is dedicated to research and analysis in the fields of Bitcoin, Ethereum, altcoins, forex, stocks, etc., with years of experience in the financial market and rich practical trading experience. Investment carries risks; please proceed with caution. For more real-time market analysis, please follow the official account Master Says Coin for discussion and exchange.
免责声明:本文章仅代表作者个人观点,不代表本平台的立场和观点。本文章仅供信息分享,不构成对任何人的任何投资建议。用户与作者之间的任何争议,与本平台无关。如网页中刊载的文章或图片涉及侵权,请提供相关的权利证明和身份证明发送邮件到support@aicoin.com,本平台相关工作人员将会进行核查。


