Master's Discussion on Hot Topics:
Thinking back on the years of in-depth research on Bitcoin feels like a wonderful adventure. Gradually, I discovered that Bitcoin resembles a mysterious realm woven from mathematics and statistics, with its patterns as captivating and perplexing as the stars in the universe.
The causes of many patterns seem shrouded in mist. Initially, I was skeptical, thinking they were merely coincidences. However, my personal experiences over the past few years have allowed me to witness numerous patterns operating like a precise clock.
Bitcoin has a 224-day cycle and halving events in 2017, 2021, and 2024, with significant price fluctuations around these time points. This phenomenon was also mentioned in my video analysis last year. (Everyone can open their candlestick charts and compare the daily levels of these three years for clarity.)
After careful verification, I found that each peak occurs every 224 days, and the next corresponding date is November 30. This led me to wonder if we might witness a magical scene: Ethereum, like a brave general, leading the army of altcoins, causing Bitcoin's market cap to decline rapidly.
From the current market perspective, this possibility is indeed significant. Firstly, we have already entered the last approximately 10 months of this bull market cycle, akin to the climax of a grand performance, with excitement about to unfold.
In this process, Bitcoin and Ethereum are like the two main characters on stage, alternating in showcasing relative strength. Each role switch lasts about 4 to 7 weeks, during which even pullbacks are part of their performance. From now on, Ethereum seems poised to take the lead, with a high likelihood of outperforming Bitcoin.
Moreover, in this final bull market frenzy, Bitcoin will not have a smooth ride; it will experience multiple pullbacks of 20% to 30%. Just like a calm period after heightened emotions, the more wildly it rises, the more frightening the pullbacks will be. Just as we see this current surge, a terrifying pullback may soon follow.
Additionally, almost all altcoins (as long as they are not obscure coins) will have their moment in the spotlight.
Recently, Bitcoin's performance has been nothing short of insane, with consecutive surges triggering strong FOMO in the market. A few days ago, futures became the dominant force in the market, with funding rates soaring and premiums rising significantly.
The logic behind this is twofold: on one hand, there are favorable expectations of interest rate cuts, and on the other, the stimulus from the news of Trump potentially returning to power. Earlier this week, the news of MicroStrategy buying over $2 billion added fuel to the fire, causing Bitcoin's price to soar to $90,000. This level is already close to 161.8%, making it seem easy to break historical highs.
However, I must seriously remind all friends not to let this frenzy cloud their judgment; blindly chasing after rising prices carries great risks. If a pullback occurs, it would be wise to buy in batches and take a long position for the short and medium term.
Fans can refer to my article analyzing the peak pullback in March. Currently, $80K and $74K are important support levels. In the crypto world, we must see opportunities while remaining clear-headed, so we can confidently navigate through the changing tides.
Master's Trend Analysis:

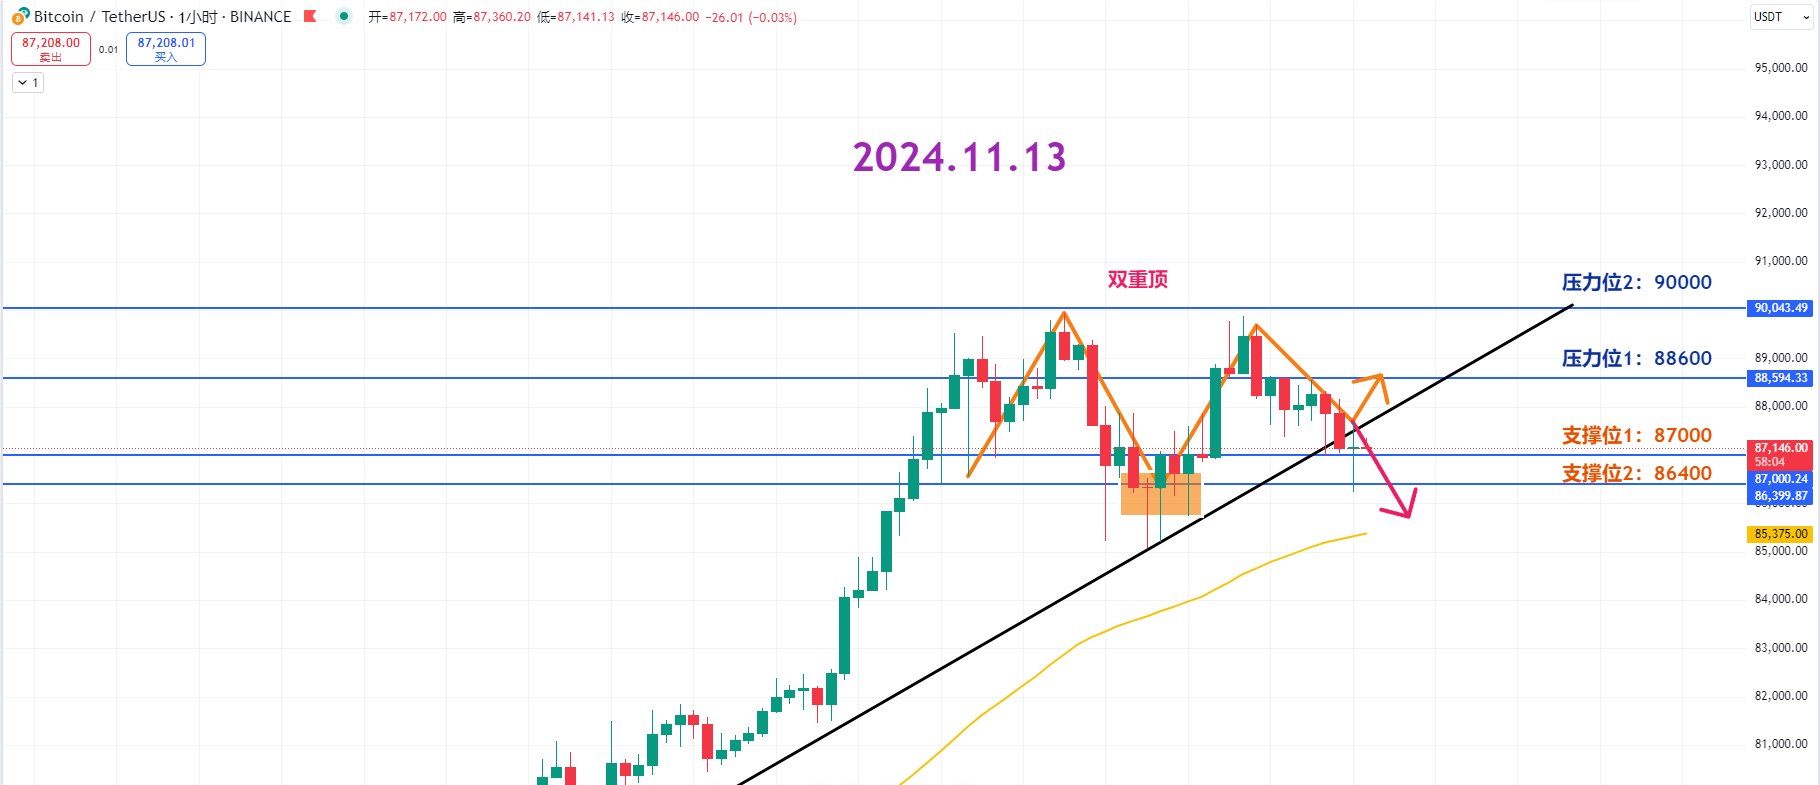
After testing $90K, Bitcoin formed a double top pattern and re-entered the adjustment range. Currently, it is fluctuating within a box range after the rise. Since it still maintains an upward trend, we can keep the expectation of a rebound.
The stronger-than-expected Trump market is continuously bringing funds into the market. As long as it does not break below the bottom of the box range, the expectation of a rebound can continue.
Resistance Levels:
First Resistance Level: 88600
Second Resistance Level: 90000
Support Levels:
First Support Level: 87000
Second Support Level: 86400
Today's Suggestions:
Currently, Bitcoin must break through new highs within the day to expect further increases. At this stage, where $90,000 has failed to test twice, if it cannot refresh the high during a rebound, be cautious of a sell-off due to disappointment from another test.
If it breaks below the second support, the probability of price adjusting to EMA60 will increase. Since it is still within the box range, one can try to find buying opportunities during the pullback.
11.13 Master's Wave Strategy:
Long Entry Reference: Based on the 4-hour EMA25, consider going long in the 83400-84000 range. Target: 86400
Short Entry Reference: Light short in the 87000-87500 range. Target: 86400-86000
This article is exclusively planned and published by Master Chen (public account: Coin God Master Chen). For more real-time investment strategies, solutions, spot trading, short, medium, and long-term contract trading techniques, and knowledge about candlesticks, you can join Master Chen for learning and communication. A free experience group for fans and community live broadcasts are now available!

Friendly Reminder: This article is only written by Master Chen on the official public account (as shown above). Other advertisements at the end of the article and in the comments are unrelated to the author! Please be cautious in distinguishing between true and false, and thank you for reading.
免责声明:本文章仅代表作者个人观点,不代表本平台的立场和观点。本文章仅供信息分享,不构成对任何人的任何投资建议。用户与作者之间的任何争议,与本平台无关。如网页中刊载的文章或图片涉及侵权,请提供相关的权利证明和身份证明发送邮件到support@aicoin.com,本平台相关工作人员将会进行核查。


