How will the market move after approaching the 90,000 mark? Bitcoin
Bull Market Not Over: The bull market has not ended yet, but a short-term pullback may be imminent. A bull market does not rise in a straight line; there will be fluctuations.
Pullback Expectations:
1. On-chain Data: Bitcoin supply situation indicates that the market may experience a significant pullback between 90,000 and 110,000. Key Support: The real pullback support may be below 81,000 or 77,000.
2. CME Futures: Data shows there is a gap between 77,000 and 80,000, and a pullback to around 77,000 is expected within the month.
3. Contract Long/Short: If the price drops, there is a large amount of capital that may be liquidated at 72,000 and 77,000, so the pullback range may be between 70,000 and 77,000.
4. Market Sentiment: Current market sentiment is overheated, with a high greed index, and the MEME coin sector is experiencing panic buying (FOMO), which usually indicates that a short-term pullback is near.
5. Altcoin Situation: Bitcoin's dominance is close to 60%, indicating that the bull market is still ongoing, and the chips have not been widely dispersed.
Summary and Recommendations:
The market may continue to rise in the short term, but the 100,000 mark may trigger a pullback.
The pullback is unlikely to drop below 70,000; consider gradually buying below 80,000.
The medium to long-term bull market remains unchanged, and there is no consideration of the bull market ending for now.
In short, the market may pull back in the short term, but the long-term bull market remains intact, and below 80,000 is a good opportunity.
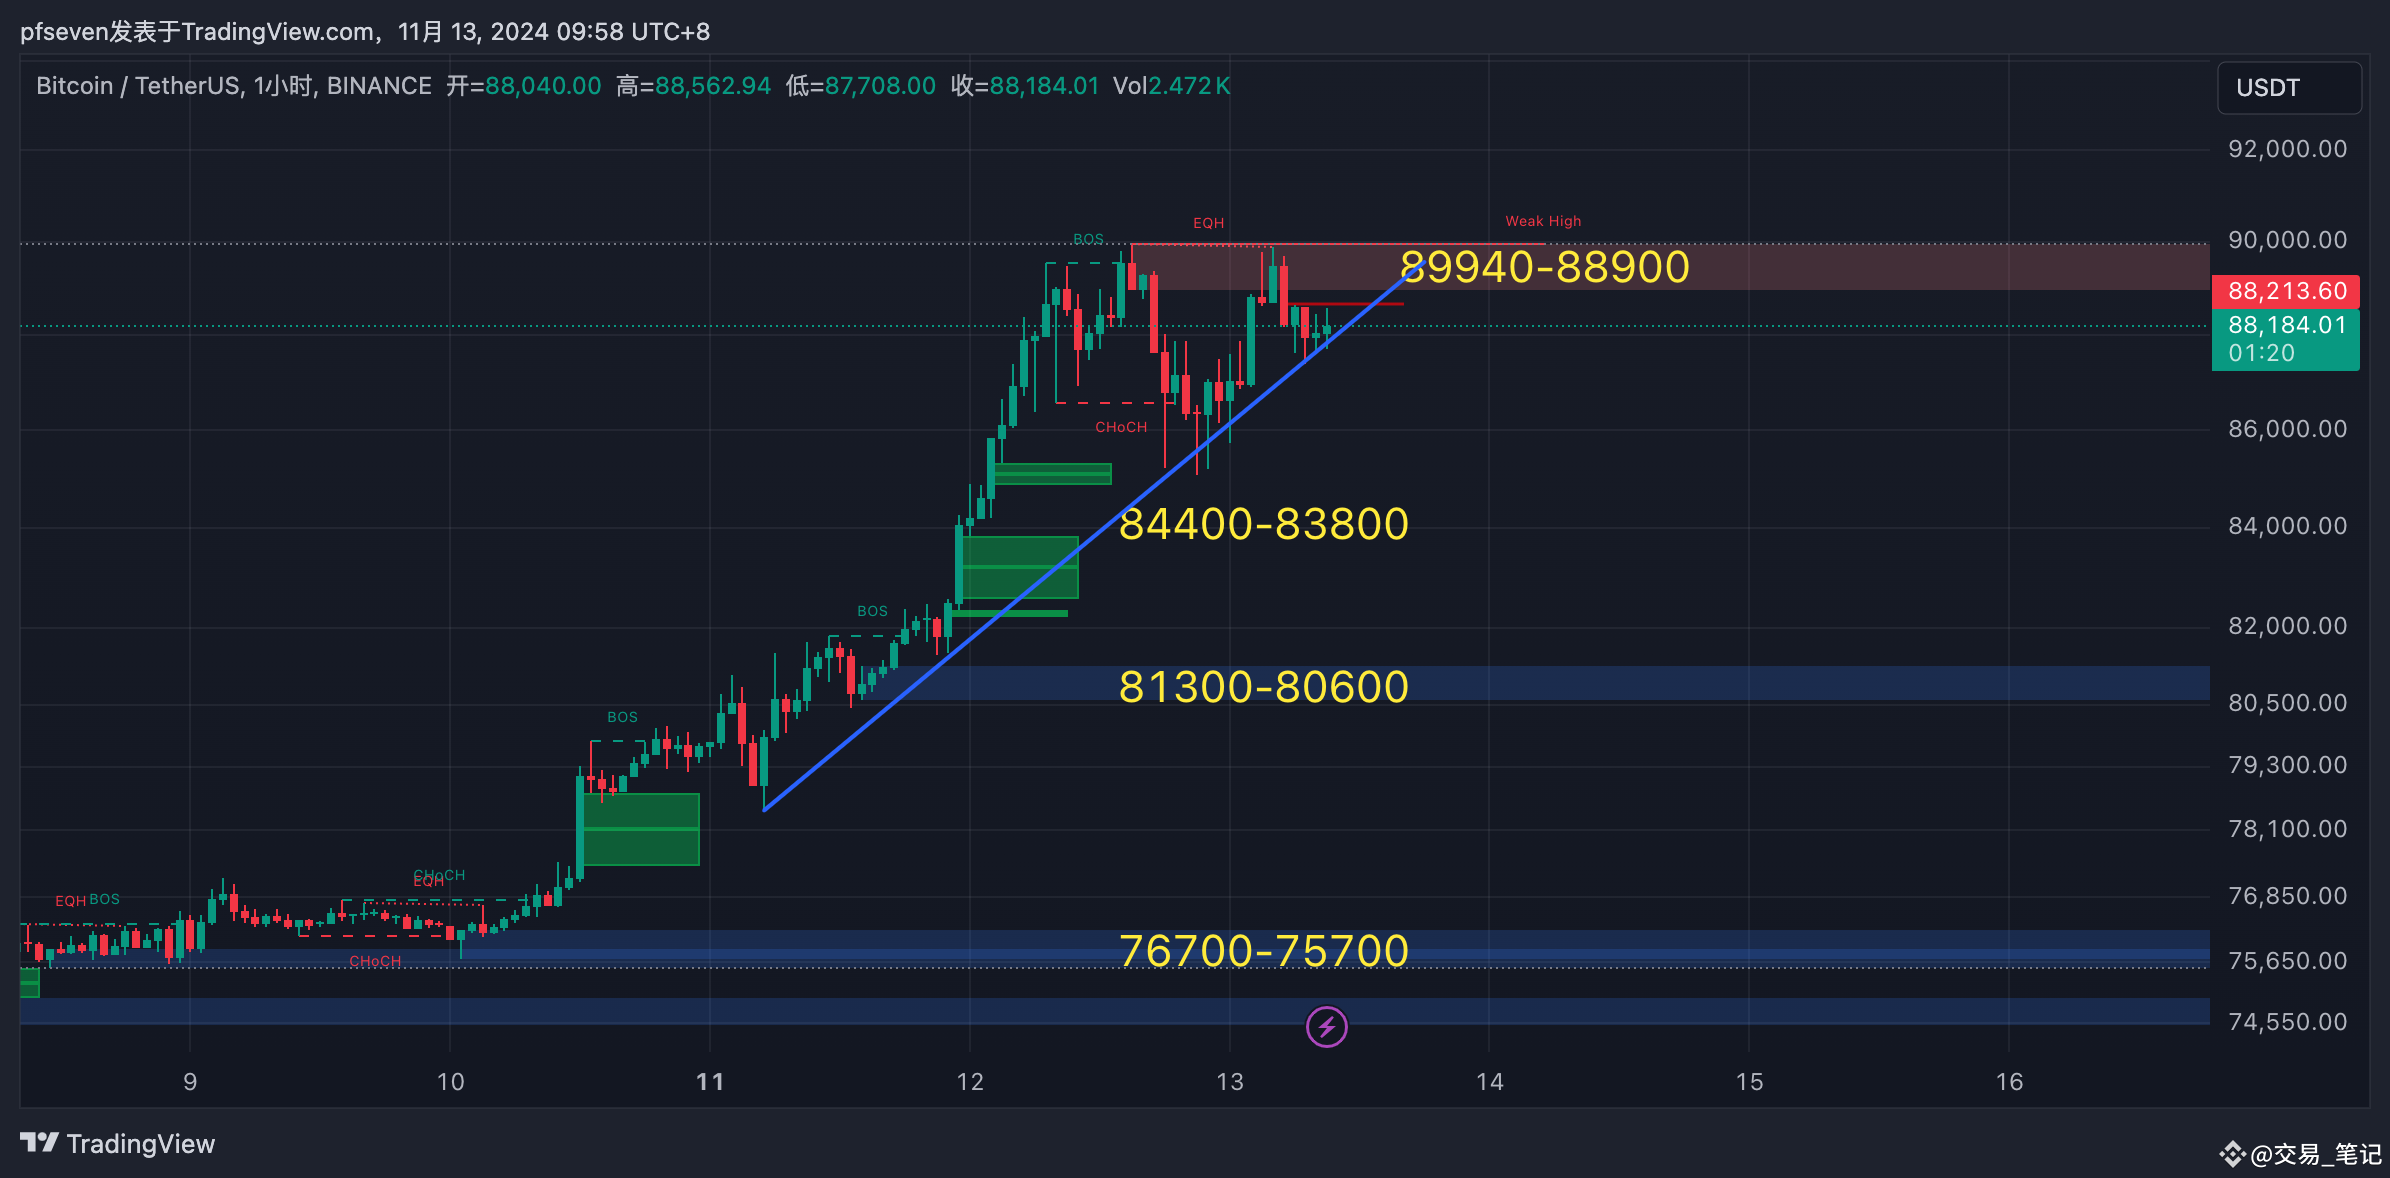
The price has retraced to the blue trend line on the H1 chart, and there was at least a profit of 3,500 points from the position near 89,000 yesterday! As long as the price does not break below the blue trend line, there is still a chance to seize liquidity at higher points. Pay attention to whether 89,940-88,900 is rejected today. If rejected downwards, first look at the 84,400-83,800 range, while also watching for buying opportunities here! If it breaks through, look upwards to 91,800-92,000, and then 93,000!

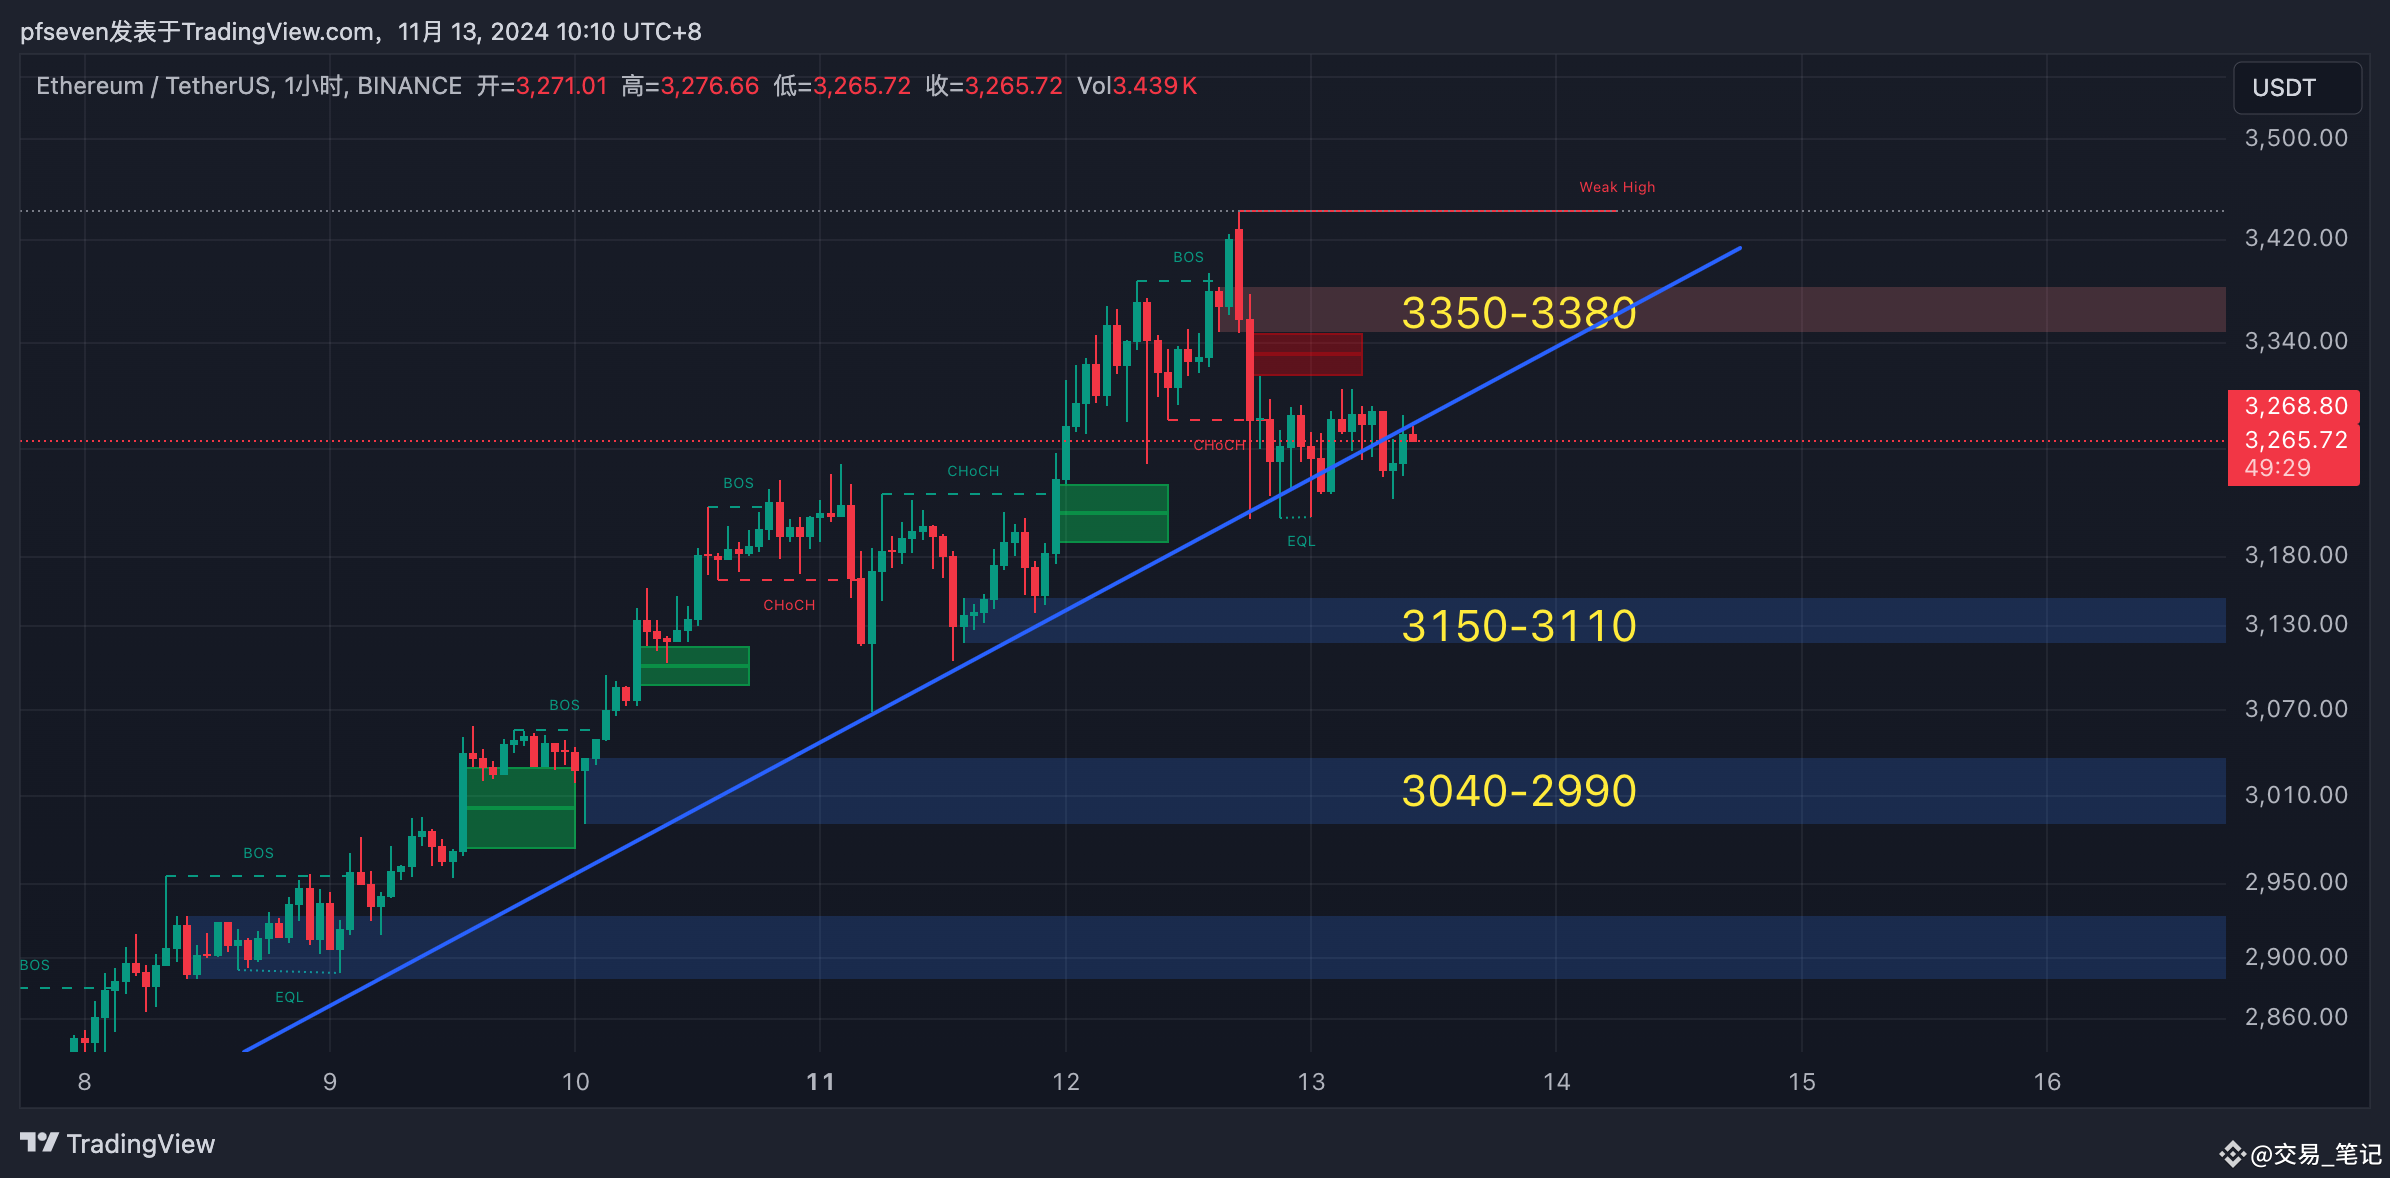
Yesterday's position around 3,400! Those who were not swept out have nearly 200 points of profit downwards! Currently, the H1 has broken below the blue trend line, forming a central range, with short-term pressure at 3,350-3,380. If rejected, it will continue downwards! The lower range of 3,150-3,110 is waiting to be tested! Pay attention to buying opportunities here!

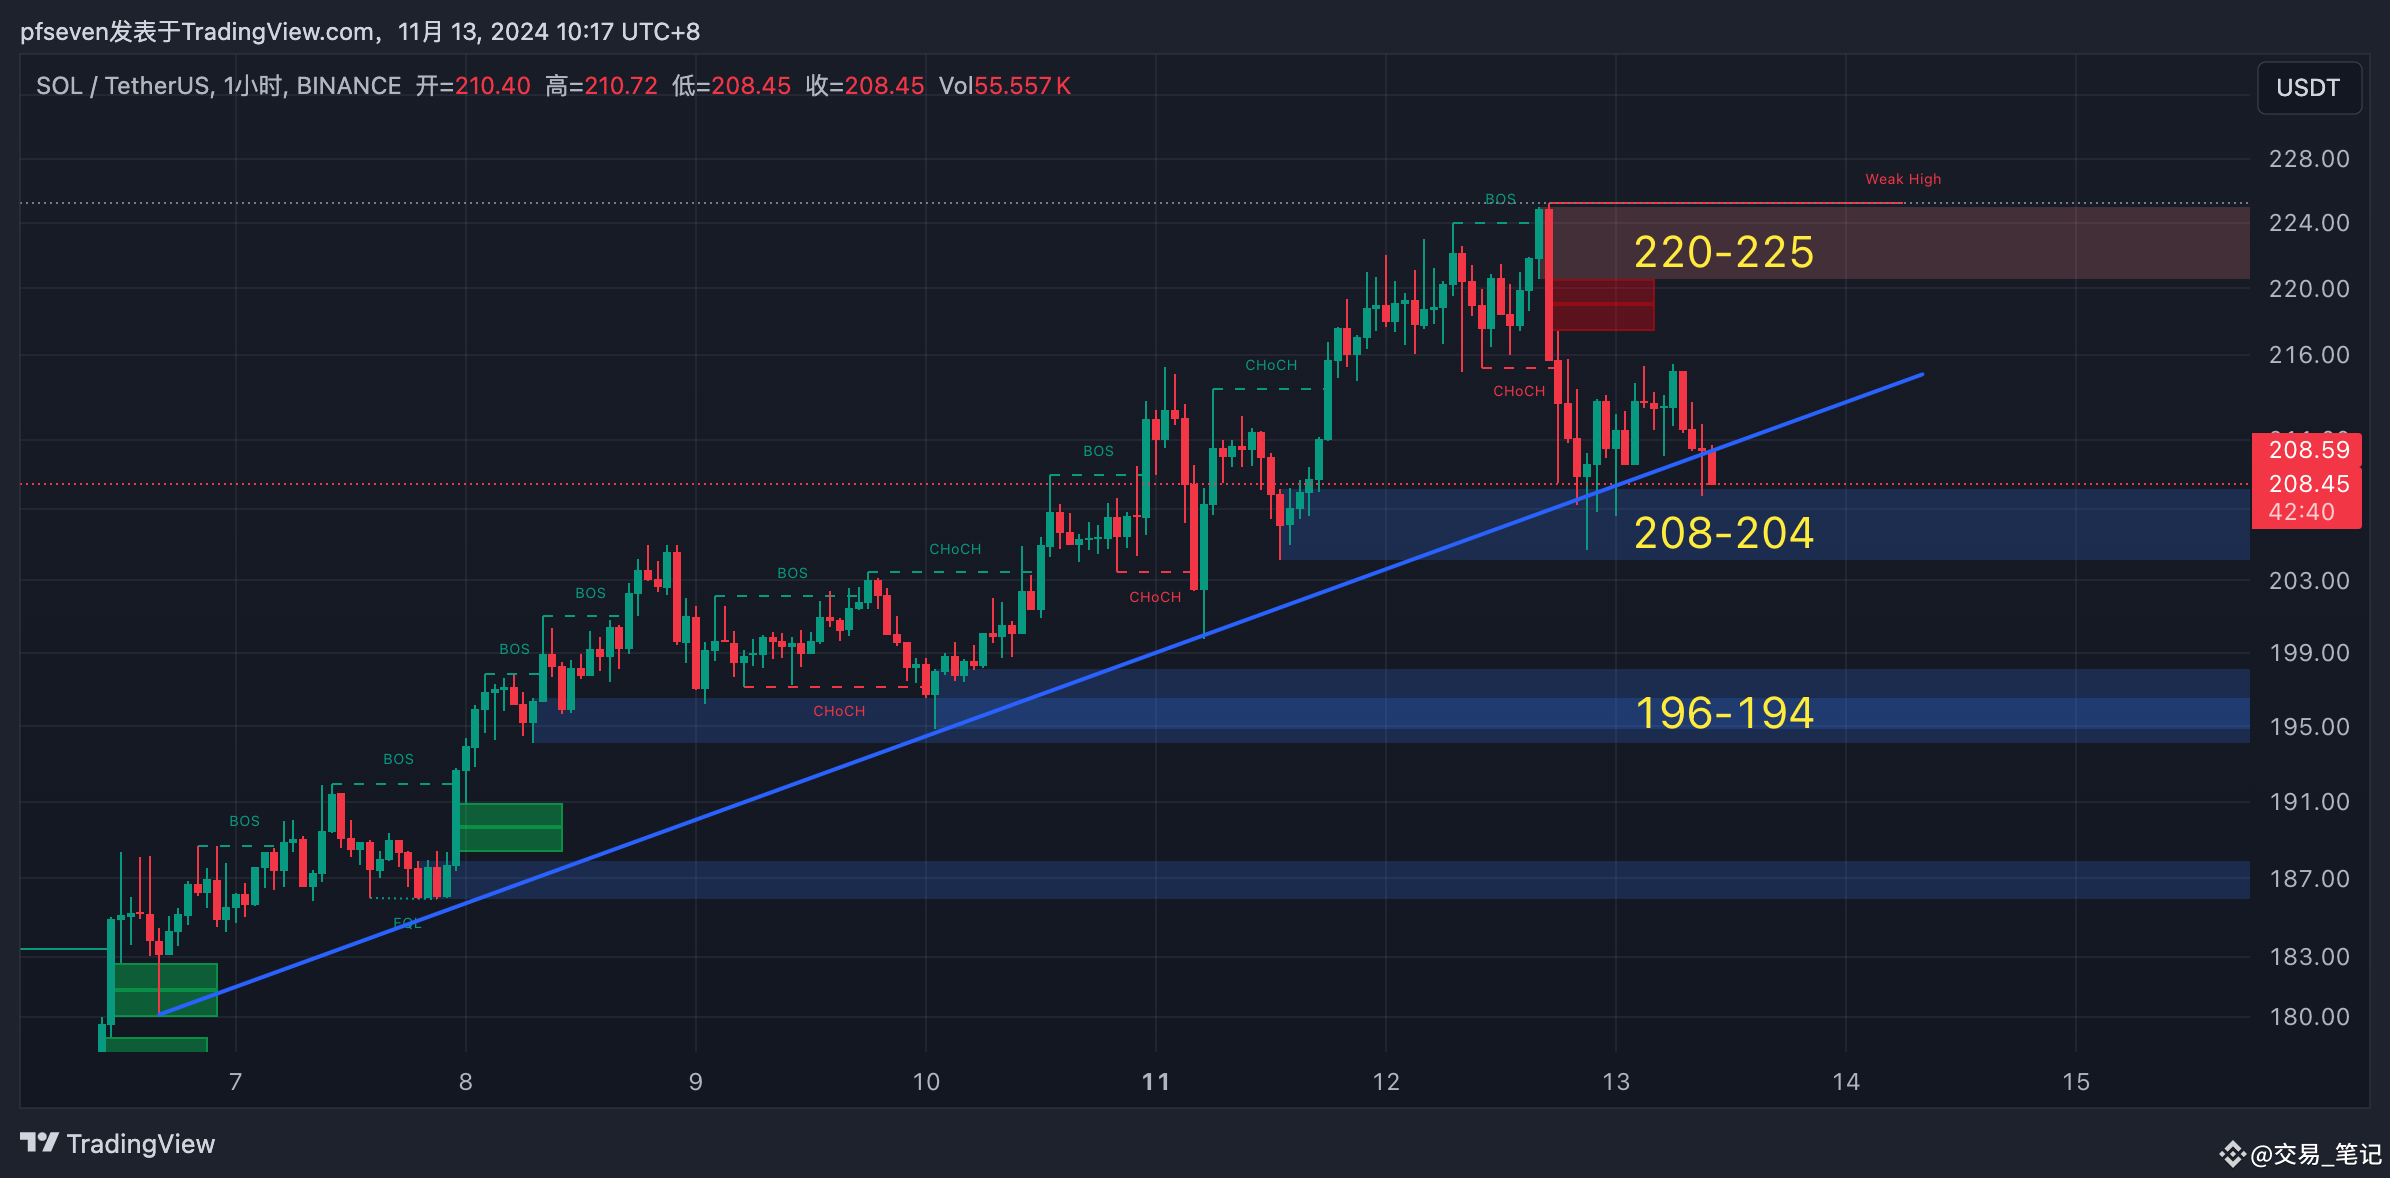
Yesterday's range of 204-208, entering means profit! The price peaked at 215! No stop-loss for breakeven handling! Because the price is currently breaking below the trend line! If 204 breaks, it will continue downwards, first looking at 196-194, while also watching for buying opportunities here!

The information and data involved in this content are sourced from publicly available materials, striving for accuracy and reliability, but no guarantee is made regarding the accuracy and completeness of the information. The content does not constitute any investment advice, and any investment based on it is at your own risk!

免责声明:本文章仅代表作者个人观点,不代表本平台的立场和观点。本文章仅供信息分享,不构成对任何人的任何投资建议。用户与作者之间的任何争议,与本平台无关。如网页中刊载的文章或图片涉及侵权,请提供相关的权利证明和身份证明发送邮件到support@aicoin.com,本平台相关工作人员将会进行核查。


