Master Discusses Hot Topics:
New high again! Bitcoin has successfully broken through $89,000, reaching a peak of $89,800, heading towards $90,000. Currently, Bitcoin's total market capitalization has reached $1.76 trillion, surpassing silver's $1.73 trillion, making it the eighth largest asset in the world.
In the past 7 days, Bitcoin has risen by 31%, and many people are beginning to envision the possibility of its market cap exceeding that of silver, although there is still a significant gap to catch up with gold's market cap of $17.65 trillion, which is about 10 times away.
The long-term appreciation trend of Bitcoin is undeniable, but the current market sentiment seems overly exuberant, and the short-term surge in the market may be difficult to sustain. Is there still room for further increases? Personally, I believe the current price may not be the peak; after breaking through $90,000, it may be wise to gradually consider rational profit-taking in the medium to long term.
As I mentioned before, Bitcoin is essentially similar to tech stocks in the U.S. stock market, thus it will fluctuate with the movements of the U.S. stock market. Trump has always supported interest rate cuts, and if he vigorously promotes this in the future, it will release more liquidity.
In a market where concerns about inflation are low and the Federal Reserve is expected to maintain interest rate cuts rather than hikes in the short term, Bitcoin may still rise. The market is currently betting on the potential benefits of Trump possibly coming to power, but the momentum brought by this sentiment may not be sustainable.
In my previous analysis at the end of October, I mentioned that Bitcoin might pull back from $75,000 to $60,000, then rise again to $80,000; after pulling back from $80,000 to $77,150, the target would be $90,000. The current price has almost reached this expectation, but it may still need to build a top in the coming months.
Historically, Bitcoin usually peaks before altcoins, which may still have room for catch-up, but caution is advised.
Regarding Ethereum, I personally believe it may have two potential trends in the future: 1. If Ethereum falls below $2,720, it could rebound like a king to $3,600! Just like that low-key big brother who finally can't hold back and shows up to ask if everyone is still around? However, this market is also a mix of acceleration and braking.
- Alternatively, it may just take a small step back, shake off a bit, and continue charging towards $3,600. However, when it comes back this time, it probably won't be at $2,720 anymore; it will likely be a new starting point.
Regarding the MACD on Ethereum's weekly chart, if it can pull back below the zero line, it is likely that it will need to revisit the bottom again, and this bull run may just be a short sprint.
But if it pulls back gracefully above the zero line, it might still be able to oscillate and carry the bull head up a slope. It's just like that seasoned player floating in the rivers and lakes, leisurely stepping up and down around the zero line; even if there are some bumps, it remains unshaken.
In short, Ethereum is like an old hand, full of tricks and deep strategies, and it could change its game at any moment. Therefore, everyone in the market is keeping a close eye on it, fearing it might suddenly have a flash of inspiration and change its approach, continuing to push the market forward.
Master Looks at Trends:

Yesterday, I set a buy order in the 80,000-80,600 range during the pullback, and it dropped to around 80,400 in the afternoon. The bullish target of 81,400 to 82,000 was perfectly reached, gaining 1,500 points.

Due to Bitcoin's overall upward trend, it is difficult to find clear support levels. Analyzing in lower time frame charts is more beneficial at this time, as it can better identify areas where highs are formed.
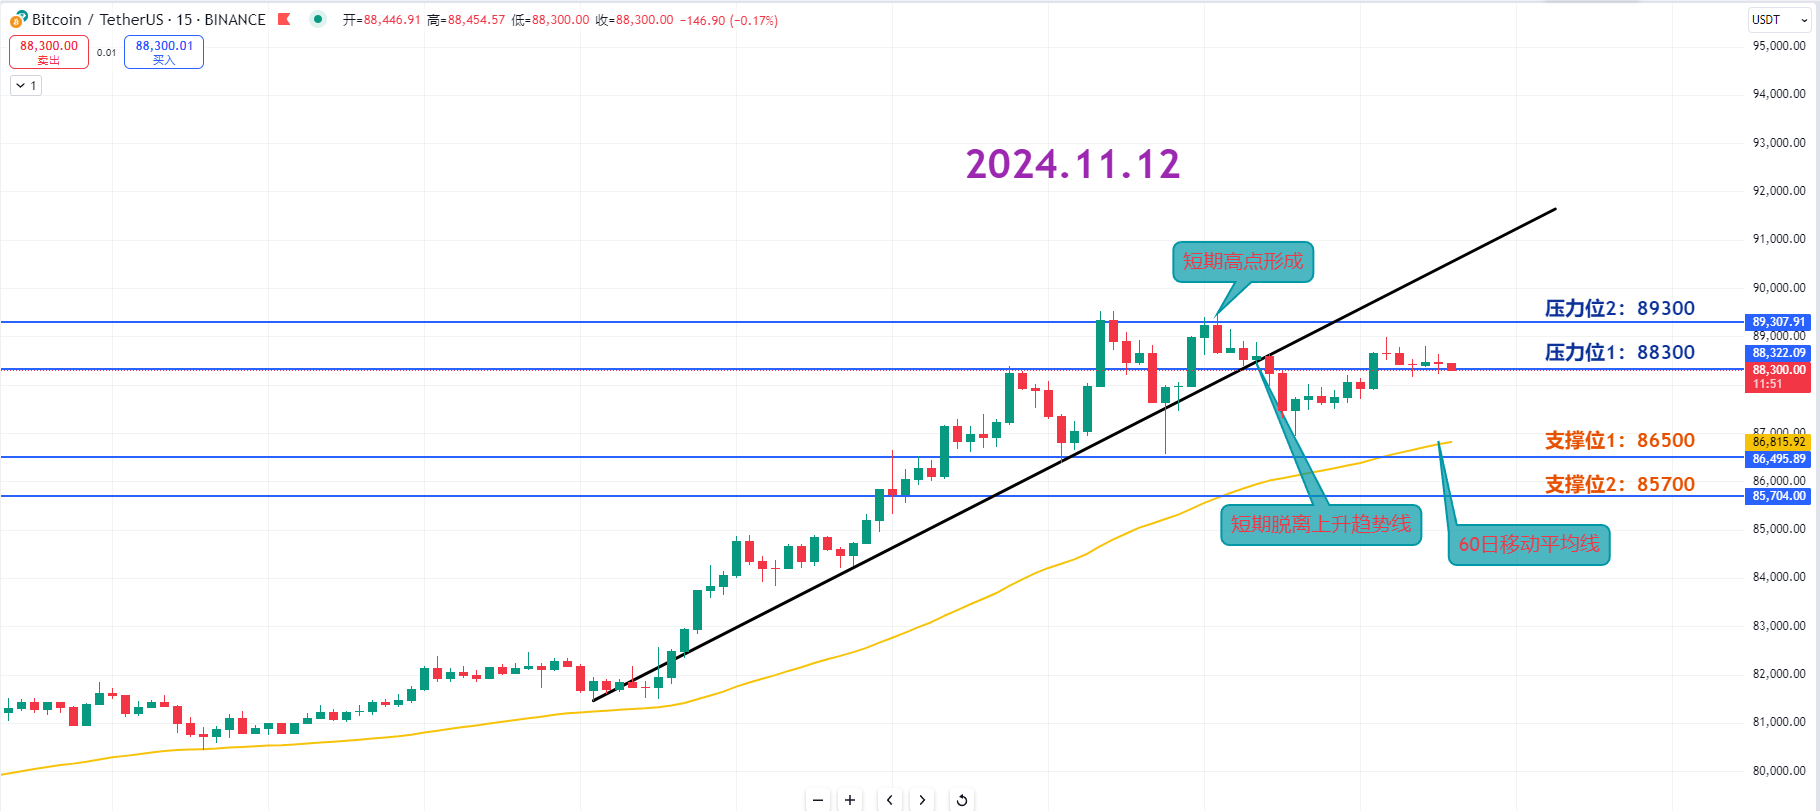
Currently, after reaching close to the $89,000 high, it has entered an adjustment range, and the short-term upward trend has been broken, which also presents an opportunity for further adjustment. It is recommended to closely monitor the movement of moving averages.
Resistance Levels:
First Resistance Level: 88,300
Second Resistance Level: 89,300
Support Levels:
First Support Level: 86,500
Second Support Level: 85,700
Today's Trading Suggestions:
Unlike previous adjustments, this time Bitcoin has formed a double top pattern, and the short-term trend has deviated from the upward trajectory. Further adjustments can be expected to find more favorable entry positions.
In today's trading, Bitcoin's current high point of 89K is being retested and accompanied by adjustments, so consider the opportunity for a rebound during the pullback.
If the K-line price is too far from the moving average, it usually returns to the moving average. Therefore, observe the short-term, medium-term, and long-term moving averages in 15-minute and longer time frames to find entry opportunities.
11.12 Master’s Trading Plan:
Buy Entry Reference: Consider light positions around 87,200-87,500; if it pulls back to the 86,500 range, go long directly. Target: 88,300-89,300
Sell Entry Reference: Not applicable
This article is exclusively planned and published by Master Chen (public account: Coin God Master Chen). Master Chen is the same name across the internet. For more real-time investment strategies, solutions, spot trading, short, medium, and long-term contract trading techniques, operational skills, and knowledge about K-lines, you can join Master Chen for learning and communication. A free experience group for fans has been opened, along with community live broadcasts and other quality experience projects!

Warm reminder: This article is only written by Master Chen on the official account (as shown above), and any other advertisements at the end of the article and in the comments are unrelated to the author! Please be cautious in distinguishing authenticity. Thank you for reading.
免责声明:本文章仅代表作者个人观点,不代表本平台的立场和观点。本文章仅供信息分享,不构成对任何人的任何投资建议。用户与作者之间的任何争议,与本平台无关。如网页中刊载的文章或图片涉及侵权,请提供相关的权利证明和身份证明发送邮件到support@aicoin.com,本平台相关工作人员将会进行核查。


