Background: BTC at $73,000 may be the support price for this round.
Bitcoin broke out of a six-month consolidation range on November 6, surpassing $73,000. The reasons behind this are closely related to Trump's election victory and the initiation of a rate-cutting cycle.
Trump's election victory: Before the election, he promised to implement several crypto-friendly policies, including making the U.S. the global cryptocurrency capital and removing the current SEC chairman. While it is uncertain whether he can fulfill these promises once in office, it is foreseeable that the regulatory pressure the crypto market has often faced will ease under Trump's administration, undoubtedly a major factor driving the market upward.
Rate-cutting cycle initiated: Lowering interest rates means the U.S. is releasing more liquidity into risk markets, theoretically boosting stock markets and other fiat currency asset classes. As the asset with the highest risk and relatively smaller market capitalization, Bitcoin can also benefit from this. In November, a rate cut was implemented, and the market reacted positively in traditional finance, with the S&P closing at a new high and the bond market rising. However, the transmission of liquidity often takes time, and Q4 2024 presents an opportunity for the crypto market to absorb the overflow of liquidity.
From policy to liquidity release, we are currently in the "early bull" phase. Given that Bitcoin's previous peak is characteristic of a new round of support, we can boldly assume that $73,000 is the support price for this bull market.
Having confirmed the support, how high can Bitcoin's price go in this bull market? WOO X Research takes you to explore.
BTC Compared to Other Mainstream Asset Market Caps: $110,000 to $220,000
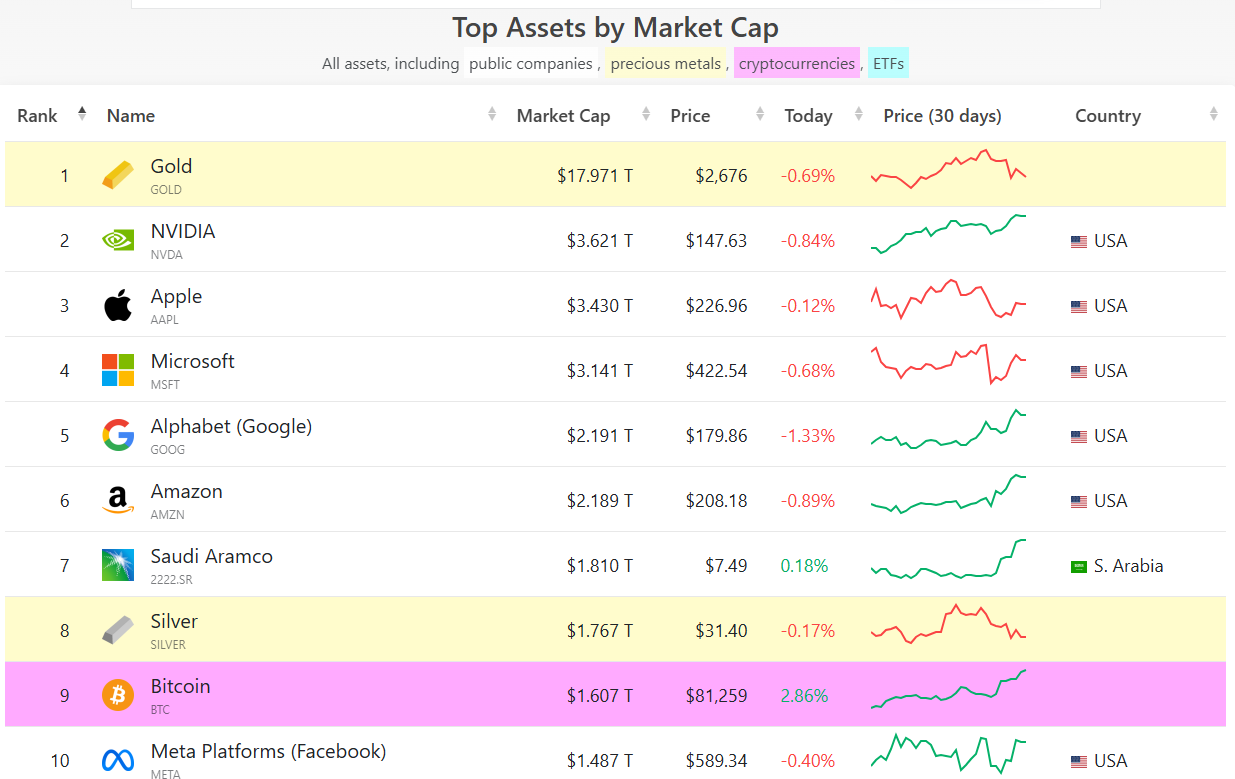
Currently, Bitcoin's market cap is $1.6 trillion, having surpassed Meta last month, ranking as the ninth largest asset globally after silver. Since the approval of Bitcoin spot ETFs in January this year, Bitcoin is no longer seen as a niche asset but has risen to become a mainstream asset. With Trump's election victory further boosting its visibility, Bitcoin's growth potential can now be compared to other mainstream assets.
As is well known, Bitcoin is also referred to as digital gold, and its current market cap is about 9% of gold's. Below are several scenarios to estimate Bitcoin's potential future price:
If Bitcoin's market cap reaches 25% of gold's, at $4.5 trillion, the price would reach $227,162.
If Bitcoin's market cap equals that of NVIDIA, the price would reach $183,645.
If Bitcoin's market cap surpasses Google, reaching fifth place, the price would reach $111,730.
In terms of market cap, Bitcoin is expected to break into the top five global assets in this bull market, with a projected peak price range of $110,000 to $220,000.
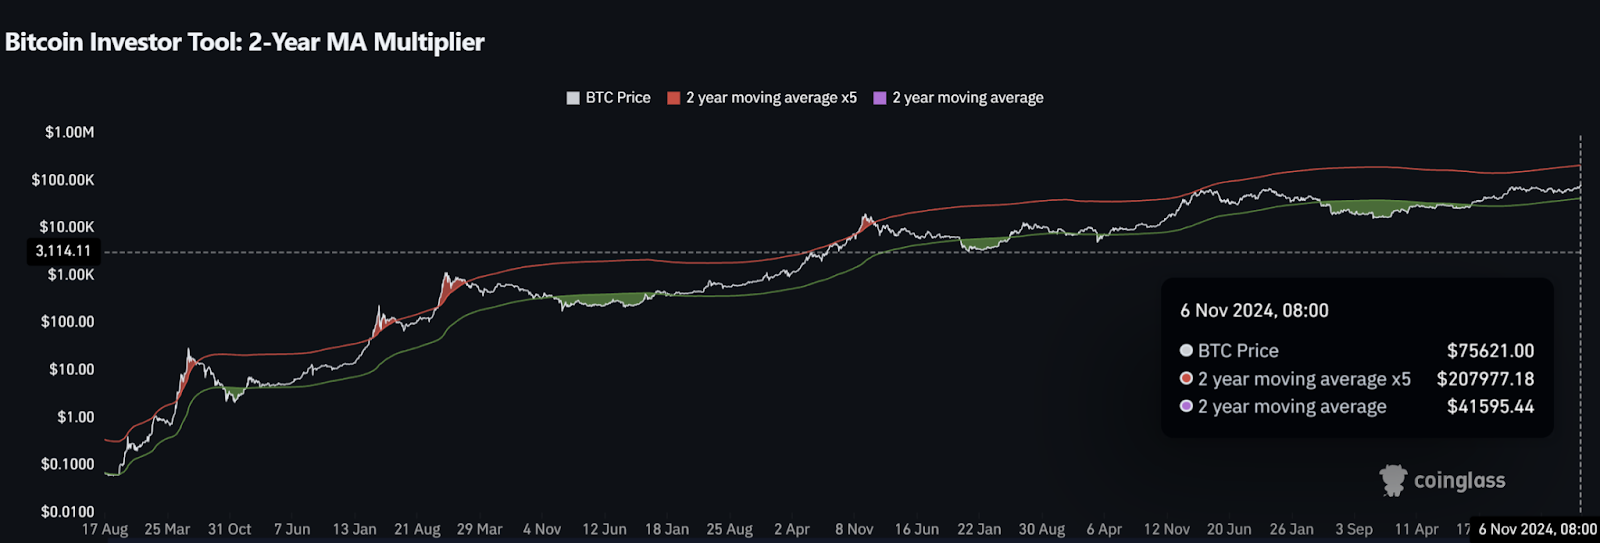
Bitcoin Peak Indicator: At Least $200,000
This indicator uses two data points for judgment:
Two-year moving average (730 days, green line)
Five times the two-year moving average (red line)
Usage:
When Bitcoin's price is below the two-year moving average (green line), it is a good time to buy Bitcoin.
When the price exceeds five times the two-year moving average (red line), it is a signal to sell Bitcoin.
How to interpret this indicator? It represents whether the short-term price breaks through or falls below the average price of long-term holders, with the low point benchmark being the average price over the past two years. If it is below the green line, it indicates a drop below the recent two-year low, representing excessive panic, making it a good long-term buying point.
The red line is five times the two-year average price; once breached, it indicates excessive FOMO in the market, often a sign of overheating, suitable for selling.
Reviewing Bitcoin's past price performance generally aligns with this pattern. According to the information in the chart below, on November 6, Bitcoin's price was about $75,000, while the red line price was $207,977, and Bitcoin's price has been continuously reaching new highs recently, which will also raise the red line price. This indicator suggests that the peak price for this round is at least $200,000.
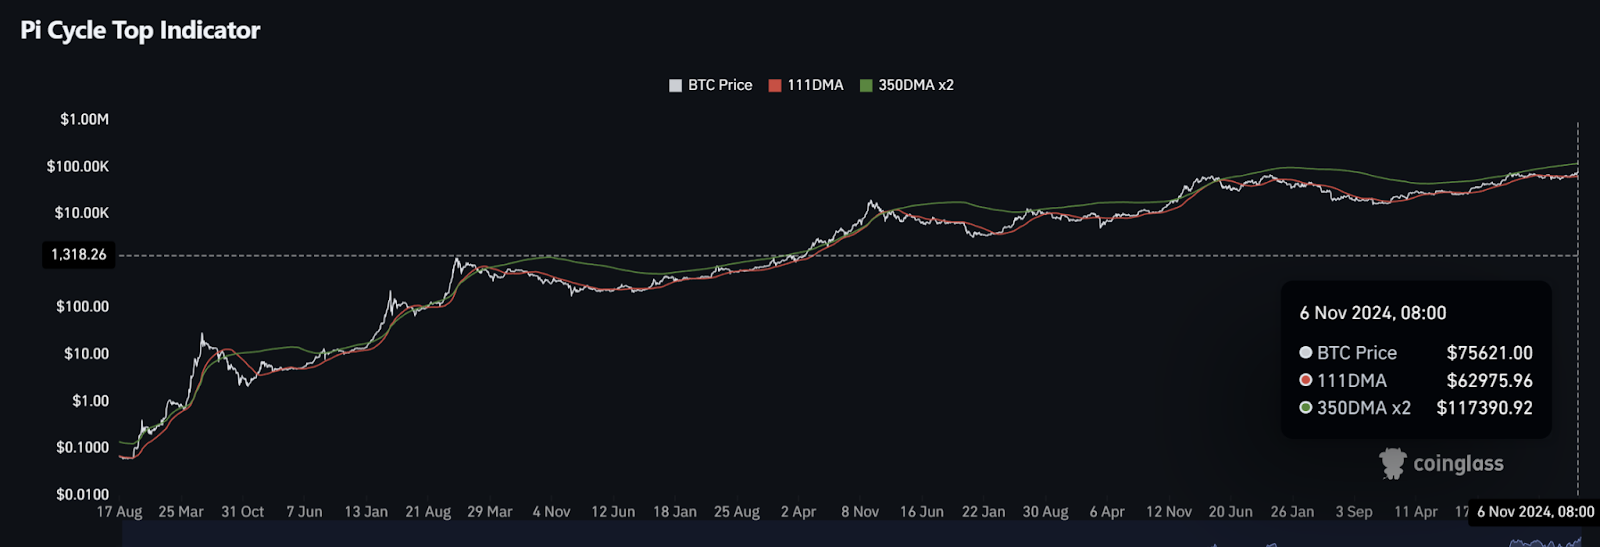
Pi Cycle Top Indicator: At Least $110,000
This indicator uses two sets of data to determine whether Bitcoin is in an overheated state:
111-day moving average (111DMA, red line)
Twice the 350-day moving average (350DMA x 2, green line)
Usage:
When the 111-day moving average rises and breaks through twice the 350-day moving average, it usually indicates that Bitcoin's price has reached a peak, signaling a sell.
How to interpret this indicator?
The Pi Cycle top indicator observes whether the short-term price breaks through the average price of long-term holders, thereby assessing the market's overheating level. When the 111DMA (red line) breaks through the 350DMA x 2 (green line), it typically means the market is overly optimistic, exhibiting FOMO (fear of missing out) sentiment, often a sign of overheating, suitable for considering selling.
According to the latest chart information, on November 6, 2024, Bitcoin's price was approximately $75,621, while the 350DMA x 2 price was about $117,390. This indicates that when Bitcoin's price approaches or exceeds this level, it may signal the peak of this market cycle.
免责声明:本文章仅代表作者个人观点,不代表本平台的立场和观点。本文章仅供信息分享,不构成对任何人的任何投资建议。用户与作者之间的任何争议,与本平台无关。如网页中刊载的文章或图片涉及侵权,请提供相关的权利证明和身份证明发送邮件到support@aicoin.com,本平台相关工作人员将会进行核查。


